10-1
Chapter
10
Operations Planning and Scheduling
DISCUSSION QUESTIONS
1. Over the past several years, many corporations have experienced reductions in the
workforce of sufficient size to receive attention in the media. Restructuring charges
reflected in the annual reports to stockholders are often in the order of magnitude of
$100,000 per employee. If business is expected to recover within a year, the company
would usually be better off to keep these employees on the payroll, perhaps shifting
some of them to sales, or loan others for community volunteer work. It is difficult to
estimate the monetary value of the following costs associated with layoffs:
❑ Decreased morale and loyalty of employees not laid off
❑ Employee stress, mortgage defaults, failed marriages, suicides
2. Responses will vary depending on which firms are used as examples. Some
industries, such as the U.S. auto industry, have a long history and tradition of
workforce furlough and recall to match production with demand. Generations of
employees are accustomed to this cycle, and fairly smoothly transition between
3. As a first step in MLB’s planning process, the organization’s direction and objectives
are set in the business plan. For MLB, their objectives are further developed into an
annual game schedule – which lays out which team plays which other team as part of
a series, whether this series is a two game, three game or four game series and, also,
whether the series is home or away. This is done for each of the 30 teams in the
league, thus resulting in a schedule of around 2,430 games spread over approximately
780 series over a 6-month period. The MLB would try to forecast game attendance,
⚫ PART 2 ⚫ Managing Customer Demand
10-2
take into consideration major events at the different cities (for example, a political
convention) and other major sporting events that would pose a conflict, in order to
maximize ticket revenue and television viewership revenue in developing the game
schedule. So, in this context, the level 1 Sales and Operations Plan for the MLB is
rather “fixed.” Once the game schedule for the entire season is developed, it also
helps determine the number of umpires needed to officiate the games.
At the next levels, resource planning and especially scheduling, umpires are assigned
to the various games with the goal of minimizing the number of miles traveled by
each umpire crew, while also keeping in mind that, because of union vacation
requirements each week, only 15 umpire crews will be available for scheduling.
There are also a number of constraints which need to be considered when determining
the schedules for the umpires. These include keeping each umpire crew together
throughout the season, providing an intermediate day off for crews traveling from the
west coast to the east coast and/ or working consecutive series more than 1,700 miles
apart, avoiding crews working more than 21 days without a day off (the 21-day rule),
avoiding the same crew umpiring more than one series played by any team within an
18-day period (the 18-day rule) and, finally, avoiding the same umpire crew working
more than four series played by any one team during the entire season.
4. Priority systems affect operations performance and aid management in making
operational decisions. They facilitate prioritizing of work in the organization, as all
PROBLEMS
S&OP Strategies
1. Barberton Municipal Division of Road Maintenance
a. The peak demand is 19,000 hours in quarter 3. As each employee can work
600 hours per quarter (500 on regular time and 100, or 0.20 500, on overtime),
the level workforce that relies just on overtime, allows no delay, and minimizes
undertime is
Operations Planning and Scheduling ⚫ CHAPTER 10 ⚫
10-3
The total undertime hours can be calculated as:
Quarter 1
32(500) – 6,000
=
10,000
hours
Quarter 2
32(500) – 12,000
=
4,000
Quarter 4
32(500) – 9,000
=
7,000
21,000
hours
b. The chase strategy:
Quarter
Demand (hr)
Workforce
Hires
Layoffs
1
6,000
12
1
2
12,000
24
12
3
19,000
38
14
4
9,000
18
0
20
TOTAL
92
27
20
Cost
Calculation
Amount
Regular wages
($6,000 per quarter)(92)
$552,000
Hire costs
($3,000 per hire)(27 hires)
81,000
Layoff costs
($2,000 per layoff)(20 layoffs)
40,000
TOTAL
$673,000
c. Proposed plan
This plan uses a mixed strategy. Although it uses the chase strategy for the first
Quarter
Demand (hr)
Workforce
Hires
Layoffs
Overtime (hr)
1
6,000
12
1
2
12,000
24
12
3
19,000
31
7
3,500
4
9,000
18
0
13
0
TOTAL
85
20
13
3,500
Cost
Calculation
Amount
Regular wages
($6,000 per quarter)(85)
$510,400
Hire costs
($3,000 per hire)(20 hires)
60,000
Layoff costs
($2,000 per layoff)(13 layoff)
26,000
Overtime
($18 per hour)(3,500 hours)
63,000
TOTAL
$659,000
2. Bob Carlton’s Golf Camp
a. The level strategy:
The peak demand is 6,400 hours in quarter 2. As each employee can work 600 hours
Cost
Calculation
Amount
Regular wages
($7200 per quarter)(11)(8 quarters)
$633,600
Overtime wages*
(1,120 hr in quarter 2)($20 per hr)
22,400
(960 hr in quarter 6)($20 per hr)
19,200
Hire costs
($10,000 per hire)(3 hires)
30,000
TOTAL
$705,200
⚫ PART 2 ⚫ Managing Customer Demand
10-4
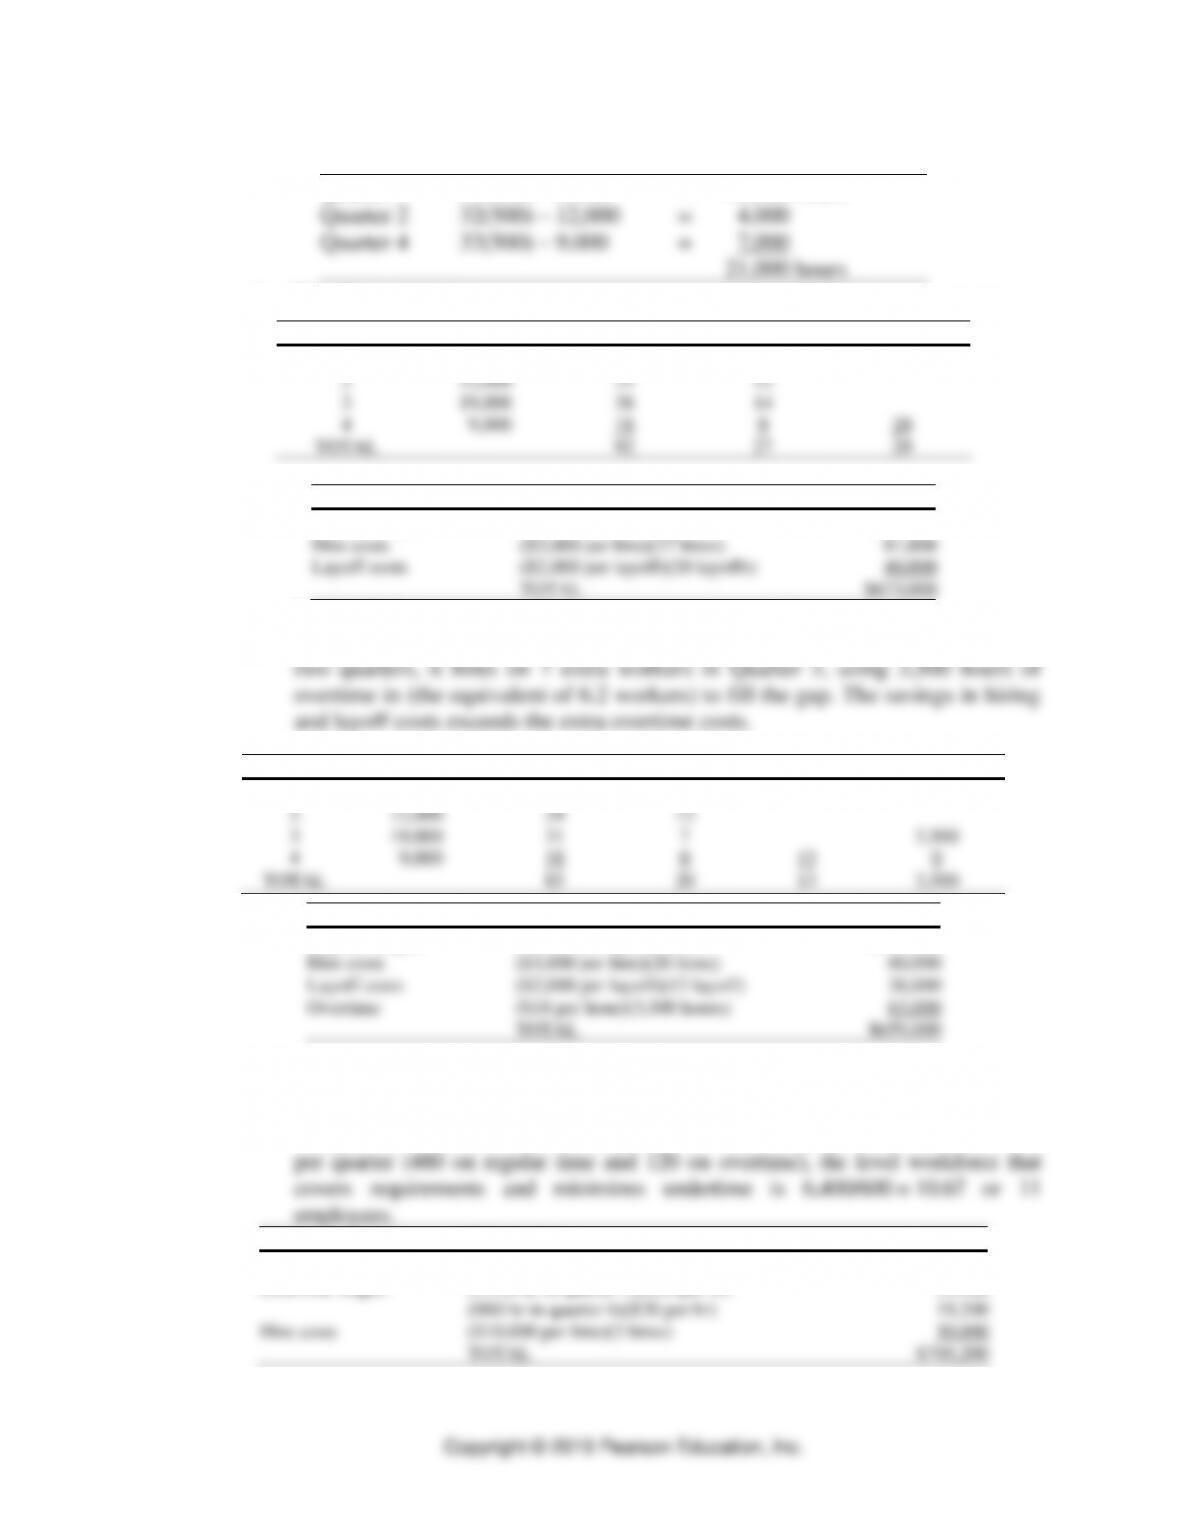
* The 11 workers can produce (11)(480) = 5,280 hours of regular time in any quarter. The 6,400–
hour requirement in quarter 2 exceeds this amount by 1,120 hours. The 6,240-hour requirement
in quarter 6 exceeds this amount by 960 hours.
The total undertime hours can be calculated as:
Quarter 1
11(480) – 4,200
1,080
hours
Quarter 3
11(480) – 3,000
2,280
Quarter 4
11(480) – 4,800
480
Quarter 5
11(480) – 4,400
880
Quarter 7
11(480) – 3,600
1,680
Quarter 8
11(480) – 4,800
480
6,880
hours
b. The chase strategy:
Quarter
Demand (hr)
Workforce
Hires
Layoffs
1
4,200
9
1
2
6,400
14
5
3
3,000
7
7
4
4,800
10
3
5
4,400
10
6
6,240
13
3
7
3,600
8
5
8
4,800
10
2
0
TOTAL
81
14
12
Cost
Calculation
Amount
Regular wages
($7,200 per quarter)(81)
$583,200
Hire costs
($10,000 per hire)(14 hires)
140,000
Layoff costs
($4,000 per layoff)(12 layoffs)
48,000
TOTAL
$771,200
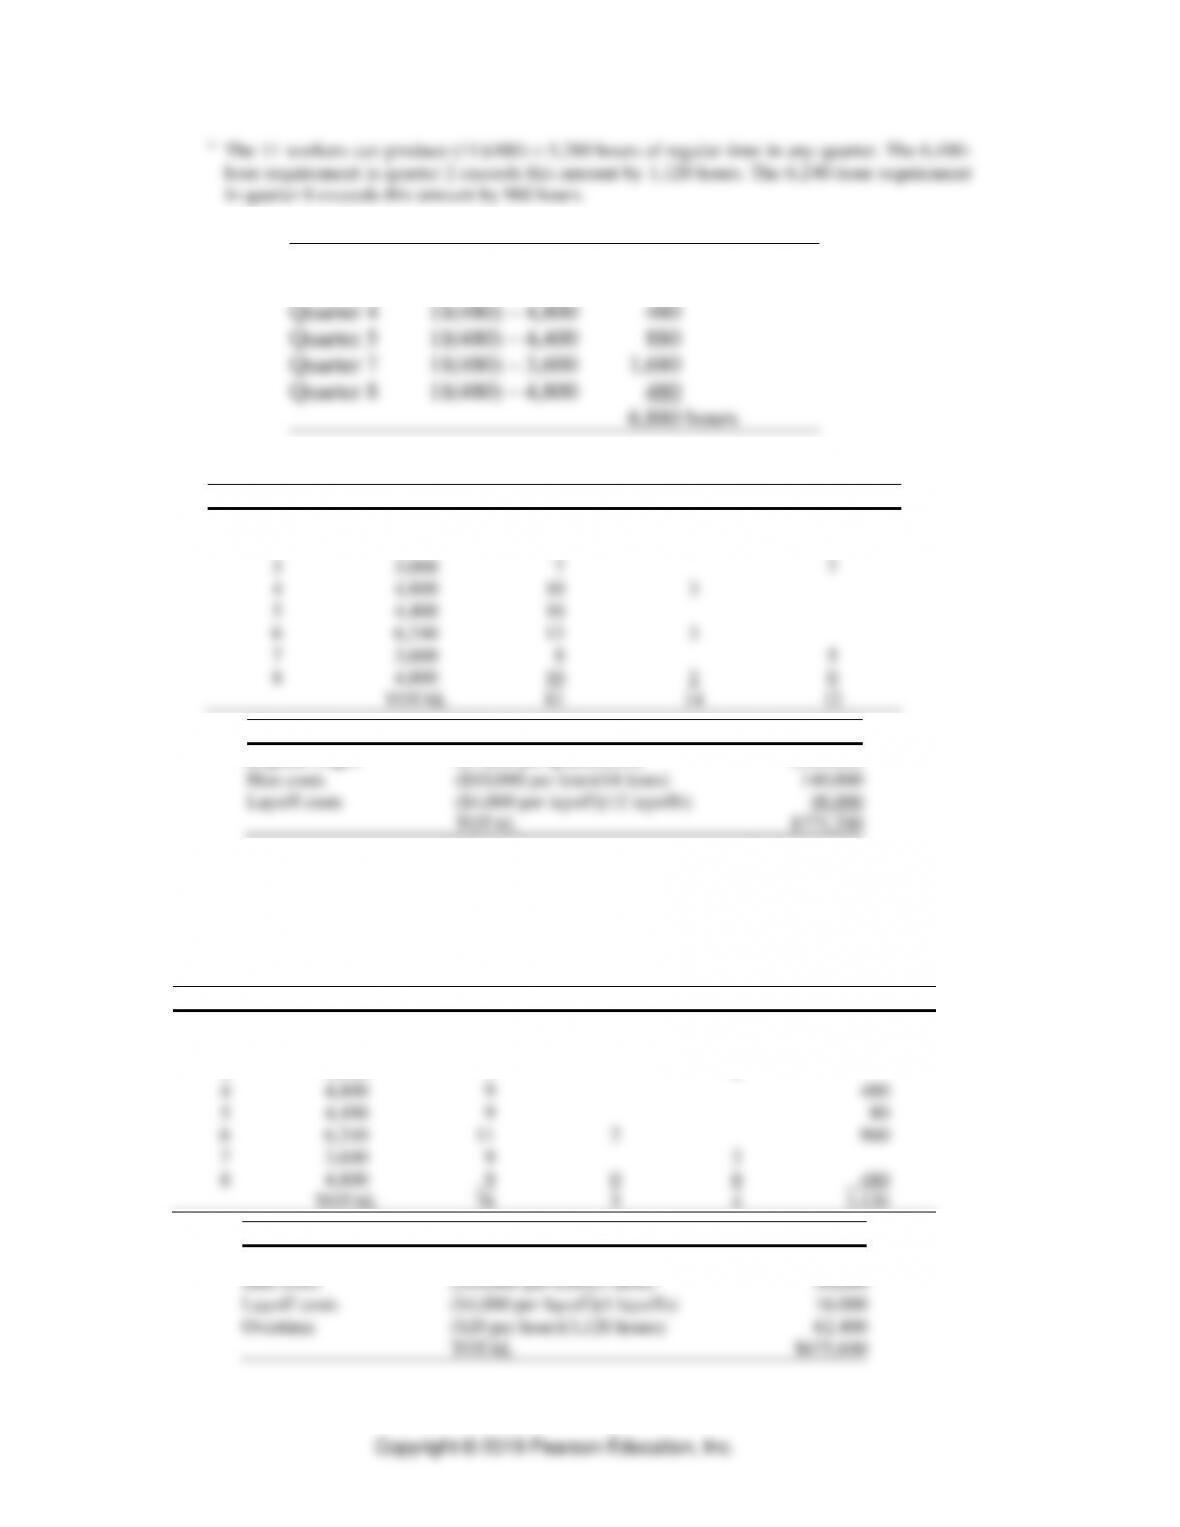
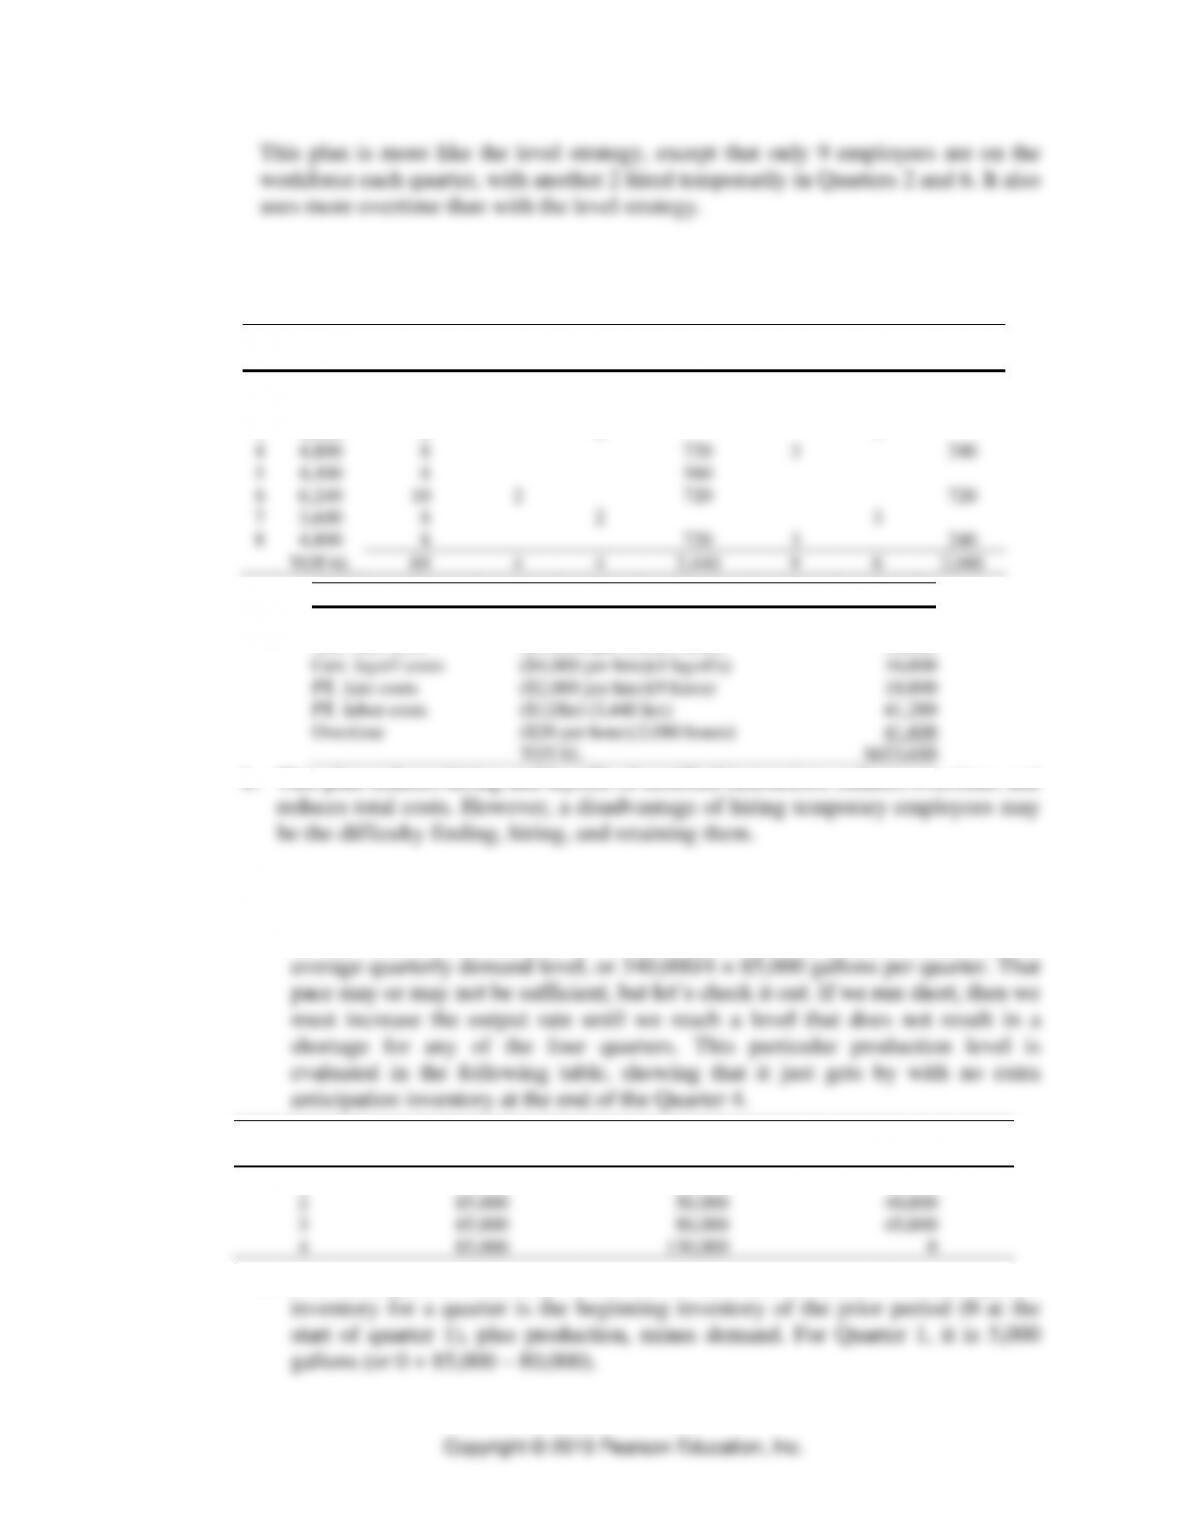
c. Proposed plan:
This plan begins with just 9 workers for Quarter 1, as with the chase strategy.
However, it increases temporarily the workforce to 11 employees in Quarters 2
and 6, making up the shortfall with overtime.
Quarter
Demand (hr)
Workforce
Hires
Layoffs
Overtime (hr)
1
4,200
9
1
2
6,400
11
2
1,120
3
3,000
9
2
4
4,800
9
480
5
4,400
9
80
6
6,240
11
2
960
7
3,600
9
2
8
4,800
9
0
0
480
TOTAL
76
5
4
3,120
Cost
Calculation
Amount
Regular wages
($7,200 per quarter)(76)
$547,200
Hire costs
($10,000 per hire)(5 hires)
50,000
Layoff costs
($4,000 per layoff)(4 layoffs)
16,000
Overtime
($20 per hour)(3,120 hours)
62,400
TOTAL
$675,600
Operations Planning and Scheduling ⚫ CHAPTER 10 ⚫
10-5
3. Bob Carlton’s Golf Camp with part-time instructors
a. One of many plans that take advantage of flexibility provided by part-time
instructors:
Demand
Certified
Cert
Cert
PT
PT
PT
Overtime
Qtr
(hr)
Workforce
Hires
Layoffs
Work Hours
Hires
Layoffs
(hr)
1
4,200
9
1
2
6,400
10
1
720
3
880
3
3,000
8
2
3
4
4,800
8
720
3
240
5
4,400
8
560
6
6,240
10
2
720
720
7
3,600
8
2
3
8
4,800
8
720
3
240
TOTAL
69
4
4
3,440
9
6
2,080
Cost
Calculation
Amount
Regular wages
($7,200 per quarter)(69)
$496,800
Cert. hire costs
($10,000 per hire)(4 hires)
40,000
Cert. layoff costs
($4,000 per hire)(4 layoffs)
16,000
PT. hire costs
($2,000 per hire)(9 hires)
18,000
PT. labor costs
($12/hr) (3,440 hrs)
41,280
Overtime
($20 per hour)(2,080 hours)
41,600
TOTAL
$653,680
b. This plan reduces hiring and layoffs of certified instructors, reduces overtime, and
4. Donald Fertilizer Company
a. For Parts (a) and (b), we need to find the level production rate that is high
enough to avoid any backorders or backlogs. A good place to start is with the
Production Rate
Demand (gallons)
Anticipation Inventory
Quarter
(gallons) in Quarter
in Quarter
(gallons) at Quarter’s End
1
85,000
80,000
5,000
2
85,000
50,000
40,000
3
85,000
80,000
45,000
4
85,000
130,000
0
b. The anticipation inventory is shown in the above table. The anticipation
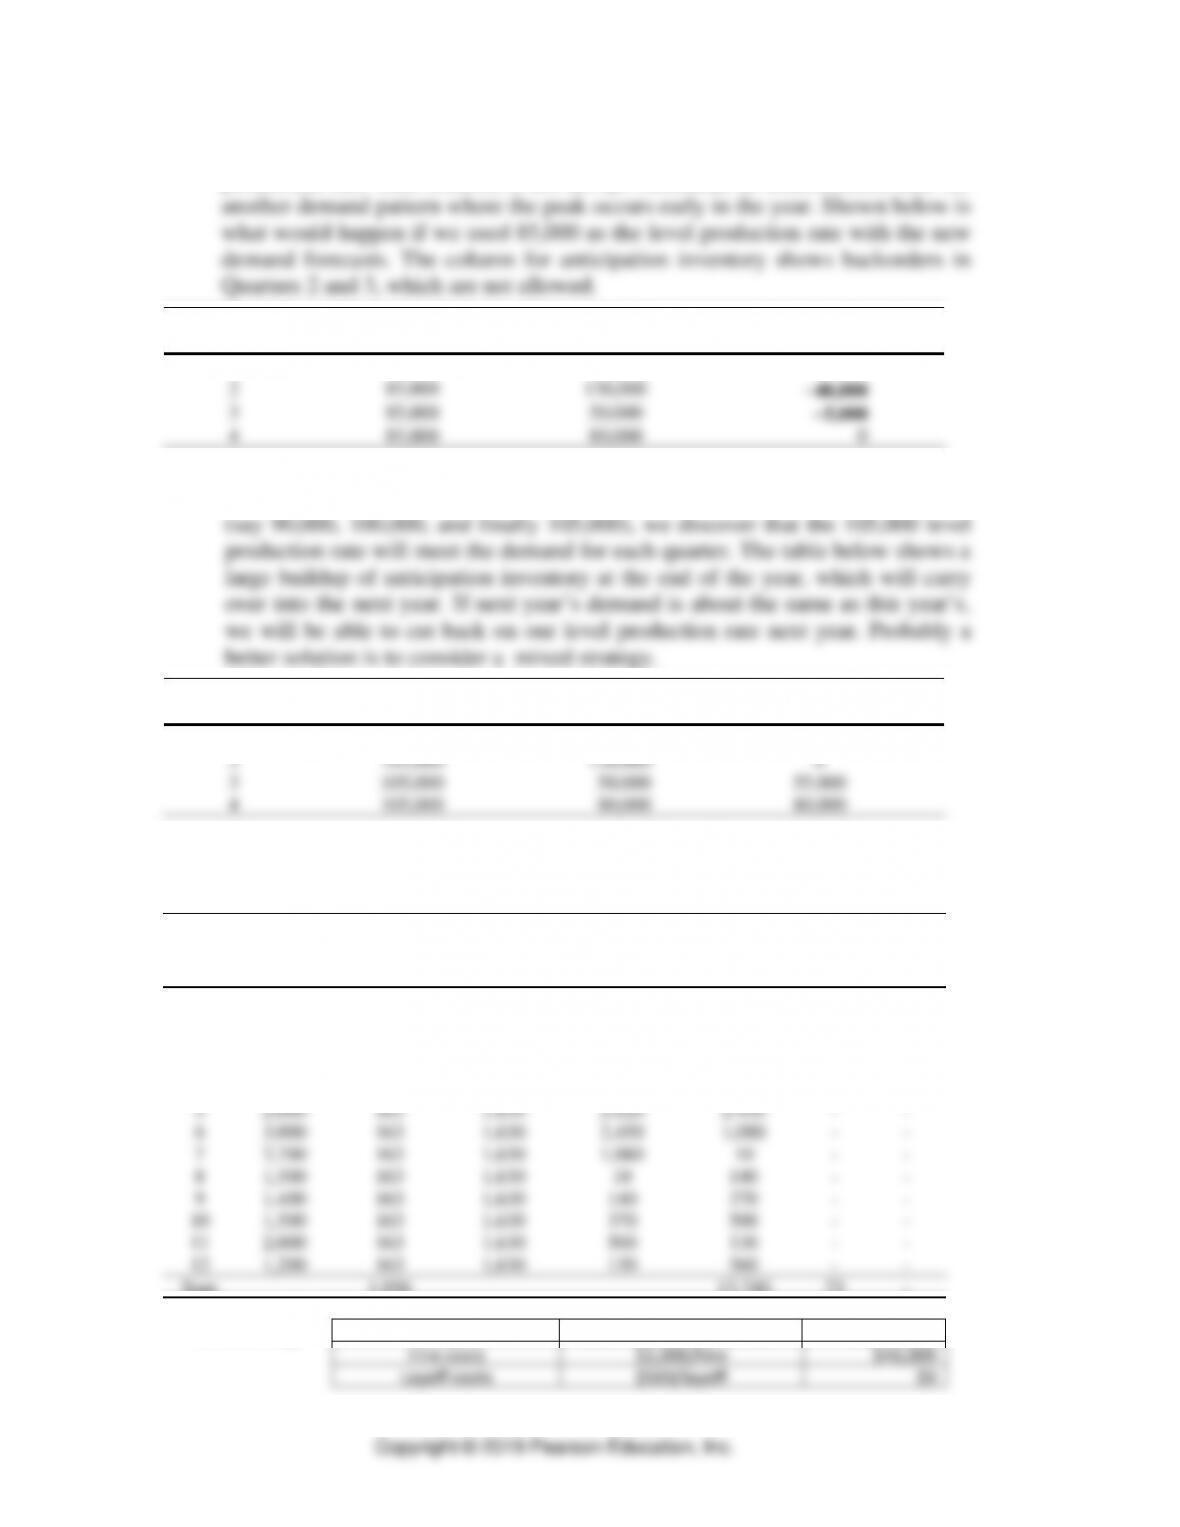
⚫ PART 2 ⚫ Managing Customer Demand
10-6
c. In part (a), the average demand rate fortunately can also be our average
production rate. That solution is not always sufficient, as demonstrated here for
Production Rate
Demand (gallons)
Anticipation Inventory
Quarter
(gallons) in Quarter
in Quarter
(gallons) at Quarter’s End
1
85,000
80,000
5,000
2
85,000
130,000
−40,000
3
85,000
50,000
−5,000
4
85,000
80,000
0
So we will have to set the production rate higher to meet demand, which has the
peak in Quarter 2. Using trial-and-error with increasingly larger production rates
Production Rate
Demand (gallons)
Anticipation Inventory
Quarter
(gallons) in Quarter
in Quarter
(gallons) at Quarter’s End
1
105,000
80,000
25,000
2
105,000
130,000
0
3
105,000
50,000
55,000
4
105,000
80,000
80,000
5. Kerby Corporation
a. Level Strategy Production Plan – using Excel Spreadsheet
Level Strategy
Month
Demand
Number of
Employees
Total
Production
Beginning
Inventory
Ending
Inventory
Hires
Layoffs
–
140
–
1
500
163
1,630
–
1,130
23
–
2
800
163
1,630
1,130
1,960
–
–
3
1,000
163
1,630
1,960
2,590
–
–
4
1,400
163
1,630
2,590
2,820
–
–
5
2,000
163
1,630
2,820
2,450
–
–
6
3,000
163
1,630
2,450
1,080
–
–
7
2,700
163
1,630
1,080
10
–
–
8
1,500
163
1,630
10
140
–
–
9
1,400
163
1,630
140
370
–
–
10
1,500
163
1,630
370
500
–
–
11
2,000
163
1,630
500
130
–
–
12
1,200
163
1,630
130
560
–
–
Sum
1,956
13,740
23
–
Level Strategy
Wages
$2,000/month/employee
$3,912,000
Hire costs
$2,000/hire
$46,000
Layoff costs
$500/layoff
$0
Operations Planning and Scheduling ⚫ CHAPTER 10 ⚫
10-7
Inventory costs
$32/unit/month
$439,680
Total Cost
$4,397,680
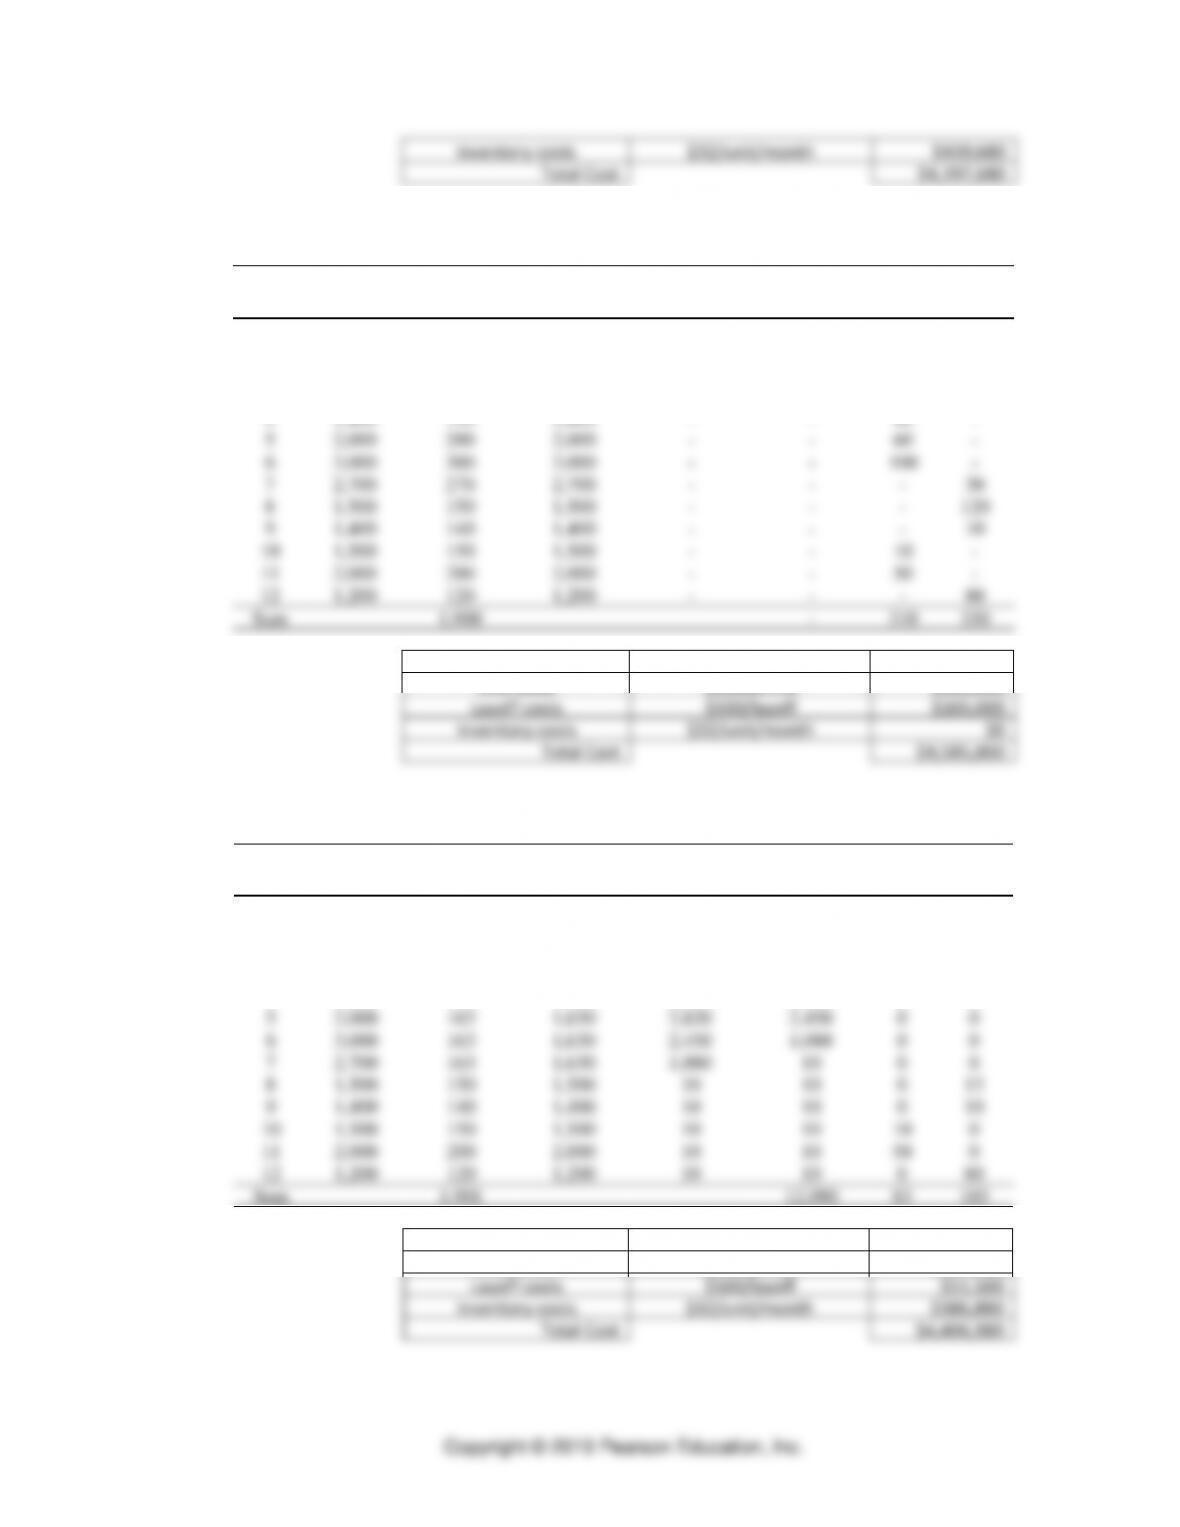
b. Chase Strategy Production Plan – using Excel Spreadsheet
Chase Strategy
Month
Demand
Number of
Employees
Total
Production
Beginning
Inventory
Ending
Inventory
Hires
Layoffs
–
140
–
1
500
50
500
–
–
–
90
2
800
80
800
–
–
30
–
3
1,000
100
1,000
–
–
20
–
4
1,400
140
1,400
–
–
40
–
5
2,000
200
2,000
–
–
60
–
6
3,000
300
3,000
–
–
100
–
7
2,700
270
2,700
–
–
–
30
8
1,500
150
1,500
–
–
–
120
9
1,400
140
1,400
–
–
–
10
10
1,500
150
1,500
–
–
10
–
11
2,000
200
2,000
–
–
50
–
12
1,200
120
1,200
–
–
–
80
Sum
1,900
–
310
330
Chase Strategy
Wages
$2,000/month/employee
$3,800,000
Hire costs
$2,000/hire
$620,000
Layoff costs
$500/layoff
$165,000
Inventory costs
$32/unit/month
$0
Total Cost
$4,585,000
c. Mixed Strategy Production Plan – using Excel Spreadsheet
Mixed Strategy
Month
Demand
Number of
Employees
Total
Production
Beginning
Inventory
Ending
Inventory
Hires
Layoffs
0
140
0
1
500
163
1,630
0
1,130
23
0
2
800
163
1,630
1,130
1,960
0
0
3
1,000
163
1,630
1,960
2,590
0
0
4
1,400
163
1,630
2,590
2,820
0
0
5
2,000
163
1,630
2,820
2,450
0
0
6
3,000
163
1,630
2,450
1,080
0
0
7
2,700
163
1,630
1,080
10
0
0
8
1,500
150
1,500
10
10
0
13
9
1,400
140
1,400
10
10
0
10
10
1,500
150
1,500
10
10
10
0
11
2,000
200
2,000
10
10
50
0
12
1,200
120
1,200
10
10
0
80
Sum
1,901
12,090
83
103
Mixed Strategy
Wages
$2,000/month/employee
$3,802,000
Hire costs
$2,000/hire
$166,000
Layoff costs
$500/layoff
$51,500
Inventory costs
$32/unit/month
$386,880
Total Cost
$4,406,380
⚫ PART 2 ⚫ Managing Customer Demand
10-8
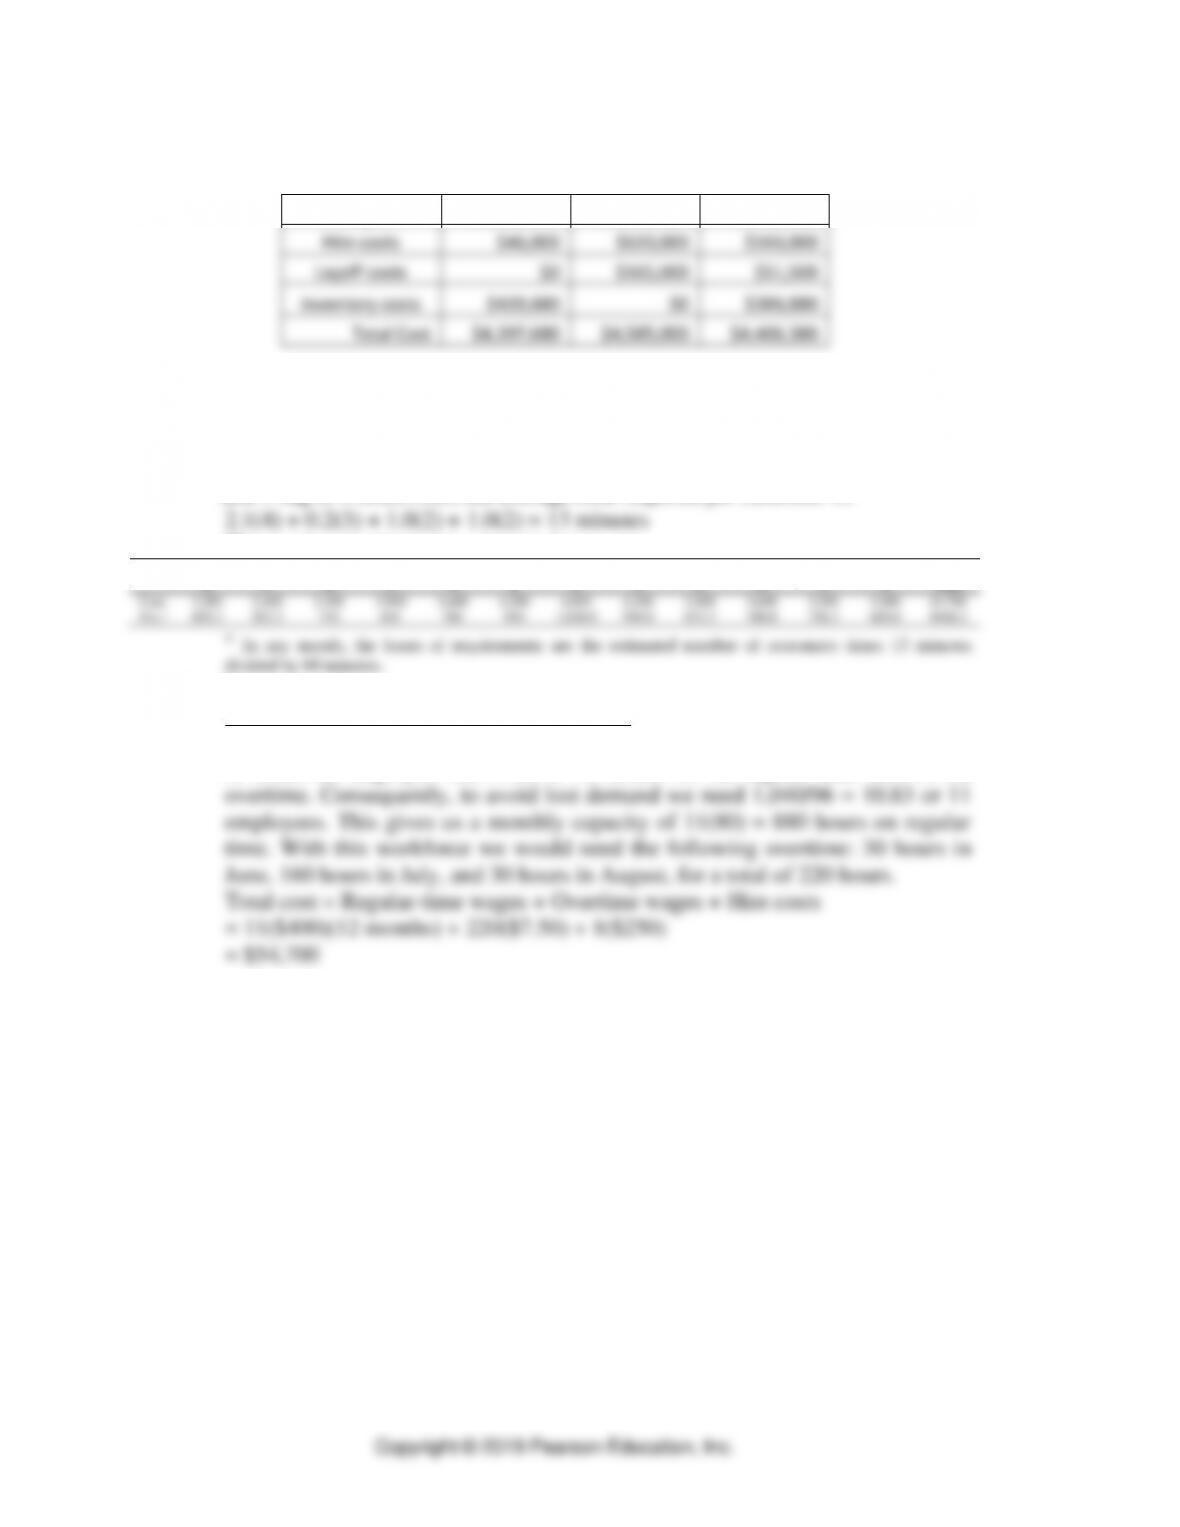
d. Cost Comparisons – Total cost is minimized by the Level Strategy
Level
Chase
Mixed
Wages
$3,912,000
$3,800,000
$3,802,000
Hire costs
$46,000
$620,000
$166,000
Layoff costs
$0
$165,000
$51,500
Inventory costs
$439,680
$0
$386,880
Total Cost
$4,397,680
$4,585,000
$4,406,380
6. Gretchen’s Kitchen
a. Each hamburger requires 4 minutes, each pint of chili requires 3 minutes, each
drink/shake requires 2 minutes, and each bag of French fries requires 2 minutes.
Because the average customer buys 2.1 hamburgers, 0.2 pint of chili, 1 drink,
and 1 bag of French fries, the average time required per customer is:
The service requirements, given in hours, are:
Month
J
F
M
A
M
J
J
A
S
O
N
D
Total
Cust.
3,200
2,600
3,300
3,900
3,600
4,200
4,800
4,200
3,800
3,600
3,500
3,000
43,700
Hrs.*
693.3
563.3
715
845
780
910
1,040.0
910.0
823.3
780.0
758.3
650.0
9468.2
* In any month, the hours of requirements are the estimated number of customers times 13 minutes
divided by 60 minutes.
b. Three strategies
Level strategy with overtime and undertime:
The maximum requirement in any month is 1,040 hours. The maximum number
of hours an employee can work is 96 hours: 80 on regular time and 16 on
Operations Planning and Scheduling ⚫ CHAPTER 10 ⚫
10-9
Modified chase strategy with a base workforce of 10:
With 10 employees the regular-time capacity is 800 hours per month. Hiring
and laying off to avoid overtime and undertime results in the following plan:
Month
J
F
M
A
M
J
J
A
S
O
N
D
Requirements
693.3
563.3
715.0
845.0
780.0
910.0
1,040.0
910.0
823.3
780.0
758.3
650.0
Workforce
10
10
10
11
10
12
13
12
11
10
10
10
Capacity
800
800
800
880
800
960
1,040
960
880
800
800
800
Hires
–
–
–
1
–
2
1
–
–
–
–
–
Layoffs
–
–
–
–
1
–
–
1
1
1
–
–
Total cost = Wages + Hire costs + Layoff costs
= (129 employee-months)($400) + 4($250) + 4($50)
= $52,800
Chase strategy:
With this plan, hiring and laying off is used to match the requirements without
the need for overtime.
Month
J
F
M
A
M
J
J
A
S
O
N
D
Requirements
693.3
563.3
715
845
780
910
1,040.0
910.0
823.3
780.0
758.3
650.0
Workforce
9
8
9
11
10
12
13
12
11
10
10
9
Capacity
720
640
720
880
800
960
1,040
960
880
800
800
720
Hires
—
—
1
2
—
2
1
—
—
—
—
—
Layoffs
1
1
—
—
1
—
—
1
1
1
—
1
Total cost = Wages + Hire costs + Layoff costs
= (124 employee-months)($400) + 6(250) + 7($50)
= $51,450
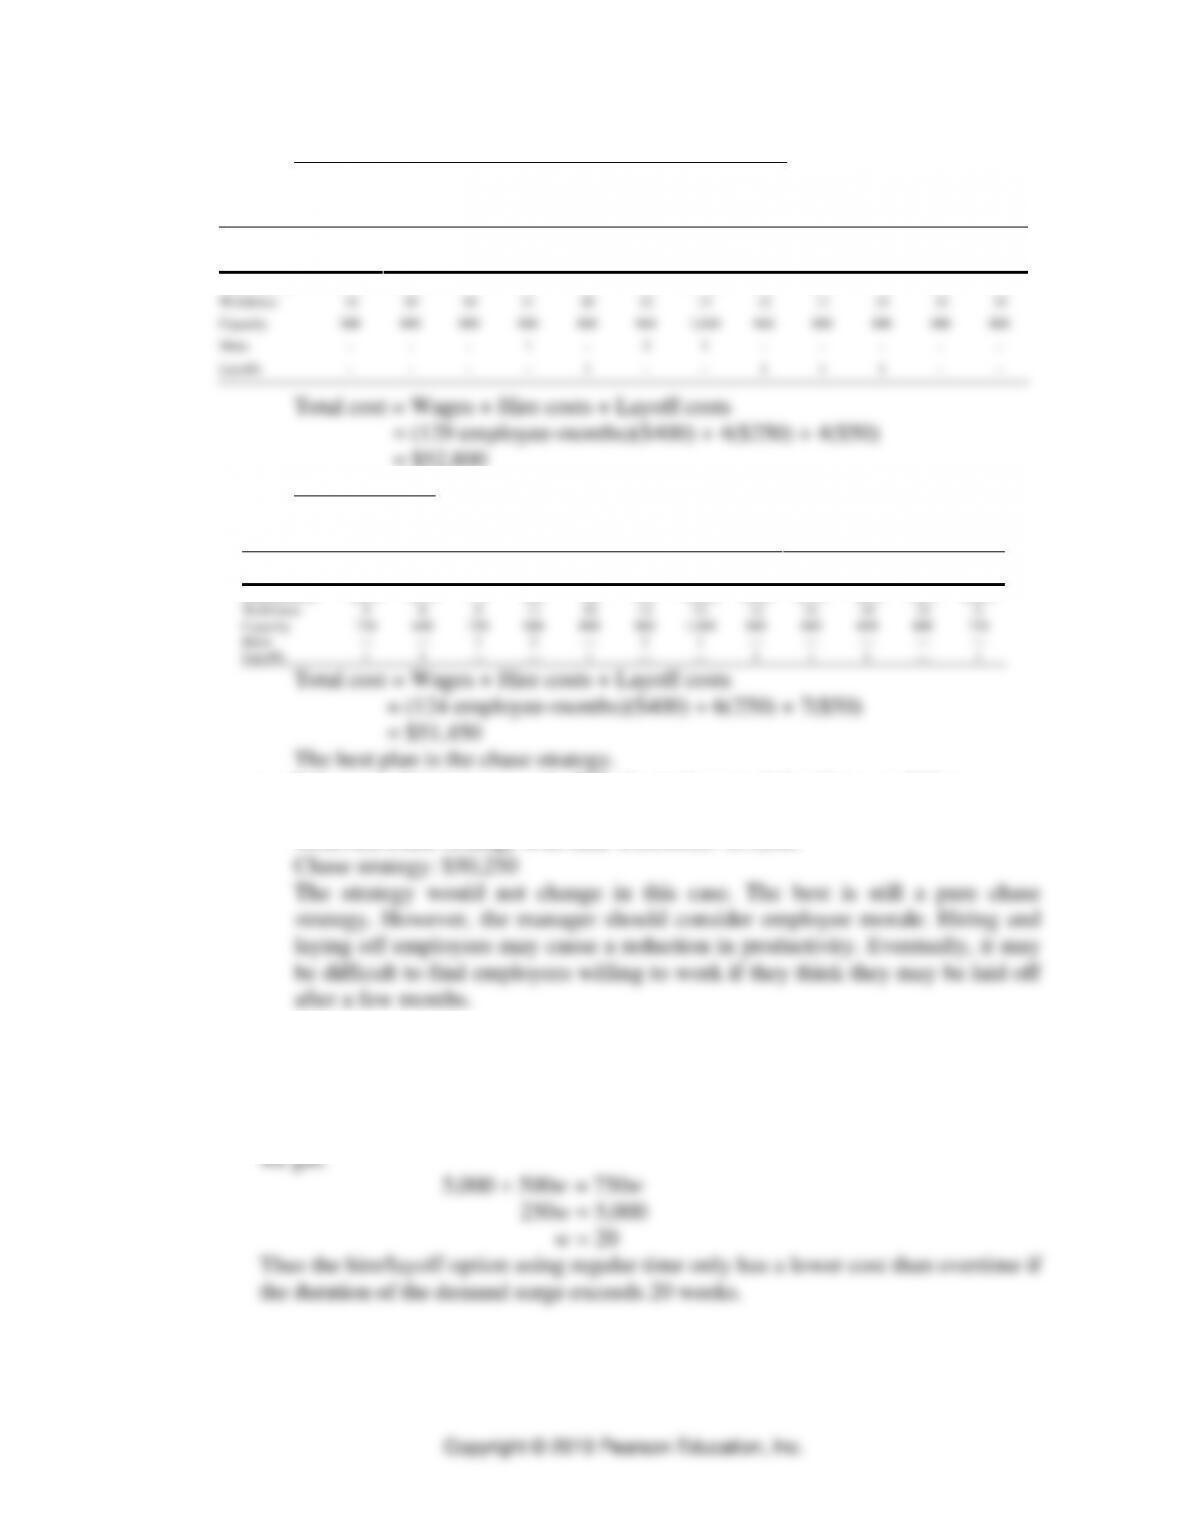
The best plan is the chase strategy.
c. If the cost of hiring were only $50, the total costs of the plans would be:
Level strategy: $54,500
Modified chase strategy with base workforce: $52,000
7. Breakeven Analysis
The fixed cost for the regular time only is the sum of the hire and layoff costs,
whereas the fixed cost of the overtime option is $0. Setting the total cost of the
regular time only option to the total cost of the overtime option, and solving for w,
Spreadsheets for Sales and Operations Planning
⚫ PART 2 ⚫ Managing Customer Demand
10–10
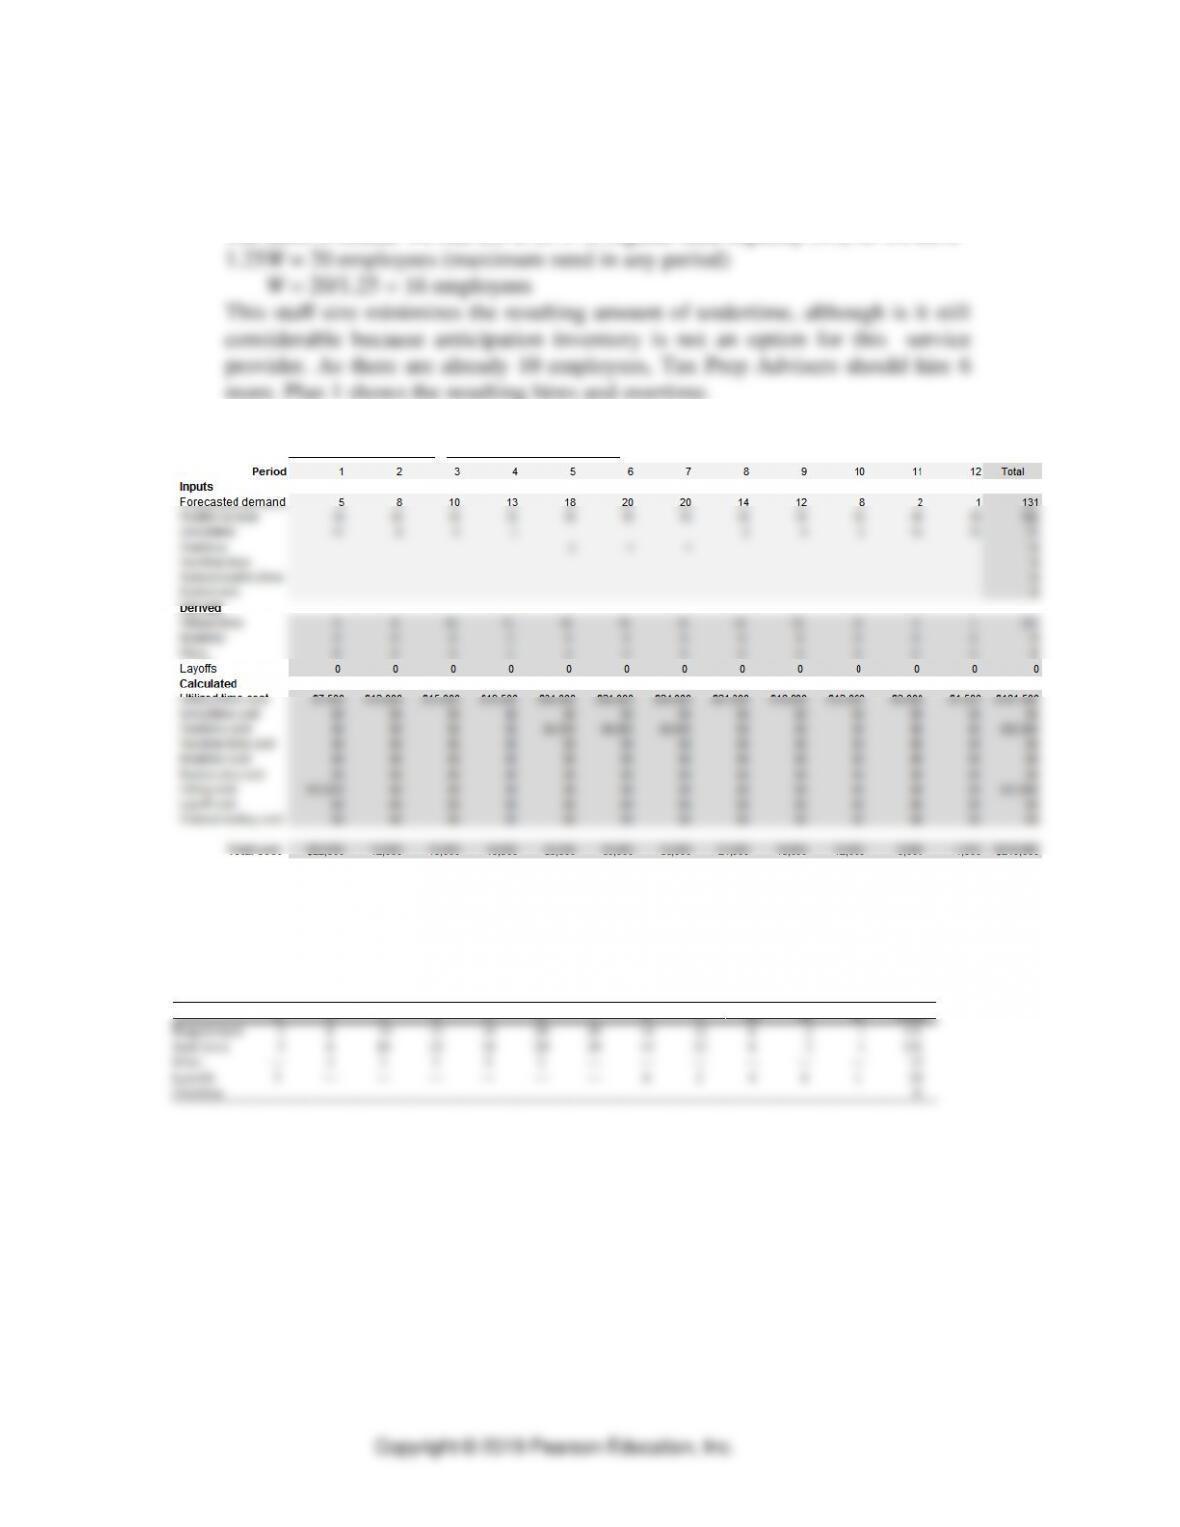
8. Tax Prep Advisers Inc.
a. Level strategy
The most overtime we can use is 25% of regular-time capacity (W), so we have
more. Plan 1 shows the resulting hires and overtime.
Plan 1: Level Strategy
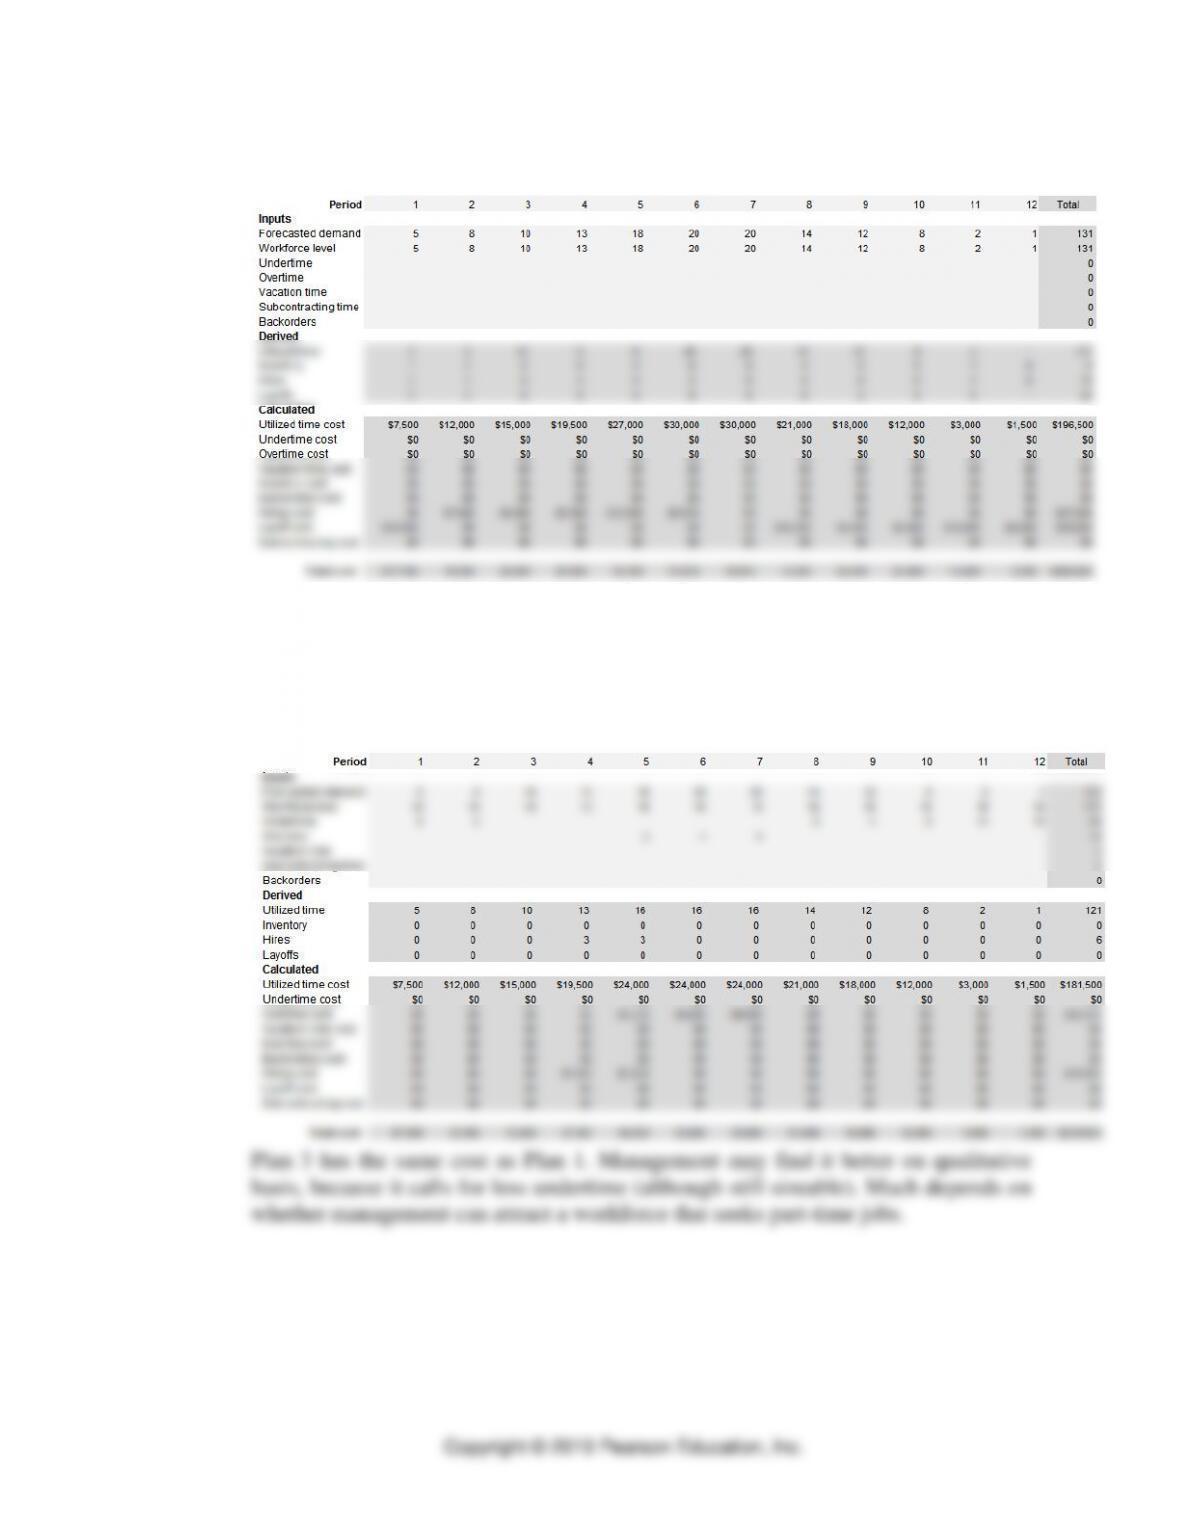
b. Chase strategy
This strategy simply involves adjusting the workforce as needed to meet
demand. Plan 2 shows the effect of changing the staff level with hires and
layoffs.
1
2
3
4
5
6
7
8
9
10
11
12
Total
Requirement
5
8
10
13
18
20
20
14
12
8
2
1
131
Staff level
5
8
10
13
18
20
20
14
12
8
2
1
131
Hires
—
3
2
3
5
2
—
—
—
—
—
—
15
Layoffs
5
—
—
—
—
—
—
6
2
4
6
1
24
Overtime
—
—
—
—
—
—
—
—
—
—
—
—
0
Operations Planning and Scheduling ⚫ CHAPTER 10 ⚫
10–11
Output from OM Explorer confirms these calculations:
c. Mixed Strategy: The Level strategy had a lower cost (because undertime has no
cost) than the chase strategy (because of the frequent hiring and layoff costs). In
addition, anticipation inventory is not allowed. These observations suggest a
strategy of chasing the increasing demand until the peak is reached (rather than
hiring them all in period 1), and then keep the workforce level at that level for the
rest of the year. The plan is shown below.
⚫ PART 2 ⚫ Managing Customer Demand
10–12
d. Cost comparisons for the staffing plans
Cost
Plan 1: Level Strategy
Plan 2: Chase Strategy
Plan 3: Mixed Strategy
Utilized RT @ $1500
121 wrk-mo. = $181,500
131 worker-mo. = $196,500
121 worker-mo. = $181,500
OT @ $2,250
10 worker-mo. = $ 22,500
0 worker-mo. = $ 0
10 worker-mo. = $ 22,500
Hire @ $2,500
6 workers = $ 15,000
15 workers = $ 37,500
6 workers = $ 15,000
Layoff @ $2,000
0 workers = $ 0
24 workers = $ 48,000
0 workers = $ 0
Total $219,000
$282,000
$219,000
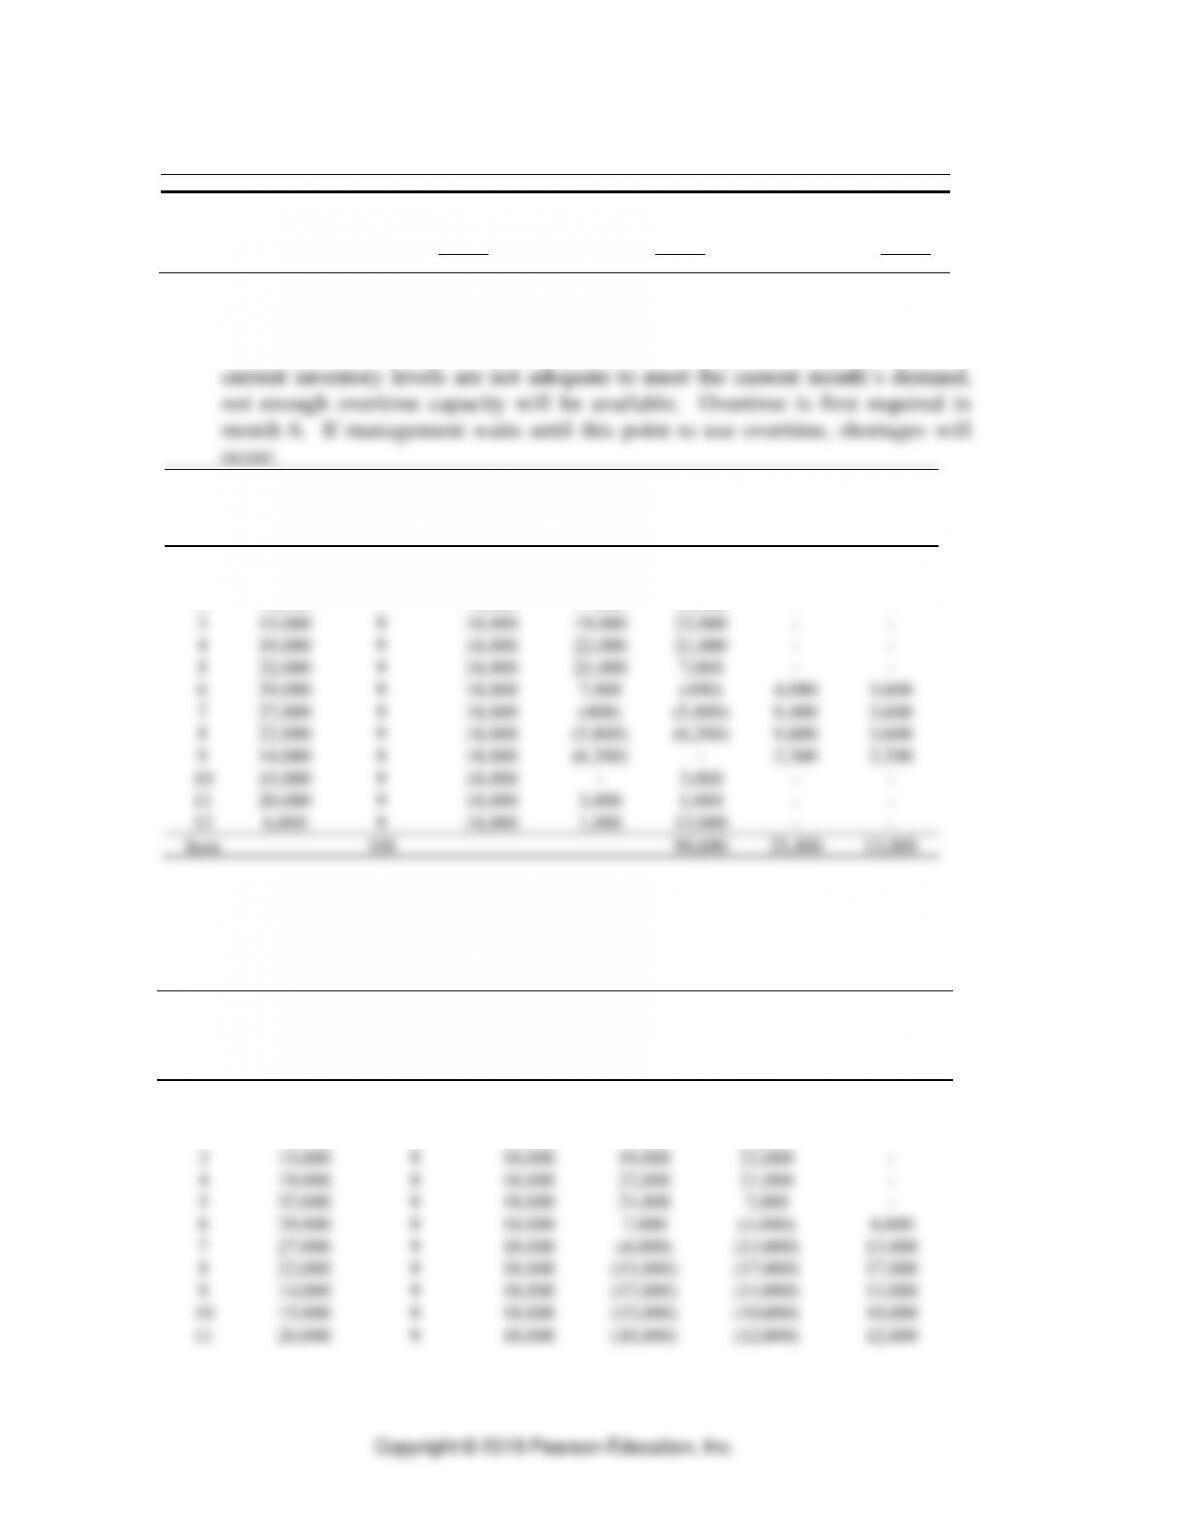
9. Climate Control Inc.
a. If overtime is authorized only in months in which regular time production and
Month
Demand
Number of
Employees
Regular
Production
Capacity
Beginning
Inventory
Ending
Inventory
Overtime
Required
Overtime
Available
–
9
24,000
1
25,000
9
18,000
24,000
17,000
–
–
2
16,000
9
18,000
17,000
19,000
–
–
3
15,000
9
18,000
19,000
22,000
–
–
4
19,000
9
18,000
22,000
21,000
–
–
5
32,000
9
18,000
21,000
7,000
–
–
6
29,000
9
18,000
7,000
(400)
4,000
3,600
7
27,000
9
18,000
(400)
(5,800)
9,400
3,600
8
22,000
9
18,000
(5,800)
(6,200)
9,800
3,600
9
14,000
9
18,000
(6,200)
–
2,200
2,200
10
15,000
9
18,000
–
3,000
–
–
11
20,000
9
18,000
3,000
1,000
–
–
12
6,000
9
18,000
1,000
13,000
–
–
Sum
108
90,600
25,400
13,000
b. The ability to backorder up to 5,000 suits from month to month instead of using
overtime is also an inadequate strategy. In month 6, backorders of 4000 units
must be backordered. Starting in month 7 and beyond, well over the 5,000 unit
limit would have to be backordered each month to keep up with demand.
Month
Demand
Number of
Employees
Regular
Production
Capacity
Beginning
Inventory
Ending
Inventory
Units of
Backorders
Required
–
9
24,000
1
25,000
9
18,000
24,000
17,000
–
2
16,000
9
18,000
17,000
19,000
–
3
15,000
9
18,000
19,000
22,000
–
4
19,000
9
18,000
22,000
21,000
–
5
32,000
9
18,000
21,000
7,000
–
6
29,000
9
18,000
7,000
(4,000)
4,000
7
27,000
9
18,000
(4,000)
(13,000)
13,000
8
22,000
9
18,000
(13,000)
(17,000)
17,000
9
14,000
9
18,000
(17,000)
(13,000)
13,000
10
15,000
9
18,000
(13,000)
(10,000)
10,000
11
20,000
9
18,000
(10,000)
(12,000)
12,000
Operations Planning and Scheduling ⚫ CHAPTER 10 ⚫
10–13
c. The preemptive use of overtime in months 1-4 will adequately address the
shortage issue as long as a small amount of overtime is authorized in month 8.
Month
Demand
Number of
Employees
Regular
Production
Capacity
Beginning
Inventory
Ending
Inventory
Overtime
Required
Overtime
Used
–
9
24,000
1
25,000
9
18,000
24,000
20,600
3,600
3,600
2
16,000
9
18,000
20,600
26,200
3,600
3,600
3
15,000
9
18,000
26,200
32,800
3,600
3,600
4
19,000
9
18,000
32,800
35,400
3,600
3,600
5
32,000
9
18,000
35,400
21,400
–
–
6
29,000
9
18,000
21,400
10,400
–
–
7
27,000
9
18,000
10,400
1,400
–
–
8
22,000
9
18,000
1,400
–
2,600
2,600
9
14,000
9
18,000
–
4,000
–
–
10
15,000
9
18,000
4,000
7,000
–
–
11
20,000
9
18,000
7,000
5,000
–
–
12
6,000
9
18,000
5,000
17,000
–
–
Sum
108
181,200
2,600
17,000
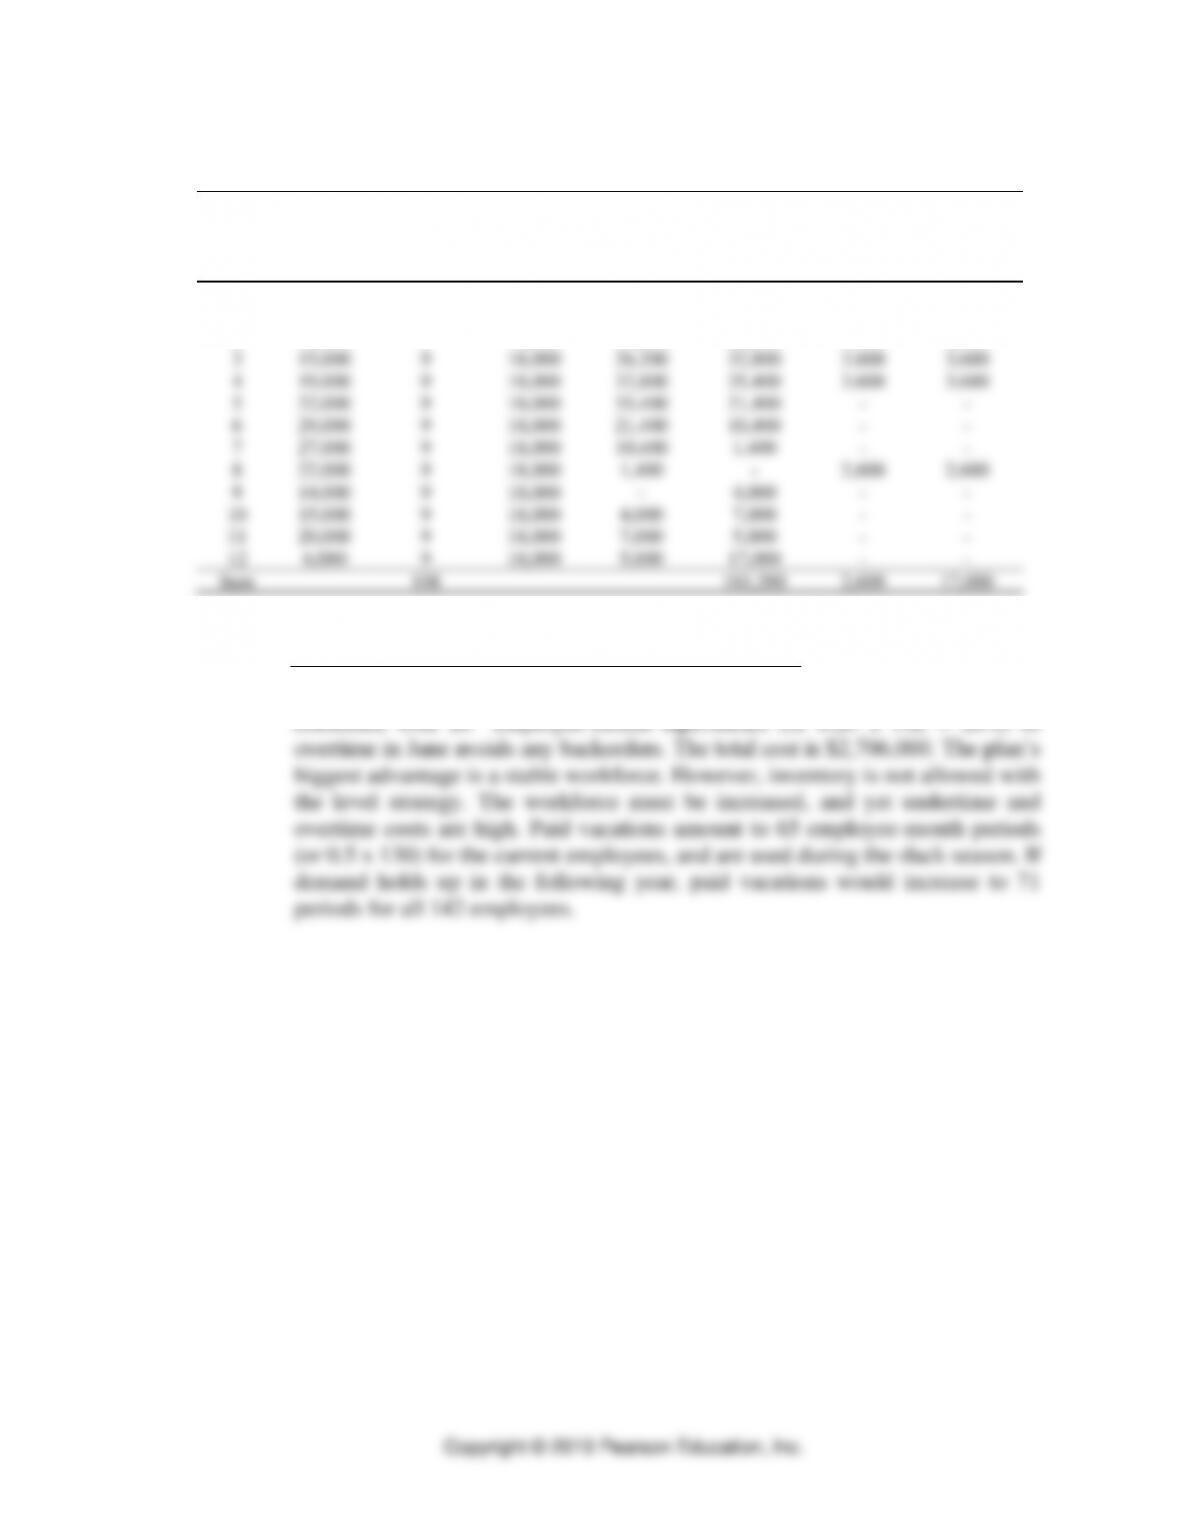
10. King Kool Company
a. Level strategy with overtime, undertime, and vacations:.
The following plan calls for a level workforce of 142 employees, because when

⚫ PART 2 ⚫ Managing Customer Demand
10–14
Operations Planning and Scheduling ⚫ CHAPTER 10 ⚫
10–15
b. Chase strategy with vacations:
The following plan costs less at $2,285,000. However, the workforce fluctuates
widely, which creates a considerable amount of hiring and layoffs. Students

⚫ PART 2 ⚫ Managing Customer Demand
10–16
Operations Planning and Scheduling ⚫ CHAPTER 10 ⚫
10–17
c. Mixed strategy with inventory, overtime, backorders and vacations:
The cost of the following plan costs drops to $2,239,000. The workforce is

⚫ PART 2 ⚫ Managing Customer Demand
10–18
Operations Planning and Scheduling ⚫ CHAPTER 10 ⚫
10–19
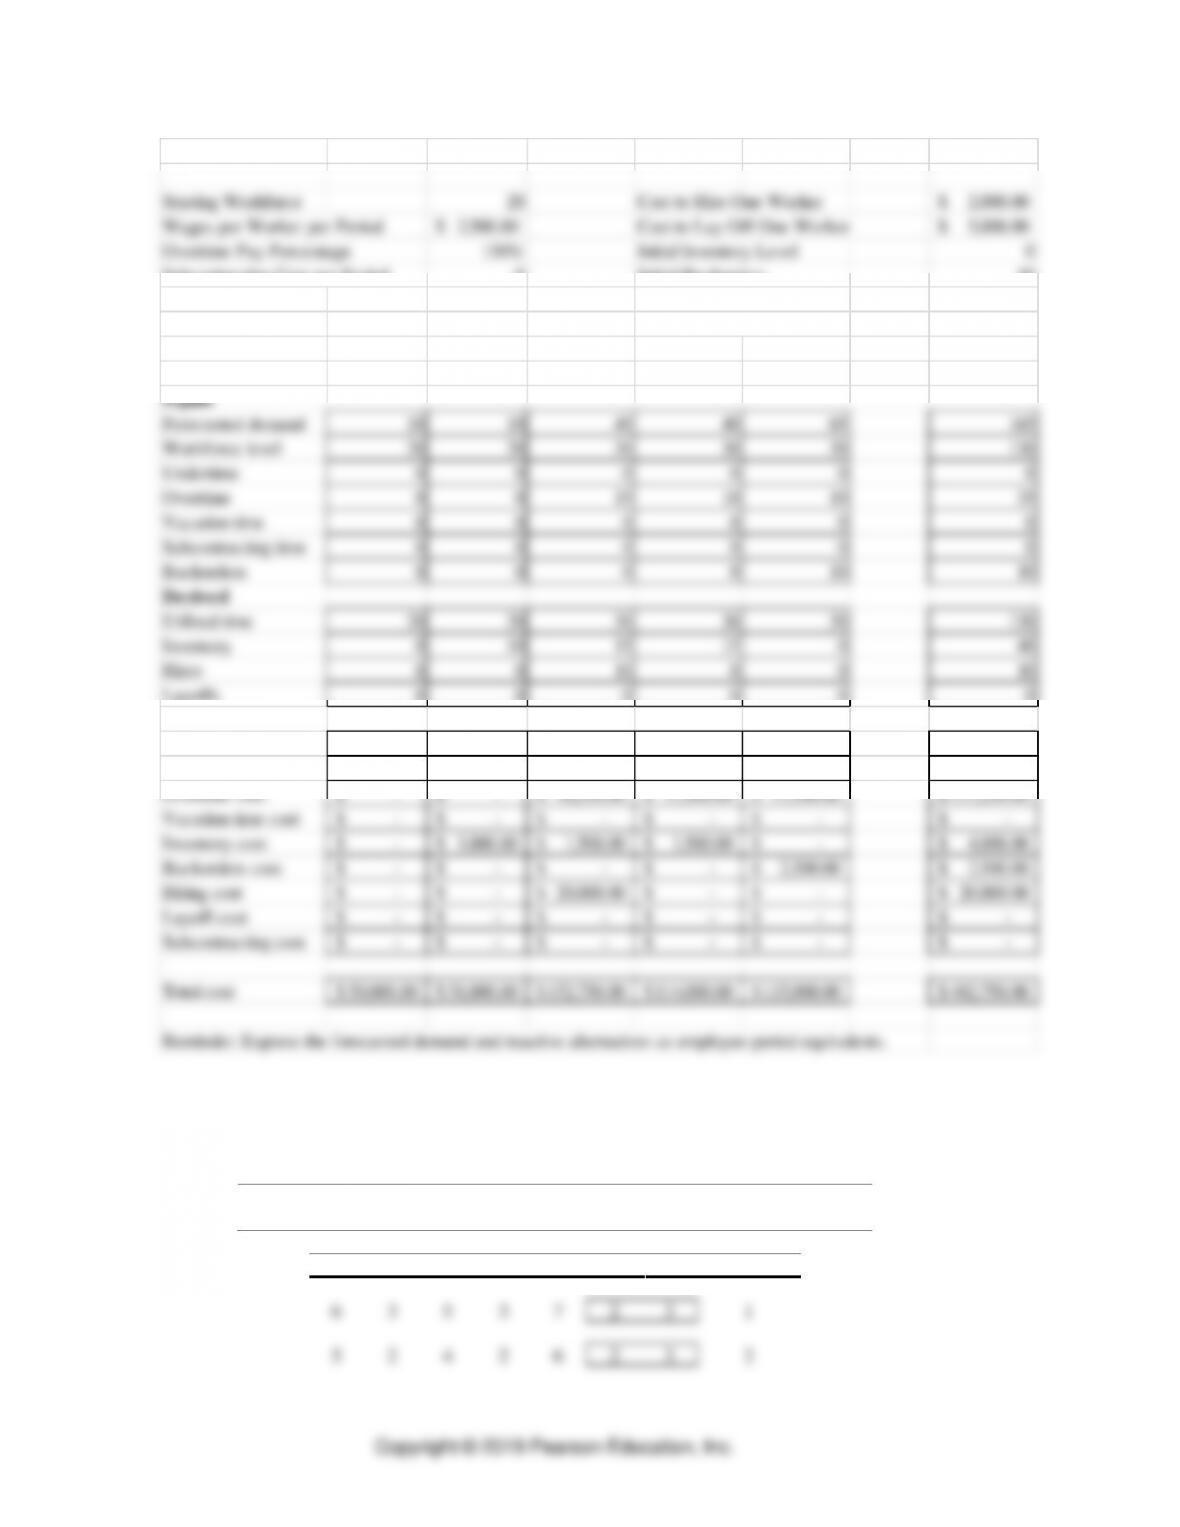
11. Classico Inc.
Output from Sales and Operations Planning with Spreadsheets solver in OM Explorer
show the derived inputs: Utilized time, Inventory, Hires and Layoffs; and the associated
costs.
Inputs
Starting Workforce 20 Cost to Hire One Worker 10,000.00$
Wages per Worker per Period 4,000.00$ Cost to Lay Off One Worker 20,000.00$
Overtime Pay Percentage 150% Initial Inventory Level 10
Subcontracting Cost per Period 0 Initial Backorders 0
Inventory Cost 100.00$
Backorder Cost 250.00$
Period January February March April May Total
Inputs
Forecasted demand 20 30 40 30 20 140
Workforce level 20 20 20 20 20 100
Undertime 0 0 0 0 0 0
Overtime 0 0 10 20 030
Vacation time 0 0 0 0 0 0
Derived
Utilized time 20 20 20 20 20 100
Inventory 10 0 0 0 0 10
Hires 0 0 0 0 0 0
Layoffs 0 0 0 0 0 0
Calculated
Layoff cost –$ –$ –$ –$ –$ –$
Subcontracting cost –$ –$ –$ –$ –$ –$
Total cost 81,000.00$ 80,000.00$ 142,500.00$ 200,000.00$ 80,000.00$ 583,500.00$
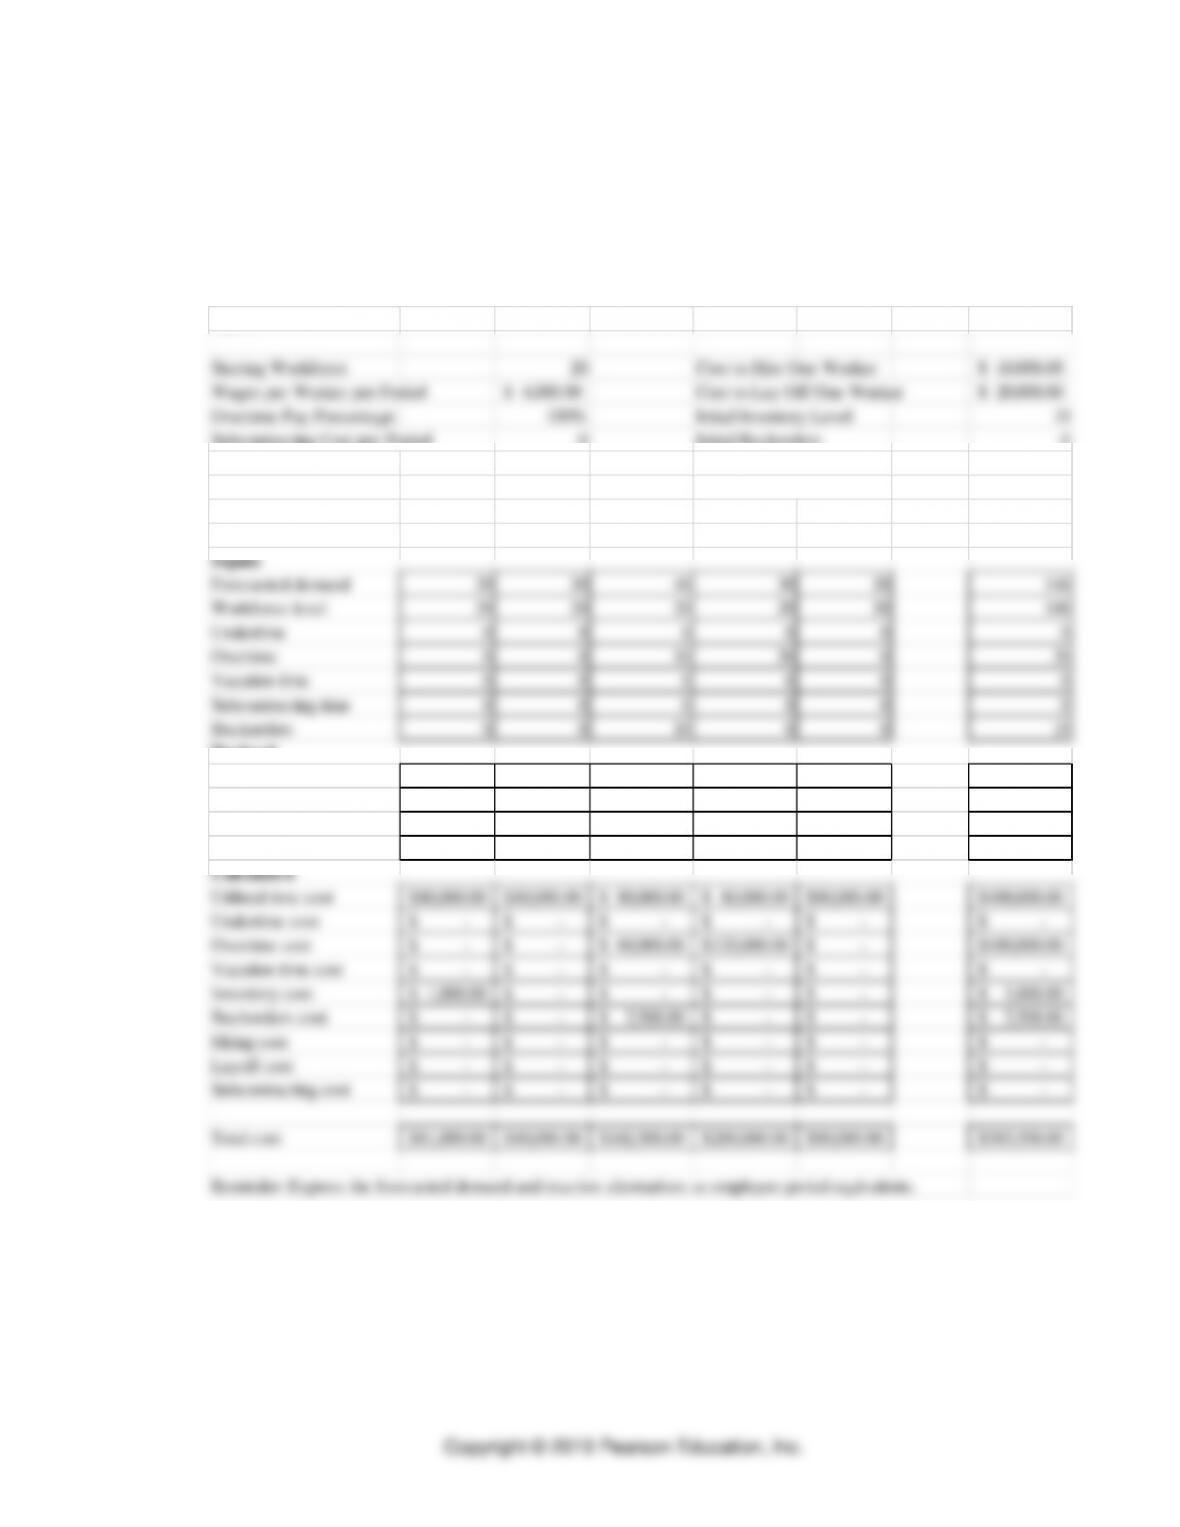
Reminder: Express the forecasted demand and reactive alternatives as employee-period equivalents.
12. Gemini Inc.
Output from Sales and Operations Planning with Spreadsheets solver in OM Explorer
show the model’s inputs given derived inputs: Utilized time, Inventory, Hires and
Layoffs; and the associated costs.
⚫ PART 2 ⚫ Managing Customer Demand
10–20
Inputs
Starting Workforce 20 Cost to Hire One Worker 2,000.00$
Wages per Worker per Period 2,500.00$ Cost to Lay Off One Worker 5,000.00$
Overtime Pay Percentage 150% Initial Inventory Level 0
Subcontracting Cost per Period 0 Initial Backorders 10
Inventory Cost 100.00$
Backorder Cost 250.00$
Period January February March April May Total
Inputs
Forecasted demand 10 10 40 40 65 165
Workforce level 20 20 30 30 30 130
Undertime 0 0 0 0 0 0
Overtime 0 0 15 10 10 35
Vacation time 0 0 0 0 0 0
Subcontracting time 0 0 0 0 0 0
Backorders 0 0 0 0 10 10
Derived
Utilized time 20 20 30 30 30 130
Inventory 0 10 15 15 040
Utilized time cost 50,000.00$ 50,000.00$ 75,000.00$ 75,000.00$ 75,000.00$ 325,000.00$
Undertime cost –$ –$ –$ –$ –$ –$
Overtime cost –$ –$ 56,250.00$ 37,500.00$ 37,500.00$ 131,250.00$
Vacation time cost –$ –$ –$ –$ –$ –$
Inventory cost –$ 1,000.00$ 1,500.00$ 1,500.00$ –$ 4,000.00$
13. Michaels Distribution Center
Day
M
T
W
Th
F
S
Su
Requirements
6
3
5
3
7
2
3
M
T
W
Th
F
S
Su
Employee
6
3
5
3
7
2
3
1
5
2
4
2
6
2
3
2