Banking of emissions allowances – does the volume matter?
March 2012
Page 10
5. Implications for time and scale of policy interventions
Various policy interventions are discussed, so as to strengthen the EU ETS. These policy interventions
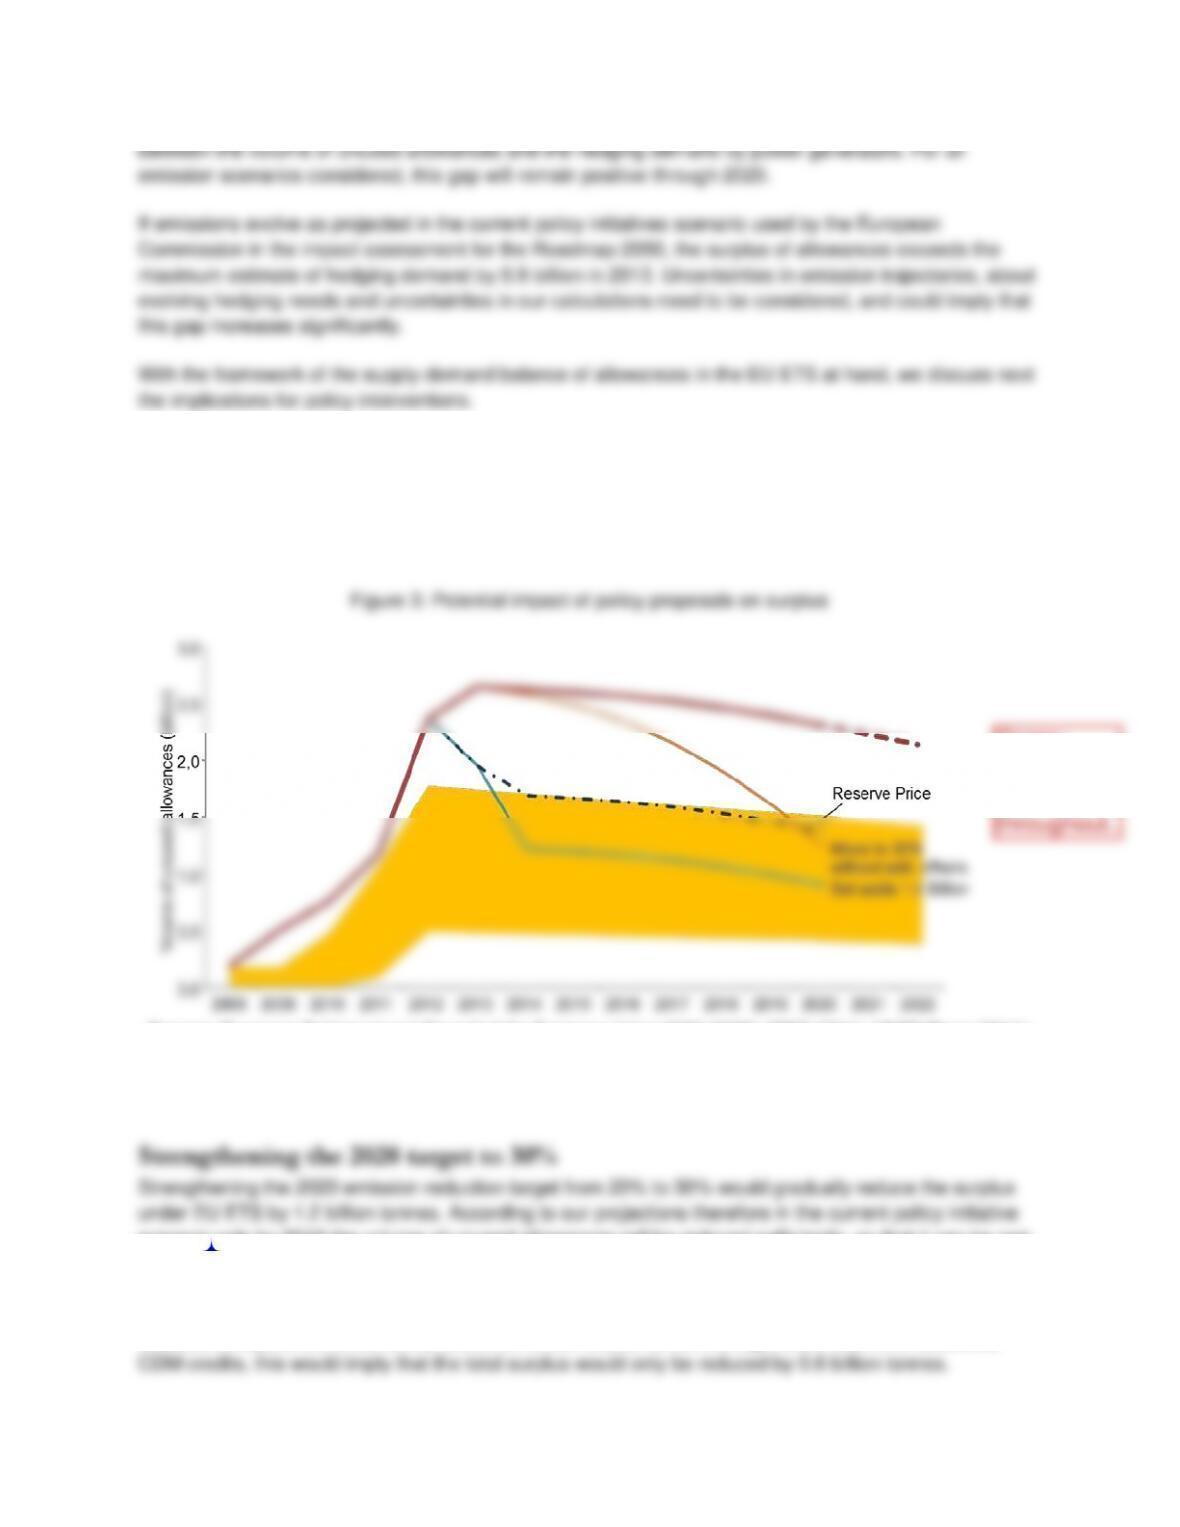
differ in their potential impact on surplus and carbon price expectation (Figure 3).
Sources: European Parliament and Council of the European Union 2009 (2009); IGES (2011); UNEP Risoe (2011);
CITL (2011); European Commission (2011); 2010 Annual Reports of 9 European utilities (E-on 2010; EDF 2010;
EnBW 2010; ENEL 2010; GDF Suez 2010; Iberdrola 2010; RWE 2010; Statkraft 2010; Vattenfall 2010);
Eurelectric (2009); Eurostat (2011); Point Carbon (2011); IPCC (2006).
scenario only by 2019 the volume of unused allowances will be reduced sufficiently, so that it can be met
by the demand of hedging buyers.
The EU ETS Directive envisaged that in the case of such a move, half of the additional emission
reductions requirements can be satisfied with offset credits. Given the significant volume of additional

Banking of emissions allowances – does the volume matter?
March 2012
Page 11
Strengthening of the 2020 target alone will not remove the need for speculative investment in allowances,
and therefore imply continued high discounting. To the extent that the tighter target will result in higher
expectations for 2020 prices, these will be translated to today’s prices, but at a high discount rate.
Set–side allowances
What level of scarcity of EU allowances is expected post–2020? In other words, is the current
trajectory of the EU ETS cap declining at 1.74% per year compatible with the de–carbonization
Reserve price in allowance auctions
In Phase III, about half of EU allowances will be auctioned. A reserve price for such auctions could reduce
supply until the cumulative surplus matches hedging demand. Due to the lower discounts applied in
If the reserve price in the allowance auction reduces the cumulative surplus so that it matches the upper
end of the hedging corridor, then Figure 3 illustrates that the cumulative surplus will in subsequent years
Often reserve prices are discussed with an alternative objective – not to prescribe a carbon price
trajectory but to avoid the risk of very low carbon prices. Thus, a reserve price could complement a set–
2030 target and trajectory
The EU ETS Directive outlines a linear reduction factor of the emissions cap by 1.74% per annum to be
continued beyond 2020. Strengthening this target would increase the long–term carbon price expectations

Banking of emissions allowances – does the volume matter?
March 2012
Page 12
6. Conclusion
We have quantified how the supply of unused allowances under EU ETS is evolving over time. Despite
the surplus, a positive carbon price remained. Therefore we explore who is banking the allowances for
future use. We interviewed market participants to understand their objectives, strategies and constraints
Our results differ from previous analysis of emission trading schemes which typically assumed that
The limit to the scale of banking available at low discount rates was not considered in the discussion on
setting EU ETS caps during Phase II and Phase III. To the contrary, there was a strong emphasis on the
value of unlimited banking, reflecting the experience from Phase I of EU ETS, when a regulatory
Our analysis implies, that for emission trading schemes the emission cap has to be formulated carefully,
so as to avoid the accumulation of very large surpluses. The analysis also suggests that an intervention to
The analysis did not assess the emissions cap post 2020 and how it impacts on expectations about future
Ultimately the confidence of market participants in EU ETS will be based on their assessment of the
consistency of potential short–term policy interventions and the long–term policy framework.
Banking of emissions allowances – does the volume matter?
March 2012
Page 13
(3.5%) and compare different emission paths and abatement costs (Ellerman and Montero 2005).
Various impact assessments of the EU ETS projected 2020 prices of more than 30 EUR/tCO2. With
prices of 20 EUR/tCO2 in 2008, this implies discount rates of 3–5% (European Commission 2008;
Department of Energy and Climate Change 2009).
Empirical evidence. Another set of papers empirically explores the role of banking in the EU ETS.
estimated the annual return investors require for bearing the risk at more than 10% for various
commodity markets. Wang (2001) performs similar calculations – using a slightly different metric to
determine whether speculators are short or long. Based on reported commitments to trade he calculated
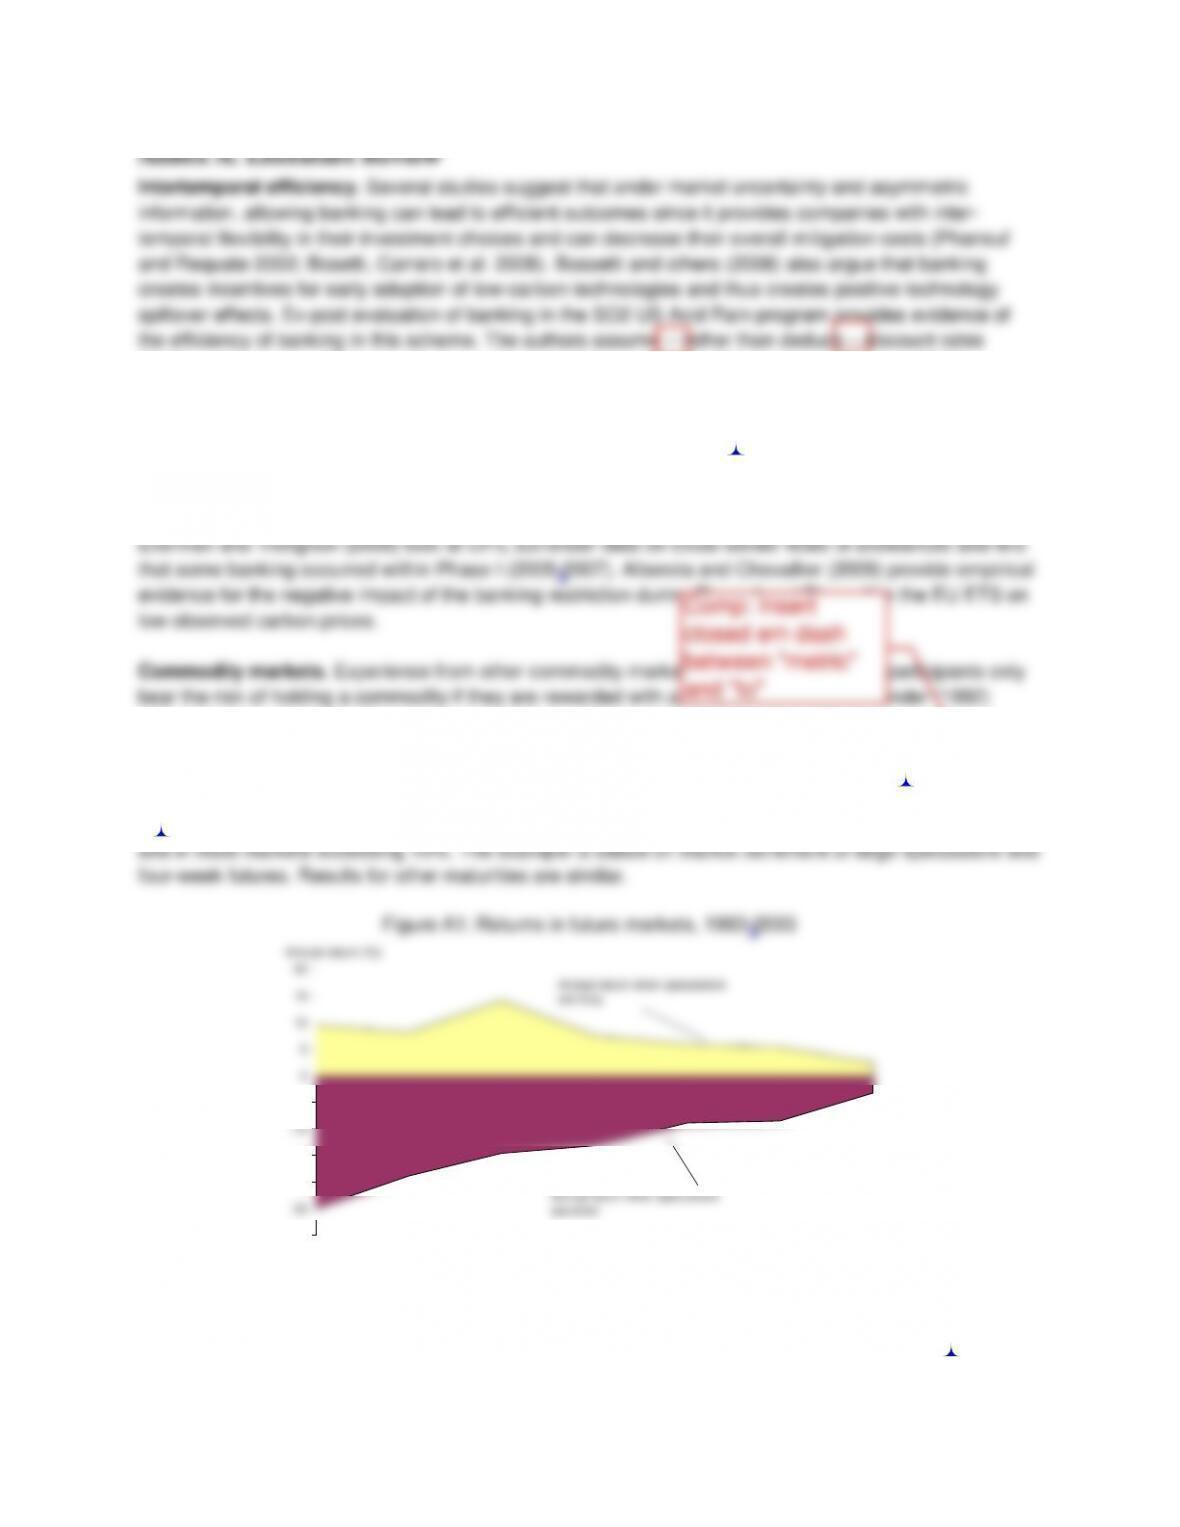
investor sentiments. They reflect the aggregate position of hedgers, large and small speculators. Figure
A2 confirms the previous results that bearing the risk is rewarded with an annual premium exceeding 5%
Source: Wang (2001). Note: conditional on large speculators’ sentiment above or below median
-30
-25
-20
-15
-10
-5
0
5
10
15
20
World sugar
Wheat
Corn
Agricultural
portfolio
Soymeal
Soybeans
Cotton
Annual return (%)
Annual return when speculators
are long
Annual return when speculators
are short

Banking of emissions allowances – does the volume matter?
March 2012
Page 14
thus 2.1 billion tCO2(e) per year.
In 2012, the inclusion of aviation will increase the cap by 10% of annual allocations (215 million tCO2(e)).
From 2013, the cap includes both aviation and new sectors, and decreases by 37 million tCO2(e) each
year until 2025, at which time the reduction in the cap is up for review.
The European Commission has allocated 300 million allowances from the New Entrant Reserve from the
period 2013–2020 to the European Investment Bank, so as to secure technology funding for carbon
capture and storage (CCS) and renewables. The European Investment Bank envisages selling future
derivative contracts against these allowances in several tranches during 2011–2013, thus effectively
increasing the supply of allowances available for hedging.
International credits
The EU ETS cap is also extended by the limitation of carbon credits allowed to be imported from Clean
Development Mechanism (CDM) and Joint Implementation (JI) projects. Accounting for aviation and new
sectors, EU ETS installations are allowed to use up to a total of 1.68 billion CDM and JI credits to cover
their emissions. According to our estimations, this volume will be reached by 2013/2014.
AU/Comp: Please
update reference
Banking of emissions allowances – does the volume matter?
March 2012
Page 15
(1.15 billion tonnes). Based upon the published list of CDM project sponsors, EU buyers (including all EU–
27 member states, Norway, Iceland, Liechtenstein and Switzerland) were involved in approximately 70%
of all 3,556 registered CDM projects as of November 2011. In the event that projects have multiple
The EU offers flexibility for installations to distribute the use of CERs throughout Phase III of EU ETS.
Given delays from an initially slow CER issuing process, and the lower cost of holding CERs (with lower
based on forward contracts, and do not have an obligation to deliver. These credits are thus not suitable
for hedging purposes. The study assumes that these projects start issuing regularly from 2011 onwards.
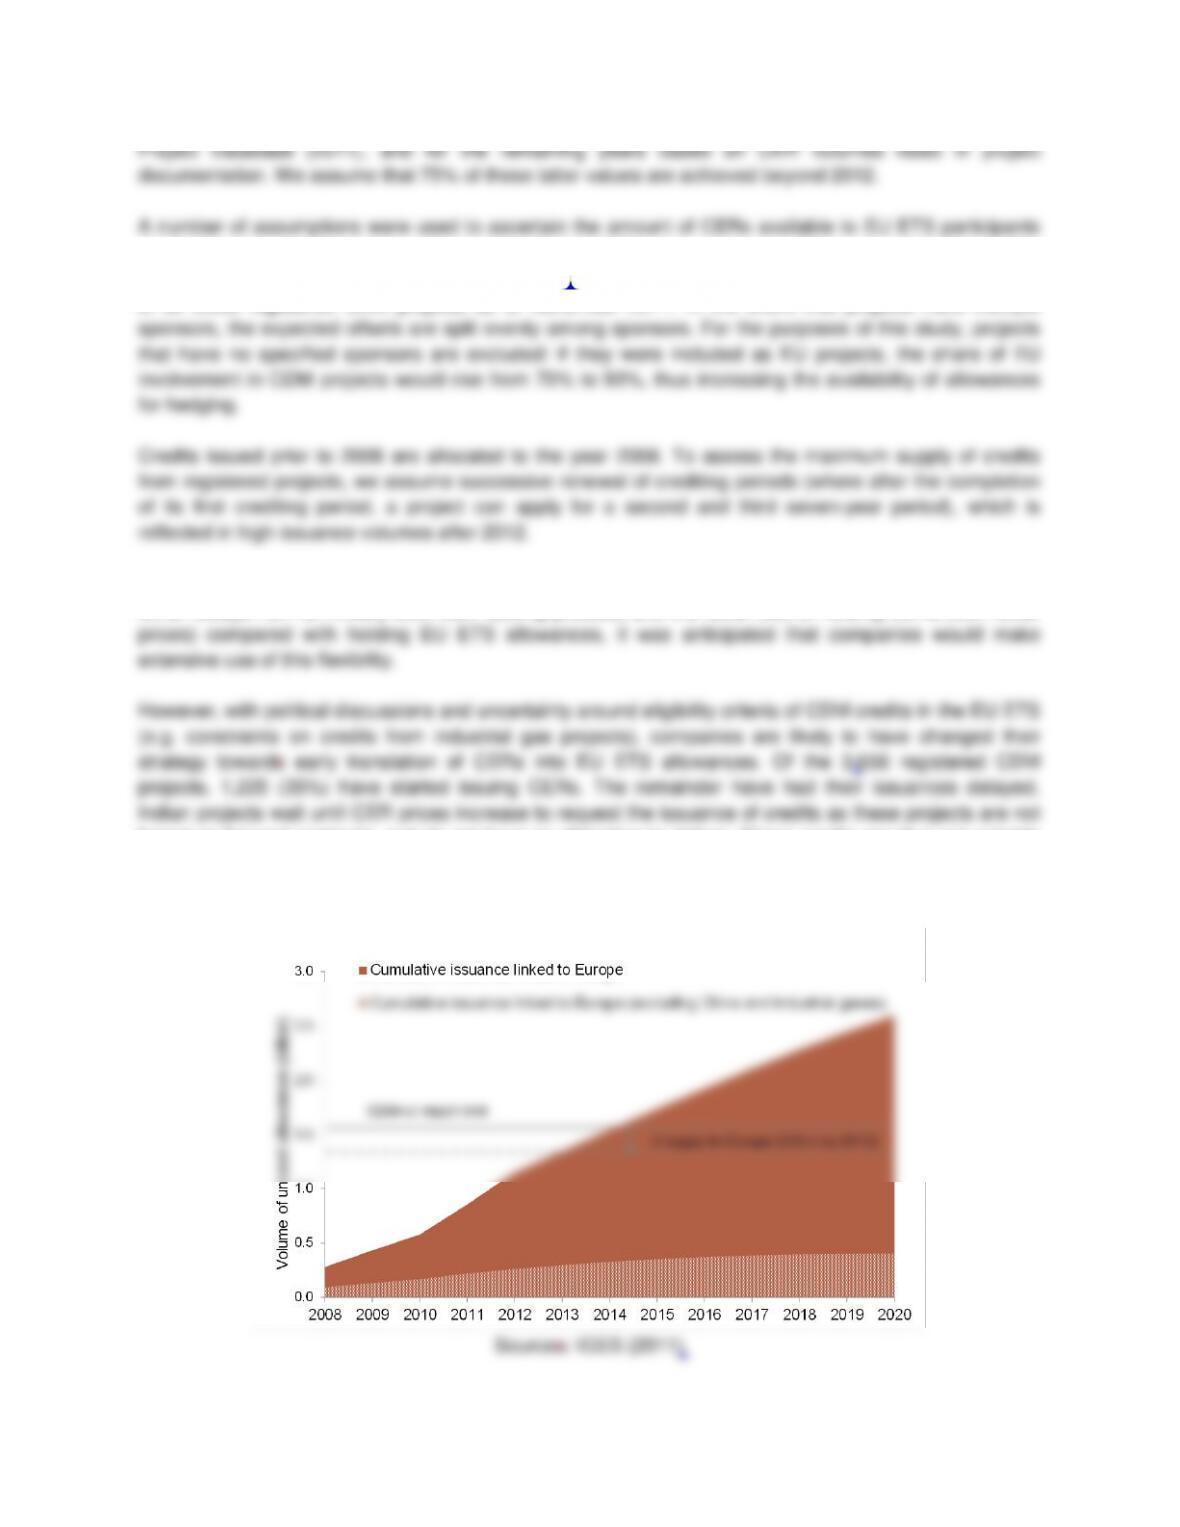
Figure B1: CER credits available for hedging purposes

Banking of emissions allowances – does the volume matter?
March 2012
Page 16
according to project documentation.
If additional JI project credits become available in the coming years, they will not impact on the scarcity of
EU ETS under the current EU ETS emissions cap, since the import limit of international offset credits will
Track 1, but their import into EU ETS is capped.
Projected EU ETS emissions
EU ETS emissions are based on Community Independent Transaction Log data (CITL 2011) for verified
emissions for the period 2008–2010, and on the European Commission current policy initiative scenario of
the Energy Roadmap 2050 from 2011 onwards (European Commission 2011). This scenario includes
Uncertainties in creation of EU ETS demand–supply balance
Emissions up to 2020 are based on the EU Commission current policy initiative scenario. Applying the
reference or the high renewables scenario, the surplus in 2013 would decrease from 913 million tonnes to
assumed to be 100%, then the supply will increase by 190 million tonnes by 2012, and the import limit will
be reached two years earlier.
The expected volume of JI credits that will be available to EU buyers by 2012 is 235 million. If additional
supply is generated by the projects currently in the pipeline, which are mainly based in Russia, this could
(e.g. combustion, steel etc.) distinguished in the CITL, the surplus decreases to 500 million mainly
because industrial producers of power are not allocated to the industry sector under the latter approach.
Banking of emissions allowances – does the volume matter?
March 2012
Page 17
Annex C – Hedging demand of power sector
Hedging demand
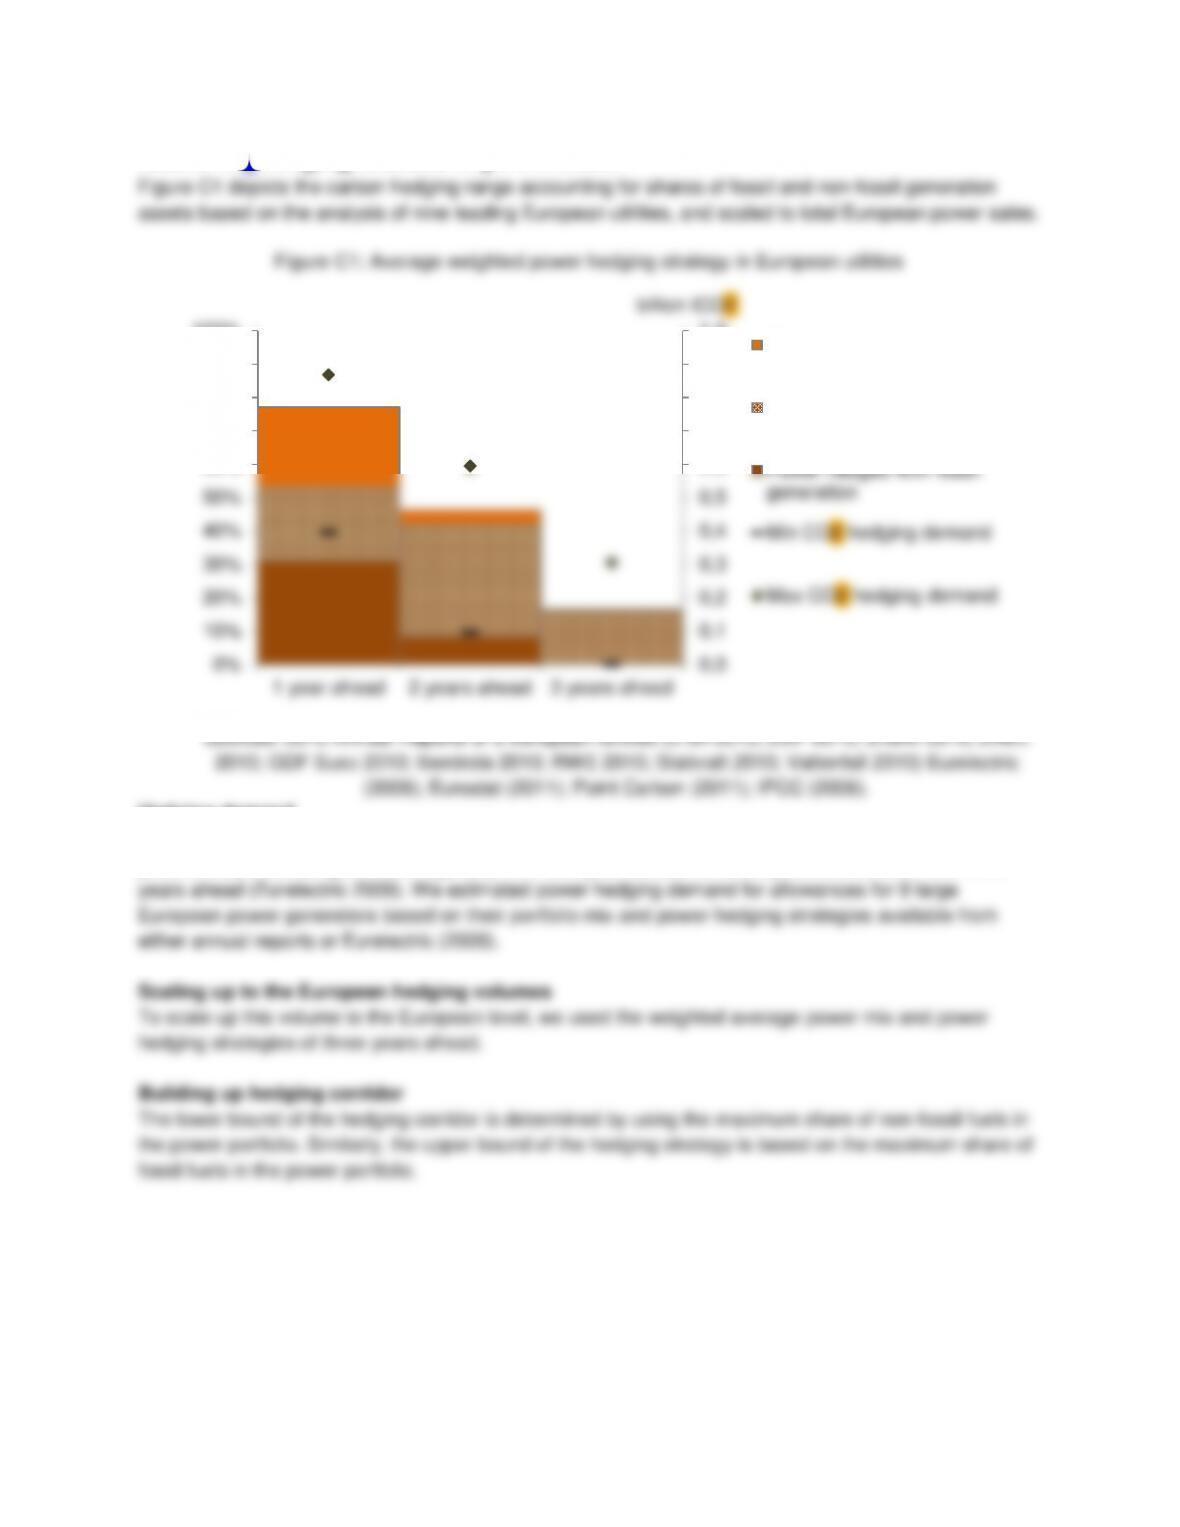
Utilities reduce their risk exposure to volatile power prices, by signing contracts to sell power up to four
years ahead of actual generation: typically 70% one year ahead, 40% two years ahead and 15% three
Calculating hedging demand for allowances
Number of emission allowances for hedging needs was estimated based on the the merit order of the
0,0
0,1
0,2
0,3
0,4
0,5
0,6
0,7
0,8
0,9
1,0
0%
10%
20%
30%
40%
50%
60%
70%
80%
90%
100%
1 year ahead 2 years ahead 3 years ahead
billion tCO2
Power hedged with non-
fossil fuels generation
Hedging corridor
(fossil/non-fossil hedge
possible)
Power hedged with fossil
generation
Min CO2 hedging demand
Max CO2 hedging demand

Banking of emissions allowances – does the volume matter?
March 2012
Page 18
Uncertainties in creating hedging corridor
The estimated hedging corridor assumed all power generators to pursue hedging strategies of three years
ahead. In practice, some of the utilities, in particular smaller ones, may have less sophisticated hedging
strategies (e.g. power sales maximum one year ahead). This would shift down the upper and the lower
In addition to the hedging corridor that results from the choice of assumed fuel mix, companies define
‘bands’ for the share of power to be sold. For example, E–on allows for a 10% band for each of the three
years in its forward power sales. Where power is fossil fuel based, this can further change the carbon
hedging corridor, but is not included in our analysis. We capture hedging demand on an annual basis and
Banking of emissions allowances – does the volume matter?
March 2012
Page 19
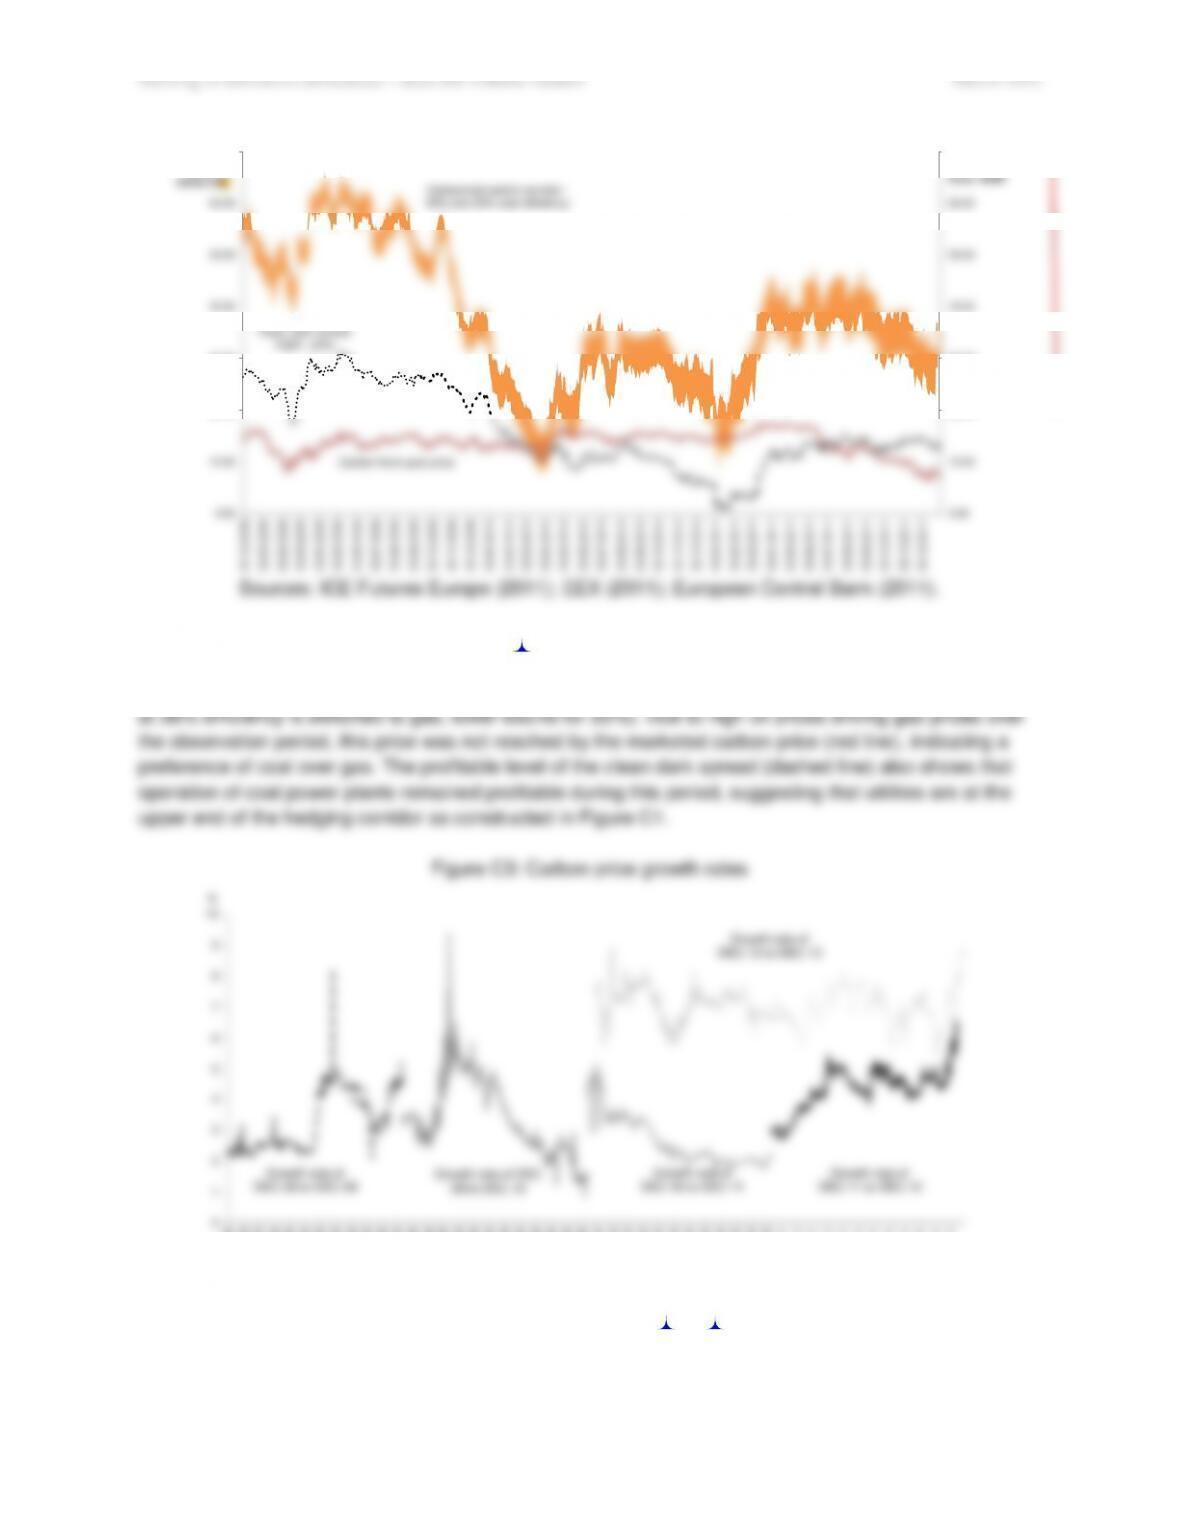
First, the energy portfolio of a utility is optimised if they initially sell output based on the lowest cost plant.
Figure C2 depicts the carbon price range in which shifting generation from a representative coal plant to a
representative gas plant becomes profitable (orange corridor – upper bound is the price where coal plant
Sources: (Point Carbon 2011)
0.00
10.00
20.00
30.00
40.00
50.00
60.00
70.00
0.00
10.00
20.00
30.00
40.00
50.00
60.00
70.00
Euro / MWh
Euro /
tonne CO2
Carbon fuel switch corridor –
38% and 33% coal efficiency
Carbon front–year price
Clean dark spread
(right –axis)
0
1
4
5
6
7
8
9
10
04.01.2008
04.02.2008
04.03.2008
04.04.2008
04.05.2008
04.06.2008
04.07.2008
04.08.2008
04.09.2008
04.10.2008
04.11.2008
04.12.2008
04.01.2009
04.02.2009
04.03.2009
04.04.2009
04.05.2009
04.06.2009
04.07.2009
04.08.2009
04.09.2009
04.10.2009
04.11.2009
04.12.2009
04.01.2010
04.02.2010
04.03.2010
04.04.2010
04.05.2010
04.06.2010
04.07.2010
04.08.2010
04.09.2010
04.10.2010
04.11.2010
04.12.2010
04.01.2011
04.02.2011
04.03.2011
04.04.2011
04.05.2011
04.06.2011
04.07.2011
04.08.2011
04.09.2011
04.10.2011
04.11.2011
04.12.2011
%
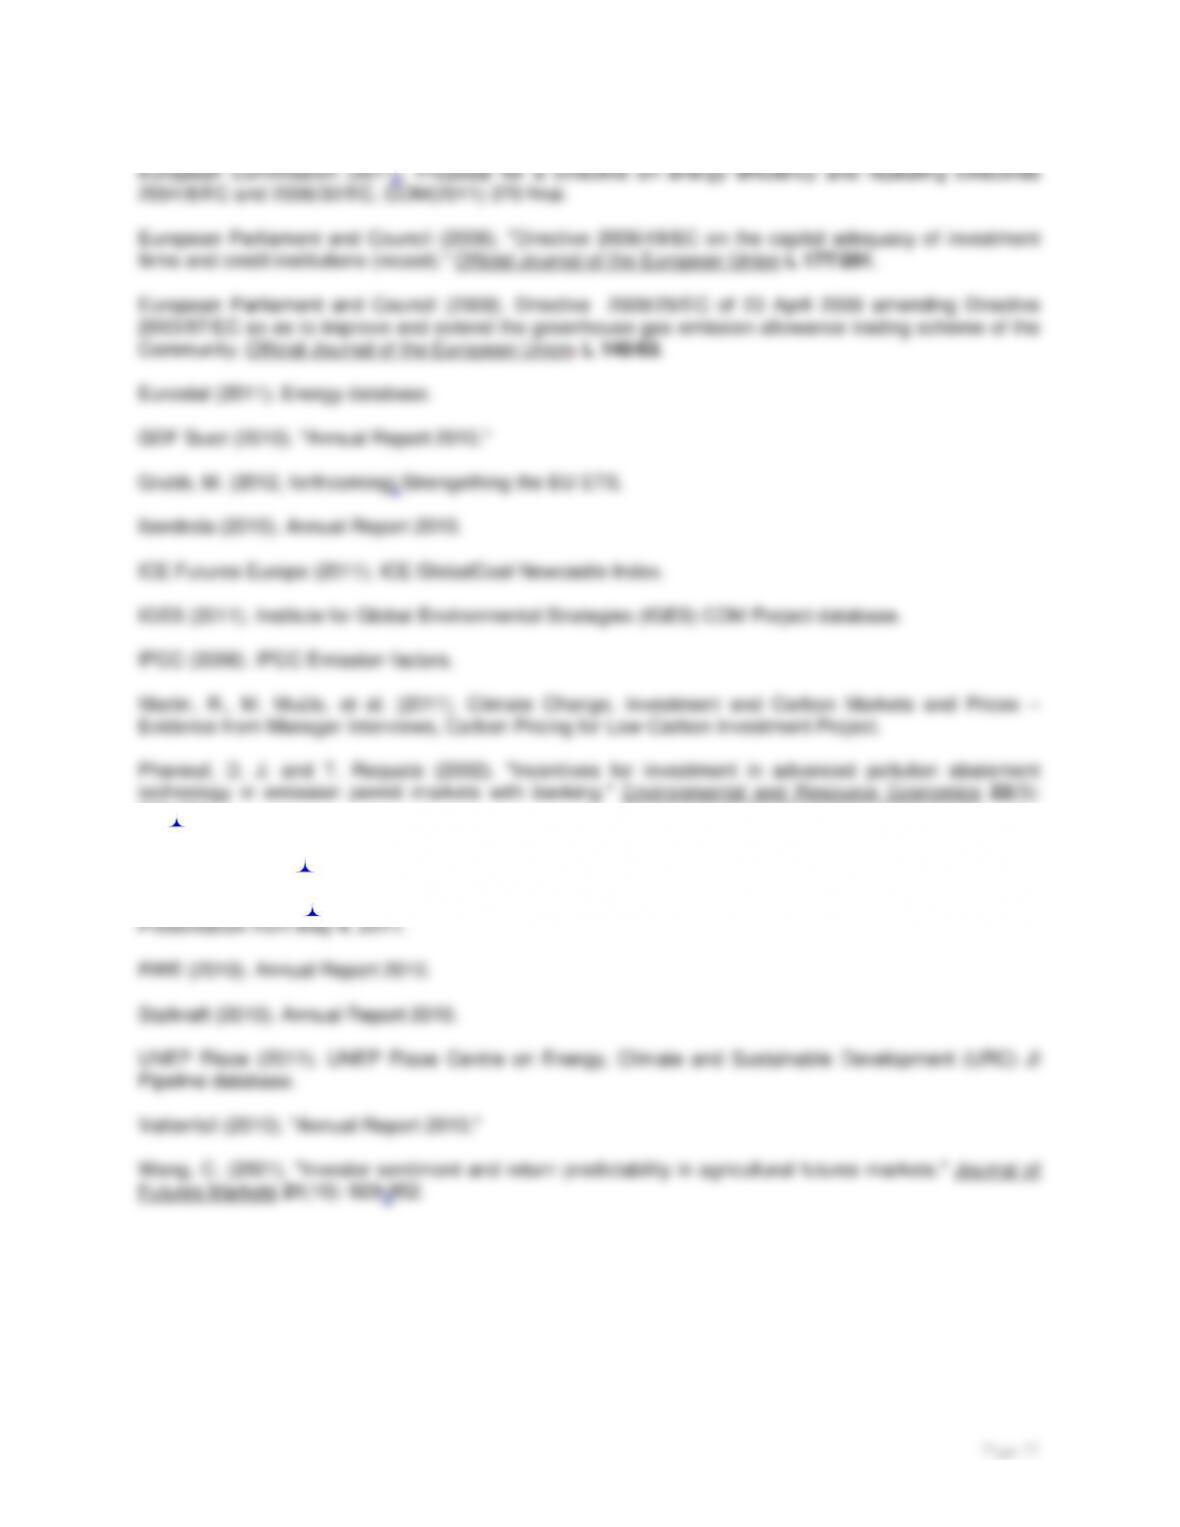
DEC 08 to DEC 09
09 to DEC 10
DEC 11 to DEC 12
DEC 10 to DEC 11
Growth rate of
DEC 12 to DEC 13

Banking of emissions allowances – does the volume matter?
March 2012
Page 20
Second, expectations about increasing carbon prices create an incentive to buy more carbon. Rather than
directly owning allowances, power companies sign contracts on the carbon price with third parties that
hold allowances. Thus power companies avoid the cash requirements, while the third party avoids the risk
References
Alberola, E. and J. Chevallier (2009). “European carbon prices and banking restrictions: Evidence from
Phase I (2005–2007).” The Energy Journal, forthcoming.
Department of Energy and Climate Change (2009). Impact Assessment of EU Climate and Energy
package, the revised EU Emissions Trading System Directive and meeting UK non–traded target through
UK carbon budgets.
E-on (2010). Annual report 2010.
EDF (2010). Annual Report 2010.
to be set aside, Press release.
Eurelectric (2009). EU ETS Phase 3 Auctioning – Timing and Futures versus Spot.
European Central Bank (2011). USD/ Euro Exchange rate.
Banking of emissions allowances – does the volume matter?
March 2012
Page 21
369–390.
Point Carbon (2011). EUA front–year carbon price assessments.
Point Carbon (2011). European Emission Prices: A forecast – Where are the prices going and why?,