Exercise 12-7: Sam’s Club
Inputs
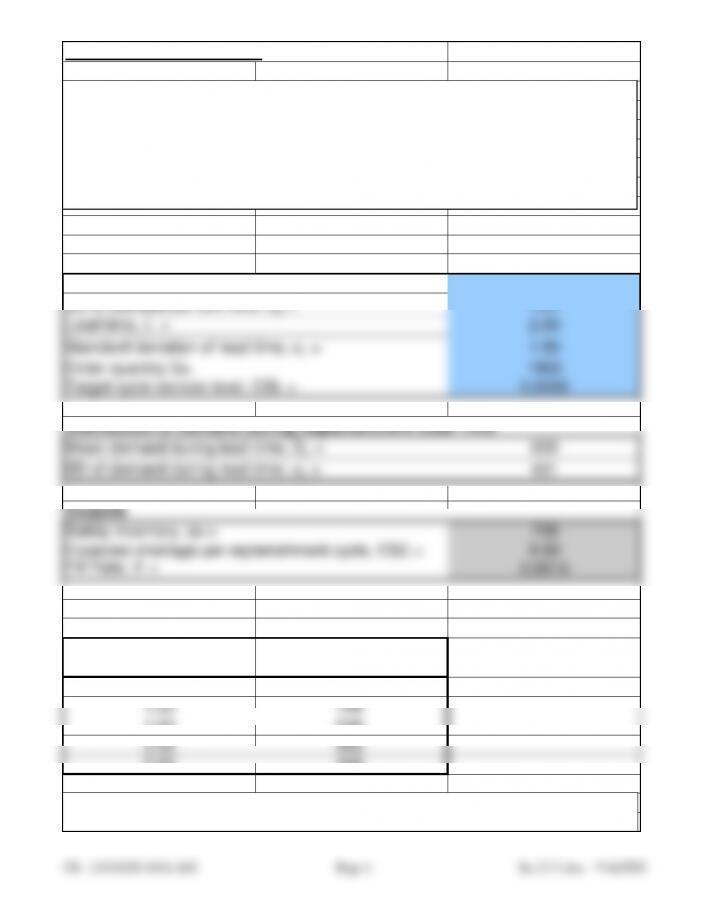
Average demand per unit time, D = 250
SD of demand per unit time, σD = 150
Lead time, L = 2.00
Standard deviation of lead time, σL = 1.50
Order quantity Q= 1000
Target cycle service level, CSL = 0.9500
Distribution of Demand during Replenishment Lead Time
Mean demand during lead time, DL = 500
Outputs
Safety inventory, ss = 709
Expected shortage per replenishment cycle, ESC = 9.00
Fill Rate, fr = 0.9910
Return to the Sam’s Club store in Problem 4. Assume that the supply lead time from HP is normally
distributed with a mean of 2 weeks and a standard deviation of 1.5 weeks. How much safety inventory
should Sam’s Club carry if they want to provide a cycle service level of 95 percent? How does the
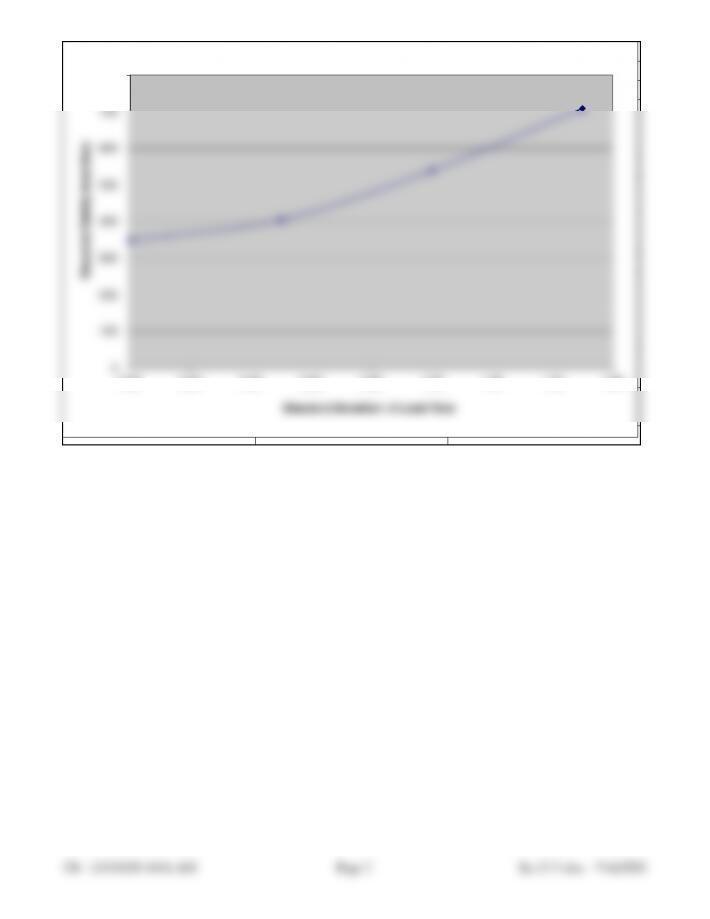
required safety inventory change as the standard deviation of lead time is reduced from 1.5 weeks to
zero in intervals of 0.5 weeks?
0
100
200
300
400
500
600
700
800
0.00 0.20 0.40 0.60 0.80 1.00 1.20 1.40 1.60
Required Safety Inventory
Standard Deviation of Lead Time
Exercise 12-7: Sam’s Club
Inputs
Average demand per unit time, R = 250
SD of demand per unit time, sR = 150
Lead time, L = 2
Standard deviation of lead time, sL = 1.5
Order quantity, Q= 1000
Target cycle service level, CSL = 0.95
Distribution of Demand during Replenishment Lead Time
Mean demand during lead time, RL = =C13*(C15)
SD of demand during lead time, sL = =SQRT(C15*C14^2+C13^2*C16^2)
Outputs
Safety Inventory, ss = =NORMSINV(C18)*C22
Expected shortage per replenishment cycle, ESC =
=-C25*(1-NORMDIST(C25/C22,0,1,1))+C22*NORMDIST(C25/C22,0,1,0)
Fill Rate, fr = =(C17-C26)/C17
Standard Deviation of Lead Time Required Safety Inventory
1.5 709
1539
0.5 405
0349
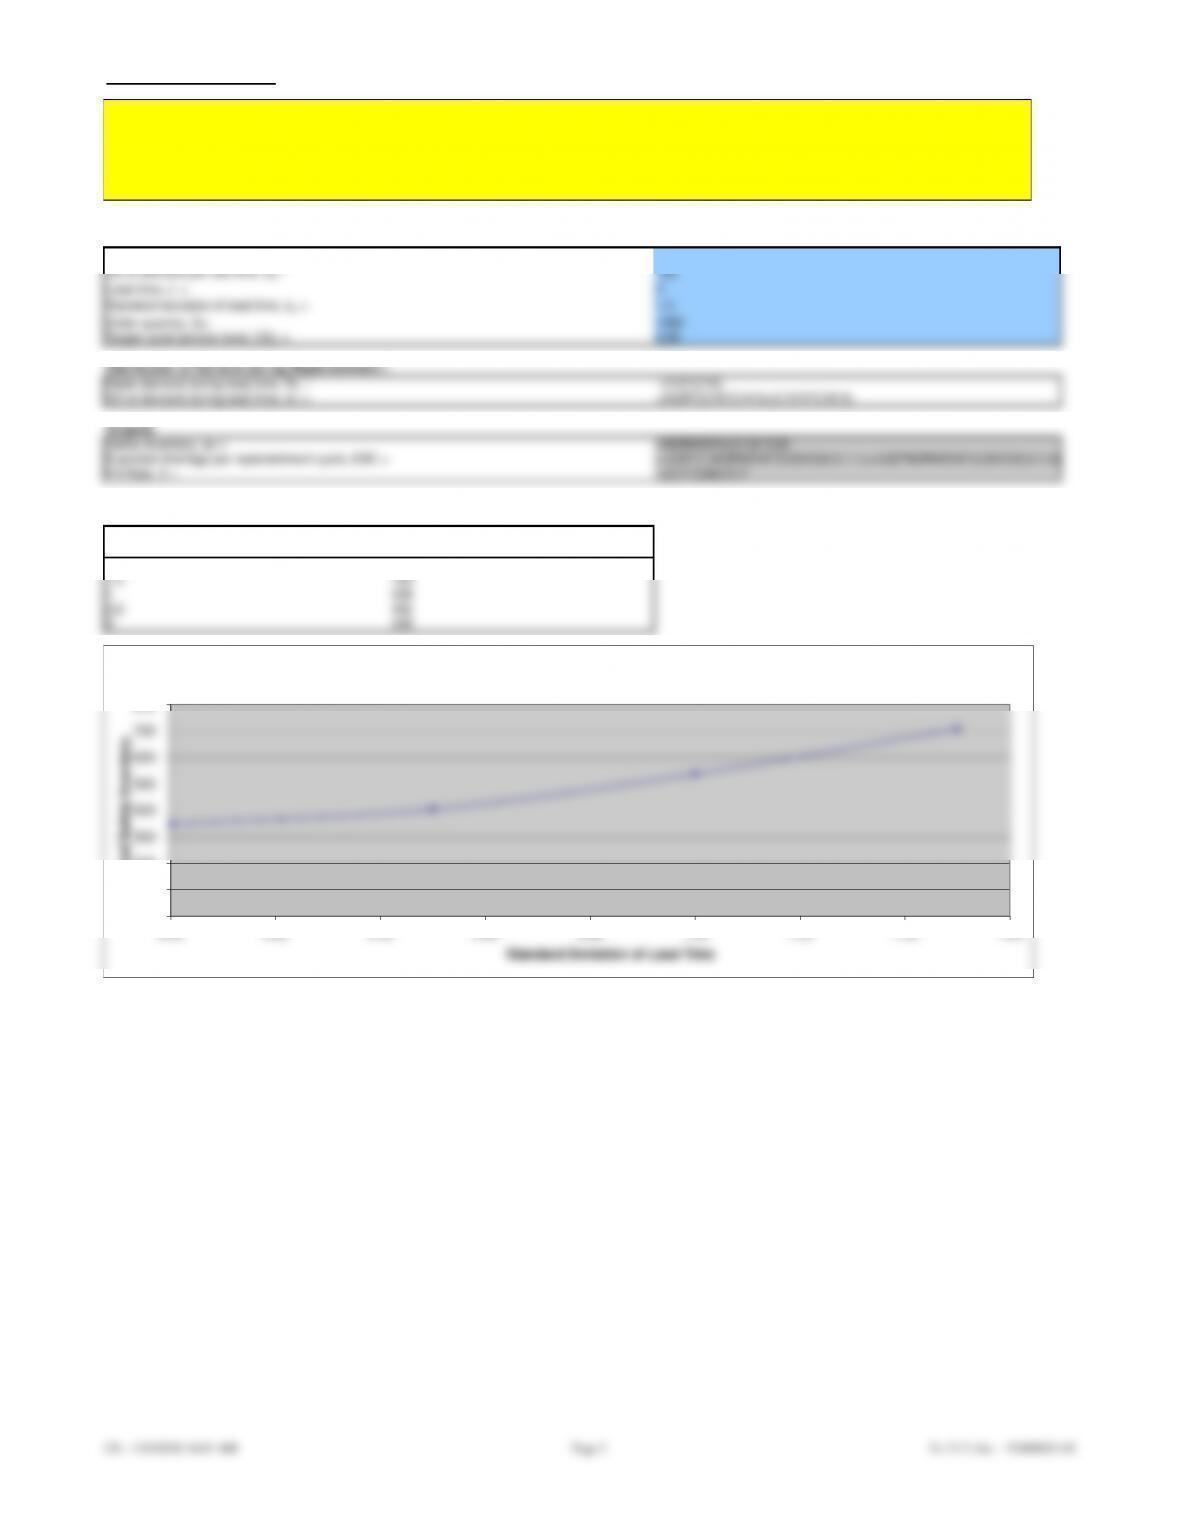
Return to the Sam’s Club store in Problem 4. Assume that the supply lead time from HP is normally distributed with a mean of 2 weeks and a standard deviation of 1.5
weeks. How much safety inventory should Sam’s Club carry if they want to provide a cycle service level of 95 percent? How does the required safety inventory change
as the standard deviation of lead time is reduced from 1.5 weeks to zero in intervals of 0.5 weeks?
0
100
200
300
400
500
600
700
800
0.00 0.20 0.40 0.60 0.80 1.00 1.20 1.40 1.60
Required Safety Inventory
Standard Deviation of Lead Time
Standard Deviation of Lead Time vs. Required Safety Inventory