Exercise 12-3: Best Buy
Inputs
Average demand per unit time, D = 300
Lead time, L = 2
SD of demand per unit time, σD = 200
Target cycle service level 0.95
Distribution of Demand during Lead Time
Mean demand during lead time, DL = 600
SD of demand during lead time, σL = 283
Output
Safety inventory, ss = 465
Reorder point, ROP = 1,065
Reorder point increment = 10
Cycle Service Level & Inventory
Point (ROP ) Inventory (ss ) Level (CSL )
600 0 0.5000
610 10 0.5141
620 20 0.5282
630 30 0.5422
640 40 0.5562
650 50 0.5702
660 60 0.5840
670 70 0.5977
680 80 0.6114
Weekly demand for Motorola cell phones at a Best Buy store is normally
distributed with a mean of 300 and a standard deviation of 200.
Motorola takes two weeks to supply a Best Buy order. Best Buy is
targeting a cycle service level of 95 percent and monitors its inventory
continuously. How much safety inventory of cell phones should Best
800 200 0.7602
810 210 0.7711
820 220 0.7817
830 230 0.7919
840 240 0.8019
850 250 0.8116
860 260 0.8210
870 270 0.8301
880 280 0.8389
890 290 0.8474
900 300 0.8556
910 310 0.8635
920 320 0.8711
1030 430 0.9358
1040 440 0.9401
1050 450 0.9442
1060 460 0.9481
1070 470 0.9517
1160 560 0.9761
1170 570 0.9781
1180 580 0.9798
1190 590 0.9815
1200 600 0.9831
1210 610 0.9845
1220 620 0.9858
1260 660 0.9902
CR – 12/3/2020 10:01 AM Page 2 Ex 12-3.xlsx – VALUES
0.0000
0.0500
0.1000
0.1500
0.2000
0.2500
0.3000
0.3500
0.4000
0.4500
0.5000
0.5500
0.6000
0.6500
0.7000
0.7500
0.8000
0.8500
0.9000
0.9500
1.0000
0100 200 300 400 500 600 700
CycleService Level
Safety Stock
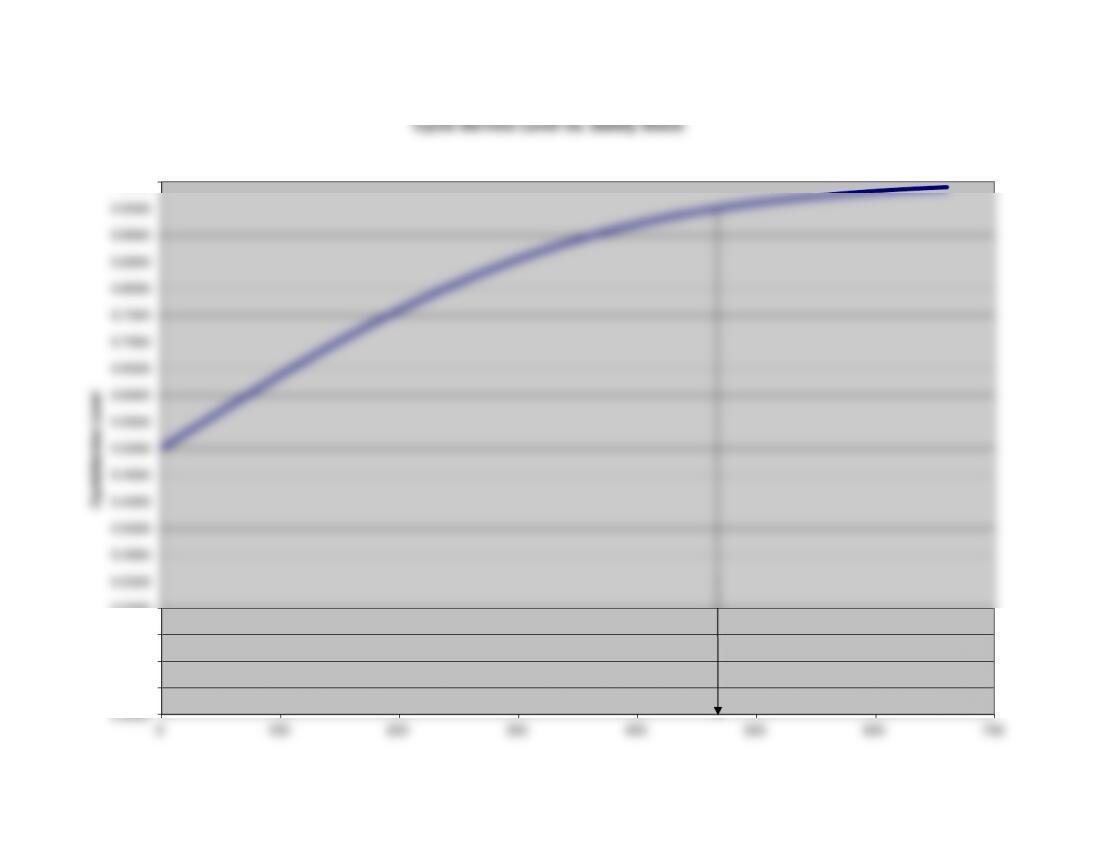
Cycle Service Level vs. Safety Stock
Exercise 12-3: Best Buy
Inputs
Average demand per unit time, R = 300
Lead time, L = 2
SD of demand per unit time, sR = 200
Target cycle service level 0.95
Distribution of Demand during Lead Time
Mean demand during lead time, RL = =C12*C13
SD of demand during lead time, sL = =C14*SQRT(C13)
Output
Safety inventory, ss = =NORMSINV(C15)*C19
Reorder point, R = =C22+C18
Reorder point increment = 10
Cycle Service Level & Inventory
Reorder Safety Cycle Service
Point ROP Inventory ss Level (CSL )
Weekly demand for Motorola cell phones at a Best Buy store is normally distributed with a mean of 300 and a standard deviation of 200.
Motorola takes two weeks to supply a Best Buy order. Best Buy is targeting a cycle service level of 95 percent and monitors its inventory
continuously. How much safety inventory of cell phones should Best Buy carry? What should their reorder point be?
=+A70+$C$25 =+A71-$C$18 =NORMDIST(A71,$C$18,$C$19,1)
=+A71+$C$25 =+A72-$C$18 =NORMDIST(A72,$C$18,$C$19,1)
=+A72+$C$25 =+A73-$C$18 =NORMDIST(A73,$C$18,$C$19,1)
=+A73+$C$25 =+A74-$C$18 =NORMDIST(A74,$C$18,$C$19,1)
=+A74+$C$25 =+A75-$C$18 =NORMDIST(A75,$C$18,$C$19,1)
=+A75+$C$25 =+A76-$C$18 =NORMDIST(A76,$C$18,$C$19,1)
=+A76+$C$25 =+A77-$C$18 =NORMDIST(A77,$C$18,$C$19,1)
=+A77+$C$25 =+A78-$C$18 =NORMDIST(A78,$C$18,$C$19,1)
=+A78+$C$25 =+A79-$C$18 =NORMDIST(A79,$C$18,$C$19,1)
=+A79+$C$25 =+A80-$C$18 =NORMDIST(A80,$C$18,$C$19,1)
=+A80+$C$25 =+A81-$C$18 =NORMDIST(A81,$C$18,$C$19,1)
=+A81+$C$25 =+A82-$C$18 =NORMDIST(A82,$C$18,$C$19,1)
=+A82+$C$25 =+A83-$C$18 =NORMDIST(A83,$C$18,$C$19,1)
=+A83+$C$25 =+A84-$C$18 =NORMDIST(A84,$C$18,$C$19,1)
=+A84+$C$25 =+A85-$C$18 =NORMDIST(A85,$C$18,$C$19,1)
=+A85+$C$25 =+A86-$C$18 =NORMDIST(A86,$C$18,$C$19,1)
=+A86+$C$25 =+A87-$C$18 =NORMDIST(A87,$C$18,$C$19,1)
=+A87+$C$25 =+A88-$C$18 =NORMDIST(A88,$C$18,$C$19,1)
=+A88+$C$25 =+A89-$C$18 =NORMDIST(A89,$C$18,$C$19,1)
=+A89+$C$25 =+A90-$C$18 =NORMDIST(A90,$C$18,$C$19,1)
=+A90+$C$25 =+A91-$C$18 =NORMDIST(A91,$C$18,$C$19,1)
=+A91+$C$25 =+A92-$C$18 =NORMDIST(A92,$C$18,$C$19,1)
=+A92+$C$25 =+A93-$C$18 =NORMDIST(A93,$C$18,$C$19,1)
=+A93+$C$25 =+A94-$C$18 =NORMDIST(A94,$C$18,$C$19,1)
=+A94+$C$25 =+A95-$C$18 =NORMDIST(A95,$C$18,$C$19,1)
=+A95+$C$25 =+A96-$C$18 =NORMDIST(A96,$C$18,$C$19,1)
CR – 12/3/2020 10:01 AM Page 5 Ex 12-3.xlsx – FORMULAS