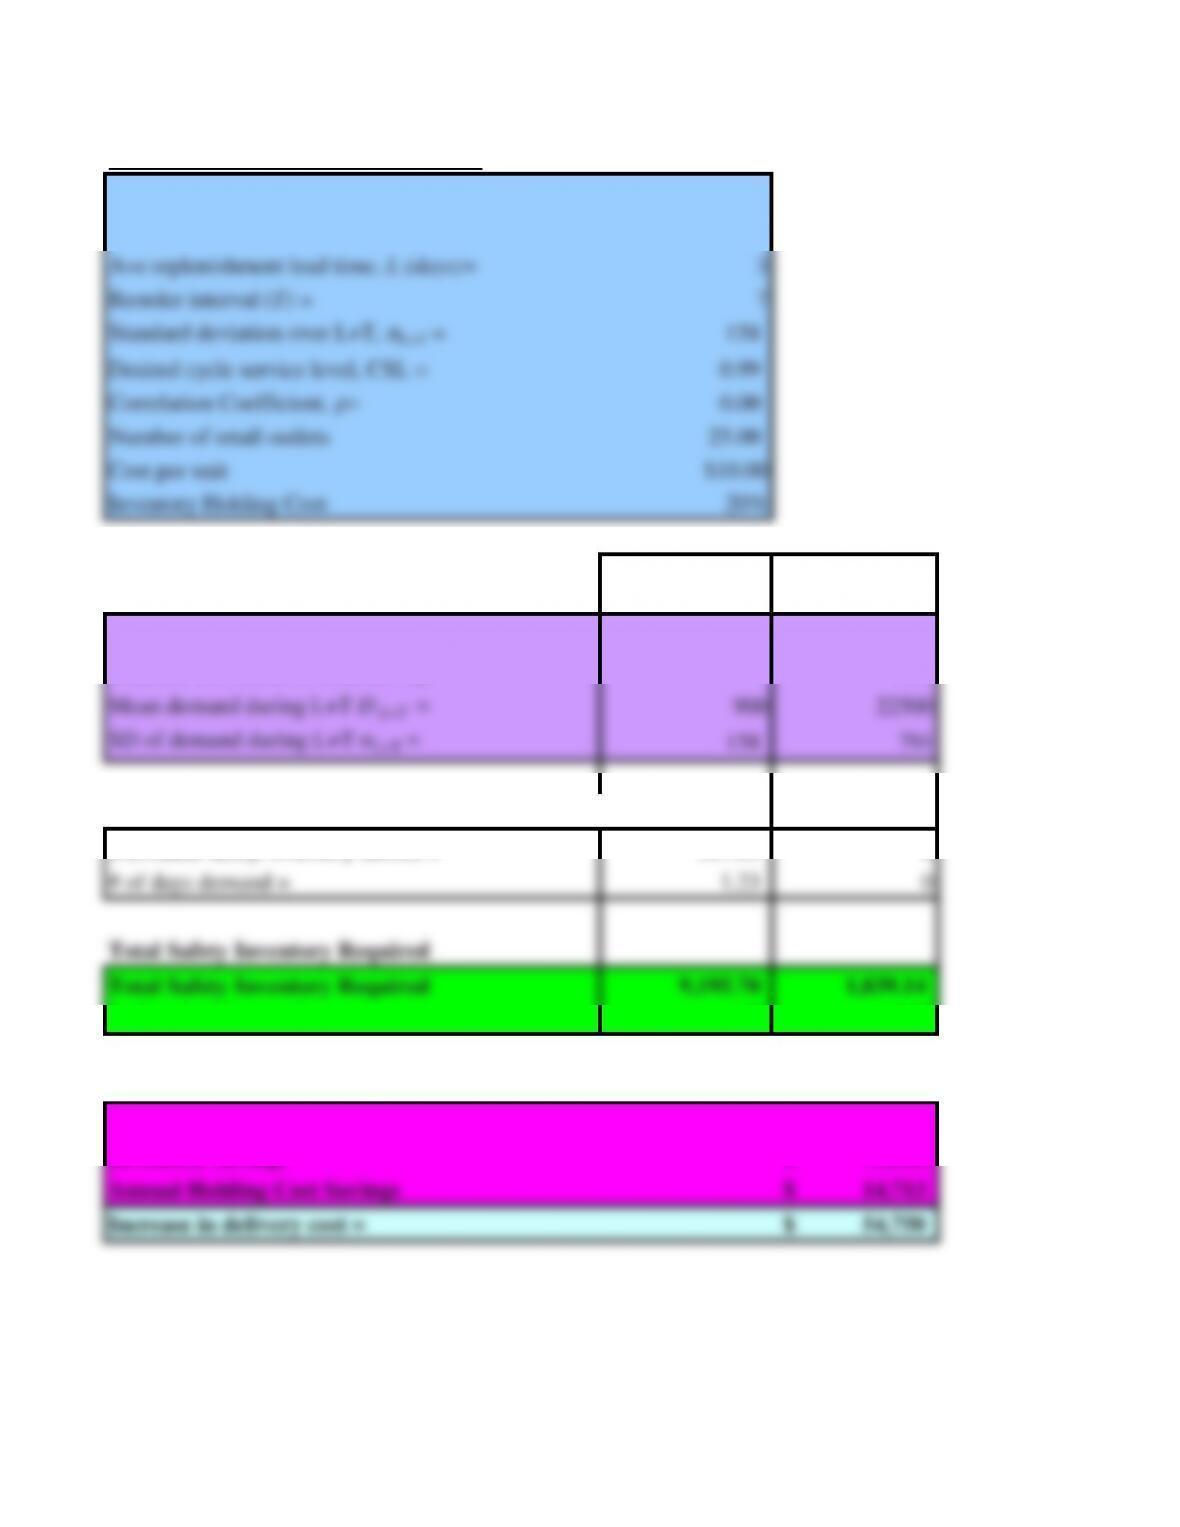
Value of Aggregation (Problem 12.24)
Demand per period (daily) per location, Di = 300
Standard deviation of demand, sD = 50
Ave replenishment lead time, L (days)= 3
Reorder interval (T) = 7
Standard deviation over L+T, σL+T = 158
Desired cycle service level, CSL = 0.99
Correlation Coefficient, r= 0.00
Number of retail outlets 25.00
Cost per unit $10.00
Inventory Holding Cost 20%
Intermediate Calculation
Without
Aggregation
With
Aggregation
Mean Weekly Demand, DC7500
Mean demand during L+T DL+T = 900 22500
Resulting Safety Inventory Level at Each Retail Outlet
Estimated safety inventory (units) = 367.83 0
# of days demand = 1.23 0
Total Safety Inventory Required
Total Safety Inventory Required 9,195.70 1,839.14
# of weeks’ demand = 1.23 0.25
Safety Inventory Savings through Aggregation
Unit Savings 7,356.56
Inventory Savings 73,566$
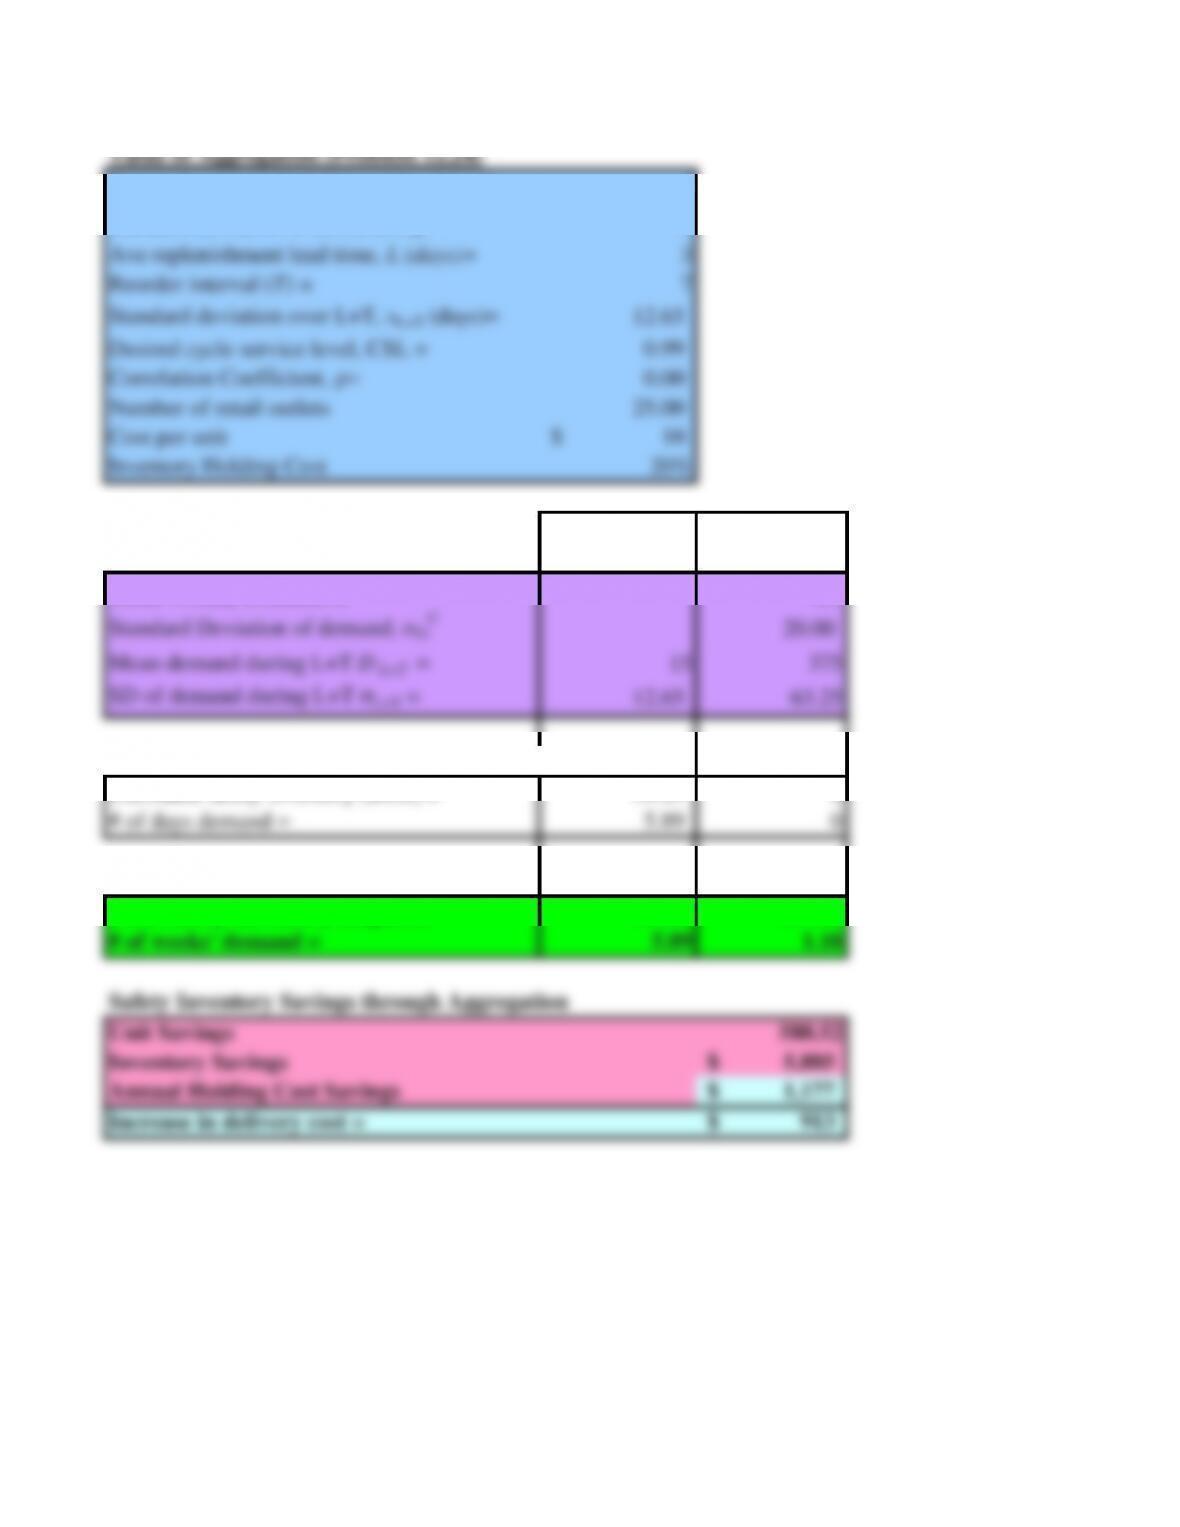
Value of Aggregation (Problem 12.24)
Demand per period (daily) per location, Di =
5
Standard deviation of demand, sD = 4
Ave replenishment lead time, L (days)= 3
Reorder interval (T) = 7
Standard deviation over L+T, sL+T (days)= 12.65
Desired cycle service level, CSL = 0.99
Correlation Coefficient, r= 0.00
Number of retail outlets 25.00
Cost per unit 10$
Inventory Holding Cost 20%
Intermediate Calculation
Without
Aggregation
With
Aggregation
Mean Weekly Demand, DC125
Standard Deviation of demand, sDC20.00
Mean demand during L+T DL+T = 15 375
SD of demand during L+T sL+T = 12.65 63.25
Resulting Safety Inventory Level at Each Retail Outlet
Total Safety Inventory Required
Total Safety Inventory Required 735.66 147.13
# of weeks’ demand = 5.89 1.18
Safety Inventory Savings through Aggregation
Unit Savings 588.52
Inventory Savings 5,885$
Annual Holding Cost Savings 1,177$
Increase in delivery cost = 913$