Exercise 12-1: Apple Store
Inputs
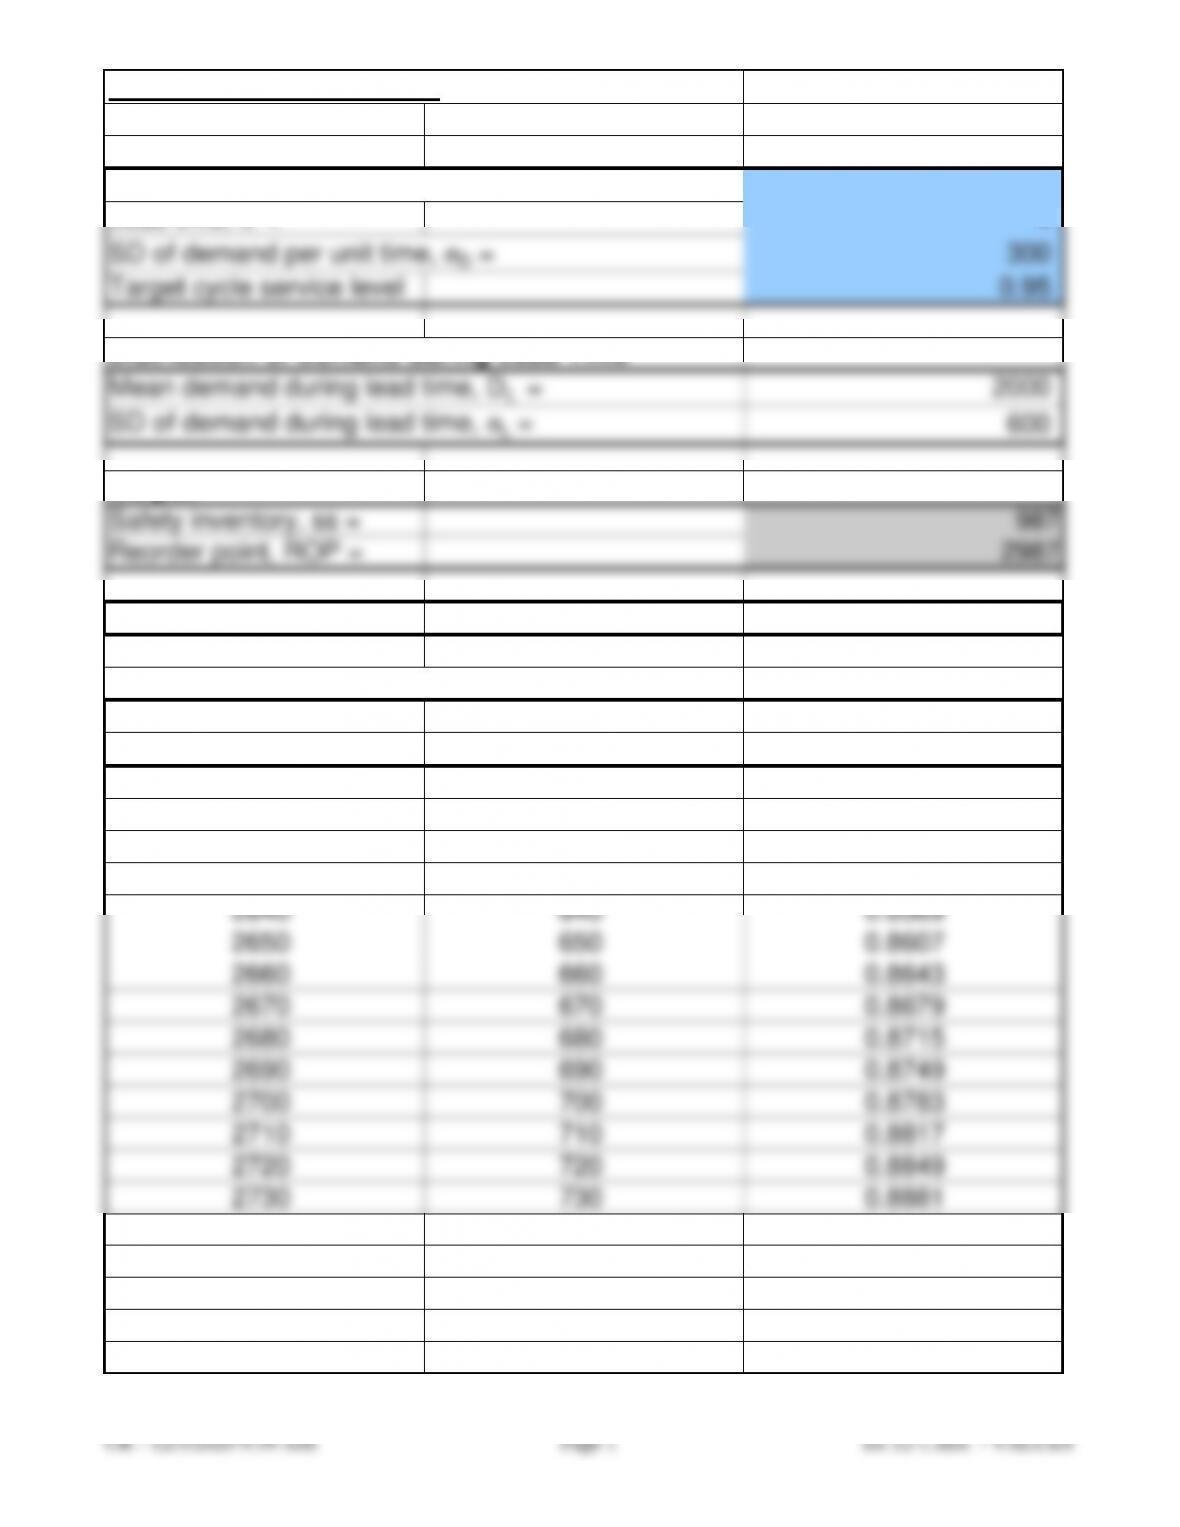
Average demand per unit time, D = 500
Lead time, L = 4
SD of demand per unit time, σD = 300
Target cycle service level 0.95
Distribution of Demand during Lead Time
Mean demand during lead time, DL = 2000
SD of demand during lead time, σL = 600
Output
Safety inventory, ss = 987
Reorder point, ROP = 2987
Reorder point increment = 10
Cycle Service Level & Inventory
Reorder Safety Cycle Service
Point (ROP ) Inventory (ss ) Level (CSL )
2600 600 0.8413
2610 610 0.8453
2620 620 0.8493
2630 630 0.8531
2640 640 0.8569
2650 650 0.8607
2660 660 0.8643
2670 670 0.8679
2680 680 0.8715
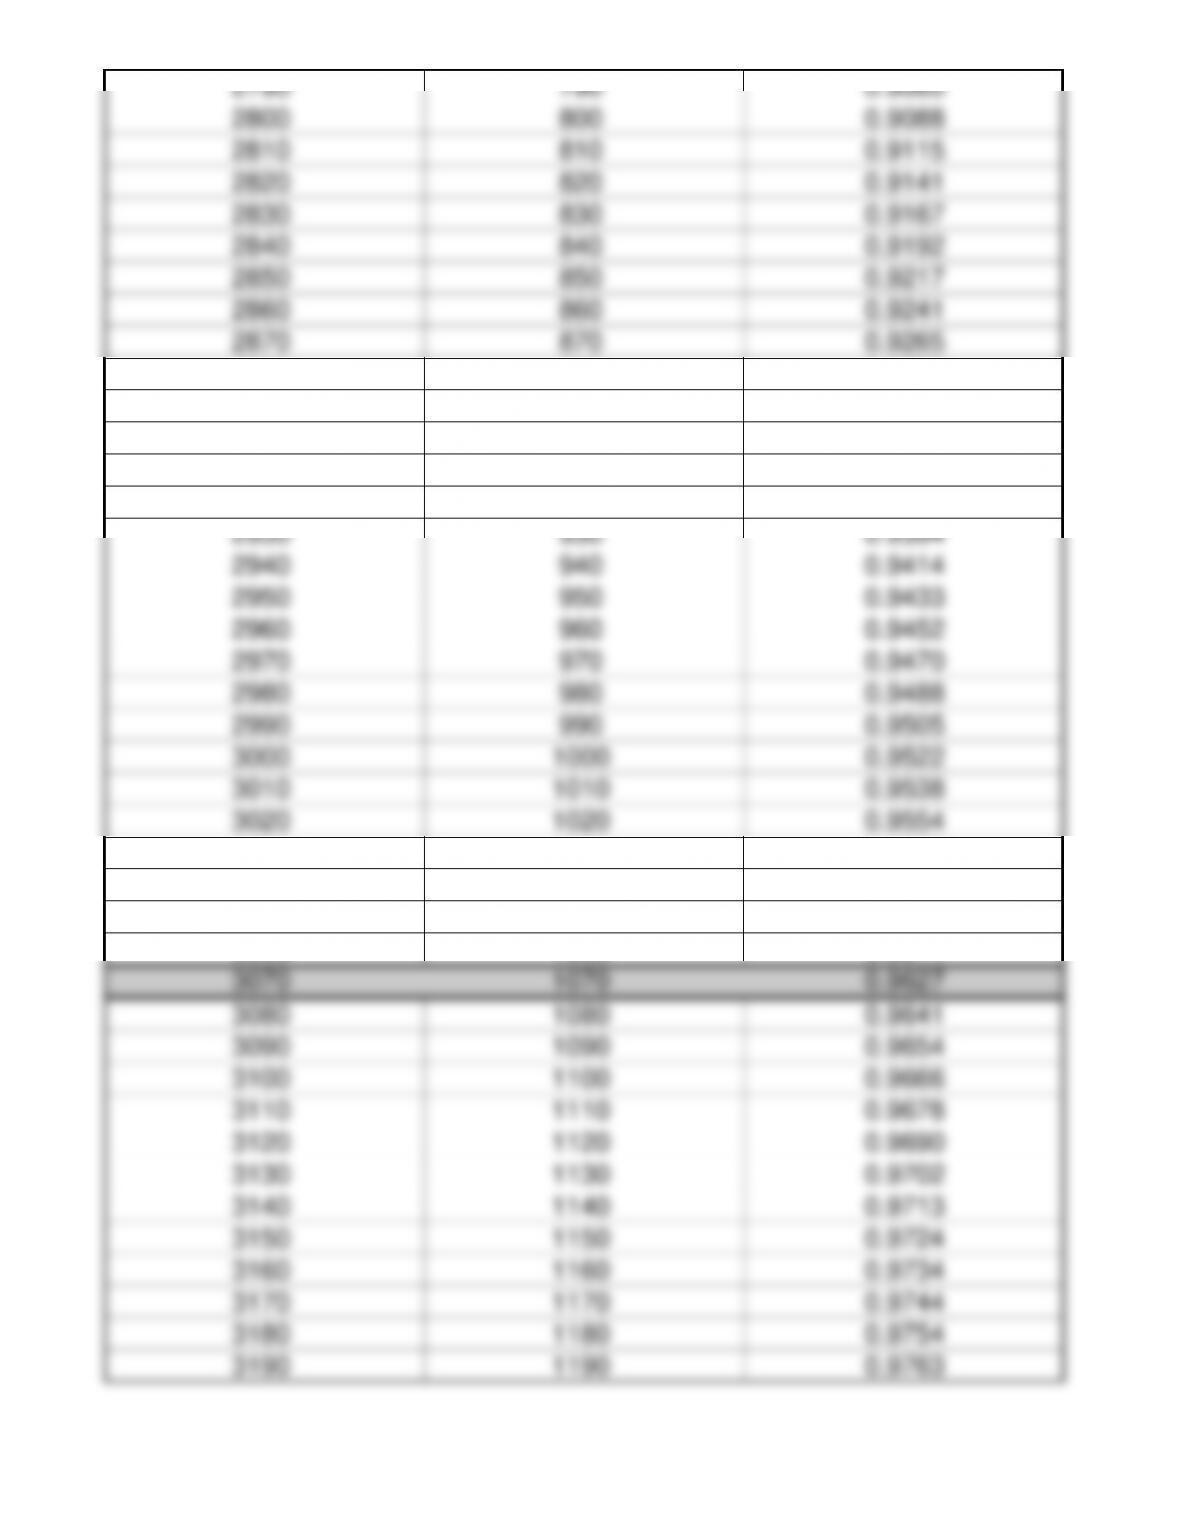
2780 780 0.9032
2790 790 0.9060
2800 800 0.9088
2810 810 0.9115
2820 820 0.9141
2830 830 0.9167
2920 920 0.9374
2930 930 0.9394
2940 940 0.9414
2950 950 0.9433
2960 960 0.9452
2970 970 0.9470
3070 1070 0.9627
3080 1080 0.9641
3090 1090 0.9654
3100 1100 0.9666
3110 1110 0.9678
3200 1200 0.9772
3210 1210 0.9781
3220 1220 0.9790
3230 1230 0.9798
3240 1240 0.9806
3250 1250 0.9814
3260 1260 0.9821