Exercise 7-8
Period
Demand
Level Forecast
EtAtBias MSE MAD
Percent
Error
MAPE TS
1517
2510
3557
4498
5498 516
6444 501 516 72 72 72 5,184 72 16.2 16.2 1.00
7526 505 501 -25 25 47 2,895 32 4.7 10.4 1.47
8441 481 505 64 64 111 3,278 40 14.4 11.8 2.77
9541 490 481 -60 60 51 3,347 44 11.0 11.6 1.17
10 445 479 490 45 45 96 3,082 44 10.1 11.3 2.18
479 Estimate of standard deviation of forecast error: 55
Alpha =
0.2
Period
Demand
Level Forecast
EtAtBias MSE MAD
Percent
Error
MAPE TS
0498
1517 502 498 -19 19 -19 372 19 3.7 3.7 -1.00
2510 503 502 -8 8-28 222 14 1.7 2.7 -2.00
3557 514 503 -54 54 -81 1,111 27 9.7 5.0 -3.00
4498 511 514 16 16 -65 897 24 3.2 4.6 -2.69
5498 508 511 13 13 -53 751 22 2.6 4.2 -2.39
6444 495 508 64 64 12 1,313 29 14.5 5.9 0.40
7526 502 495 -31 31 -19 1,259 29 5.8 5.9 -0.65
8441 489 502 61 61 41 1,560 33 13.7 6.9 1.25
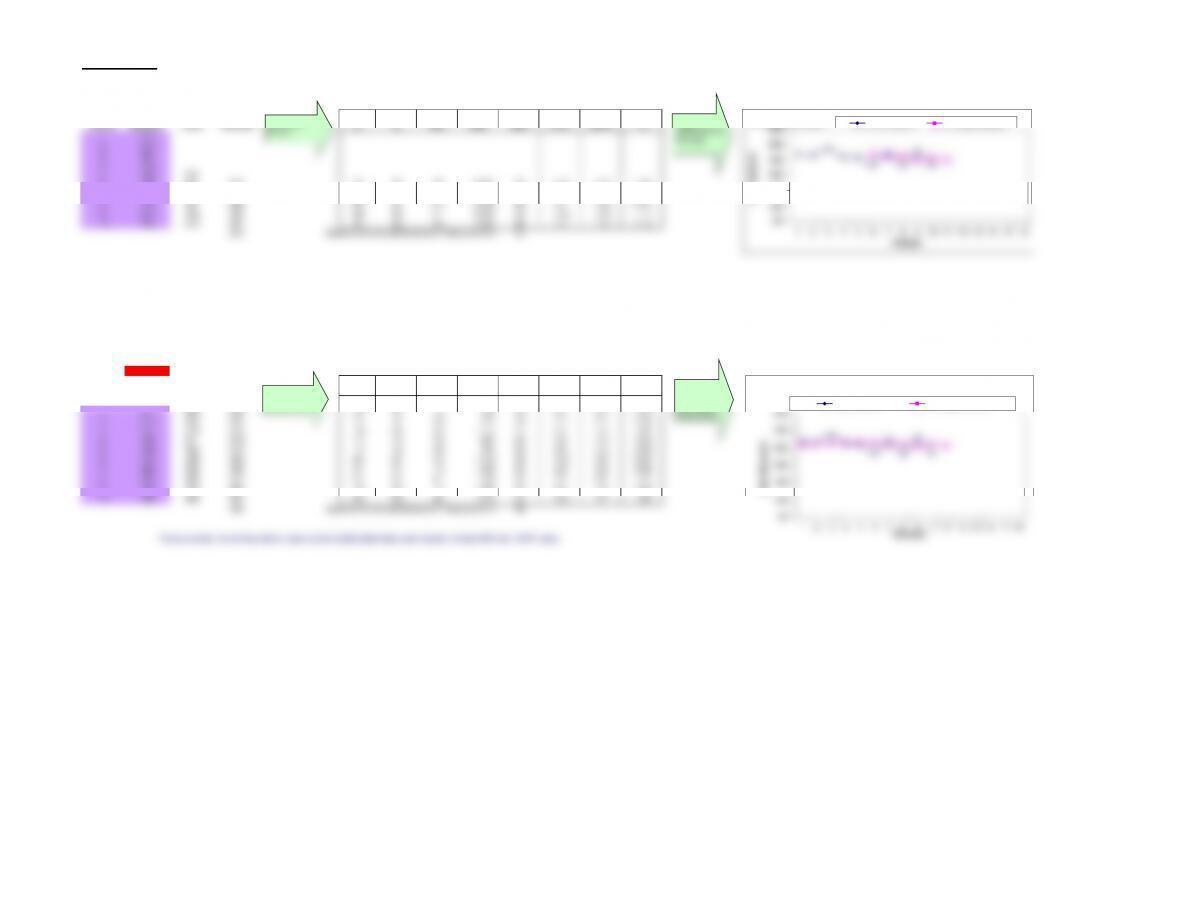
The exponential smoothing method seems to be slightly better because it results in lower MAD and MAPE value
ERRORS
MOVING AVERAGE
ERRORS
EXPONENTIAL SMOOTHING
380
480
580
680
EXPONENTIAL SMOOTHING
Actual Demand Forecasted Demand
80
180
280
380
480
580
680
12345678910 11 12 13 14 15 16
Unit Demand
Periods
Moving Average Actual Demand Forecasted Demand
Calculate
Errors
Graph
Using Moving
Average
Calculate
Errors
Graph
Using
Exponential
Smoothing