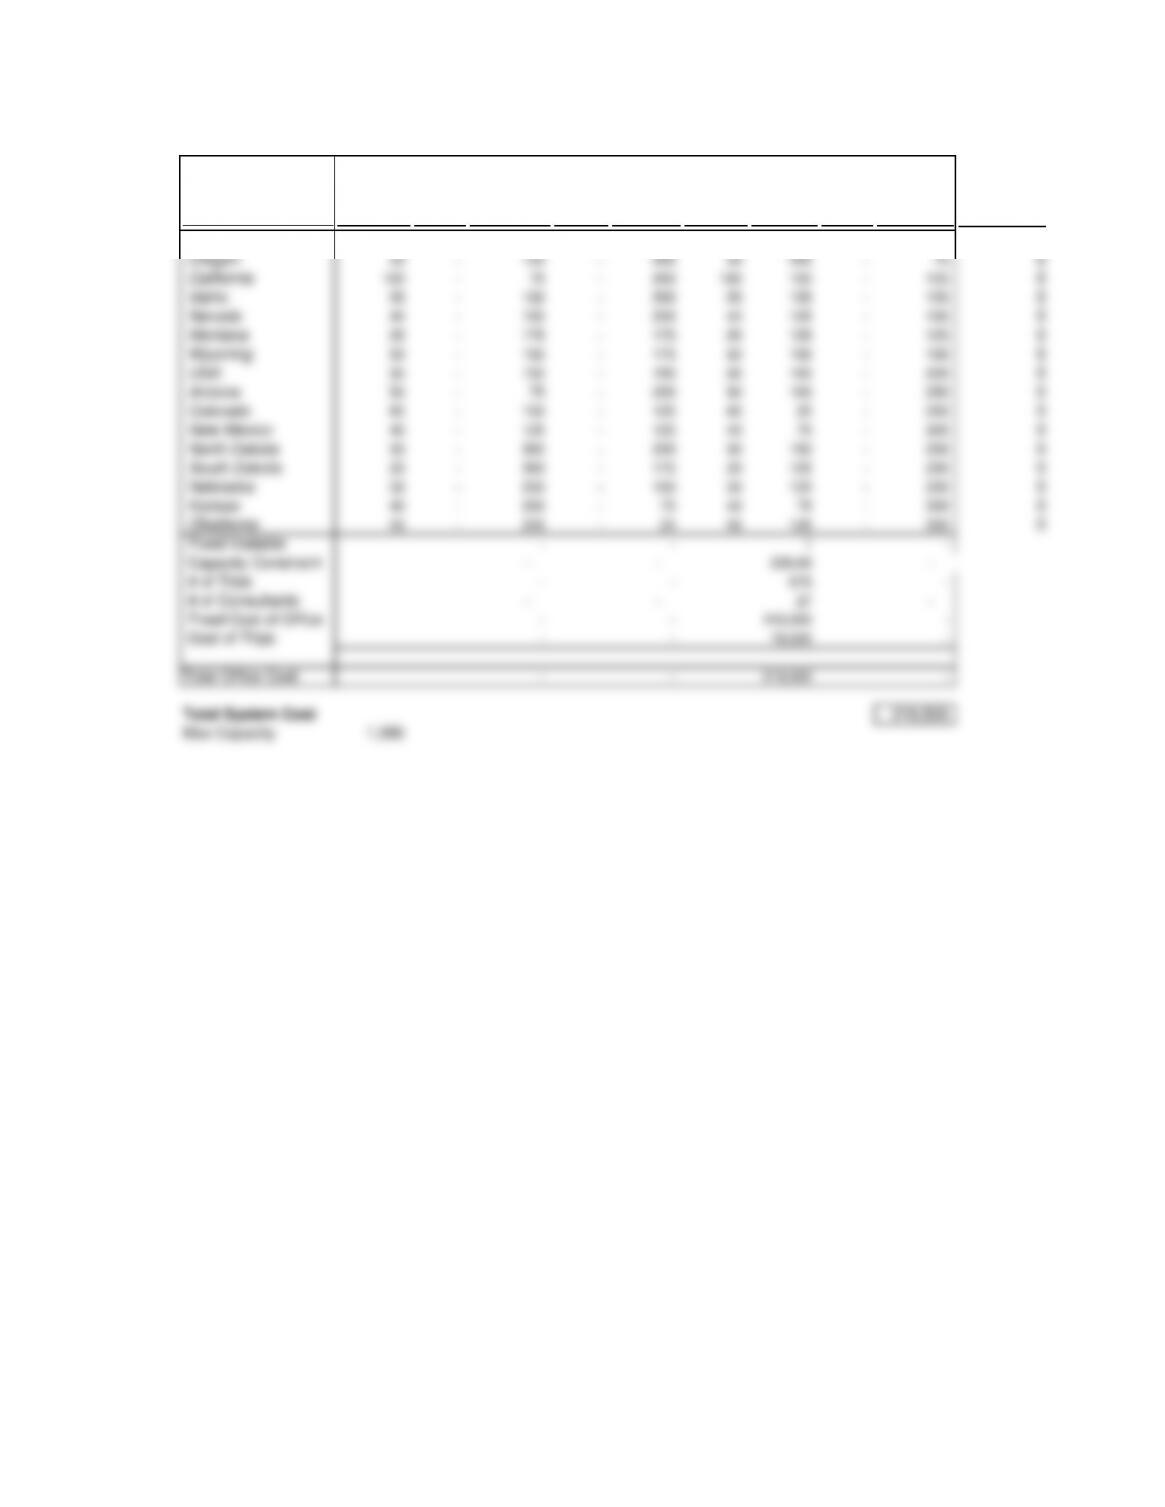
State
Total # of
trips
Trips
from LA
Cost from LA
Trips
from
Tulsa
Cost from
Tulsa
Trips
from
Denver
Cost from
Denver
Trips
from
Seattle
Cost from
Seattle
Demand
Constraints
Washington 40 – 150 – 250 40 200 – 25 0
Oregon 35 – 150 – 250 35 200 – 75 0
California 100 – 75 – 200 100 150 – 125 0
Idaho 25 – 150 – 200 25 125 – 125 0
Nevada 40 – 100 – 200 40 125 – 150 0
Montana 25 – 175 – 175 25 125 – 125 0
Wyoming 50 – 150 – 175 50 100 – 150 0
Utah 30 – 150 – 150 30 100 – 200 0
Arizona 50 – 75 – 200 50 100 – 250 0
Colorado 65 – 150 – 125 65 25 – 250 0
New Mexico 40 – 125 – 125 40 75 – 300 0
North Dakota 30 – 300 – 200 30 150 – 200 0
South Dakota 20 – 300 – 175 20 125 – 200 0
Nebraska 30 – 250 – 100 30 125 – 250 0
Kansas 40 – 250 – 75 40 75 – 300 0
Oklahoma 55 – 250 – 25 55 125 – 300 0
Fixed Variable – – 1 –
Capacity Constraint – – 325.00 –
# of Trips – – 675 –
# of Consultants – – 27 –
Fixed Cost of Office – – 140,000 –
Cost of Trips – – 79,500 –
Total Office Cost – – 219,500 –
Total System Cost 219,500
Max Capacity 1,000
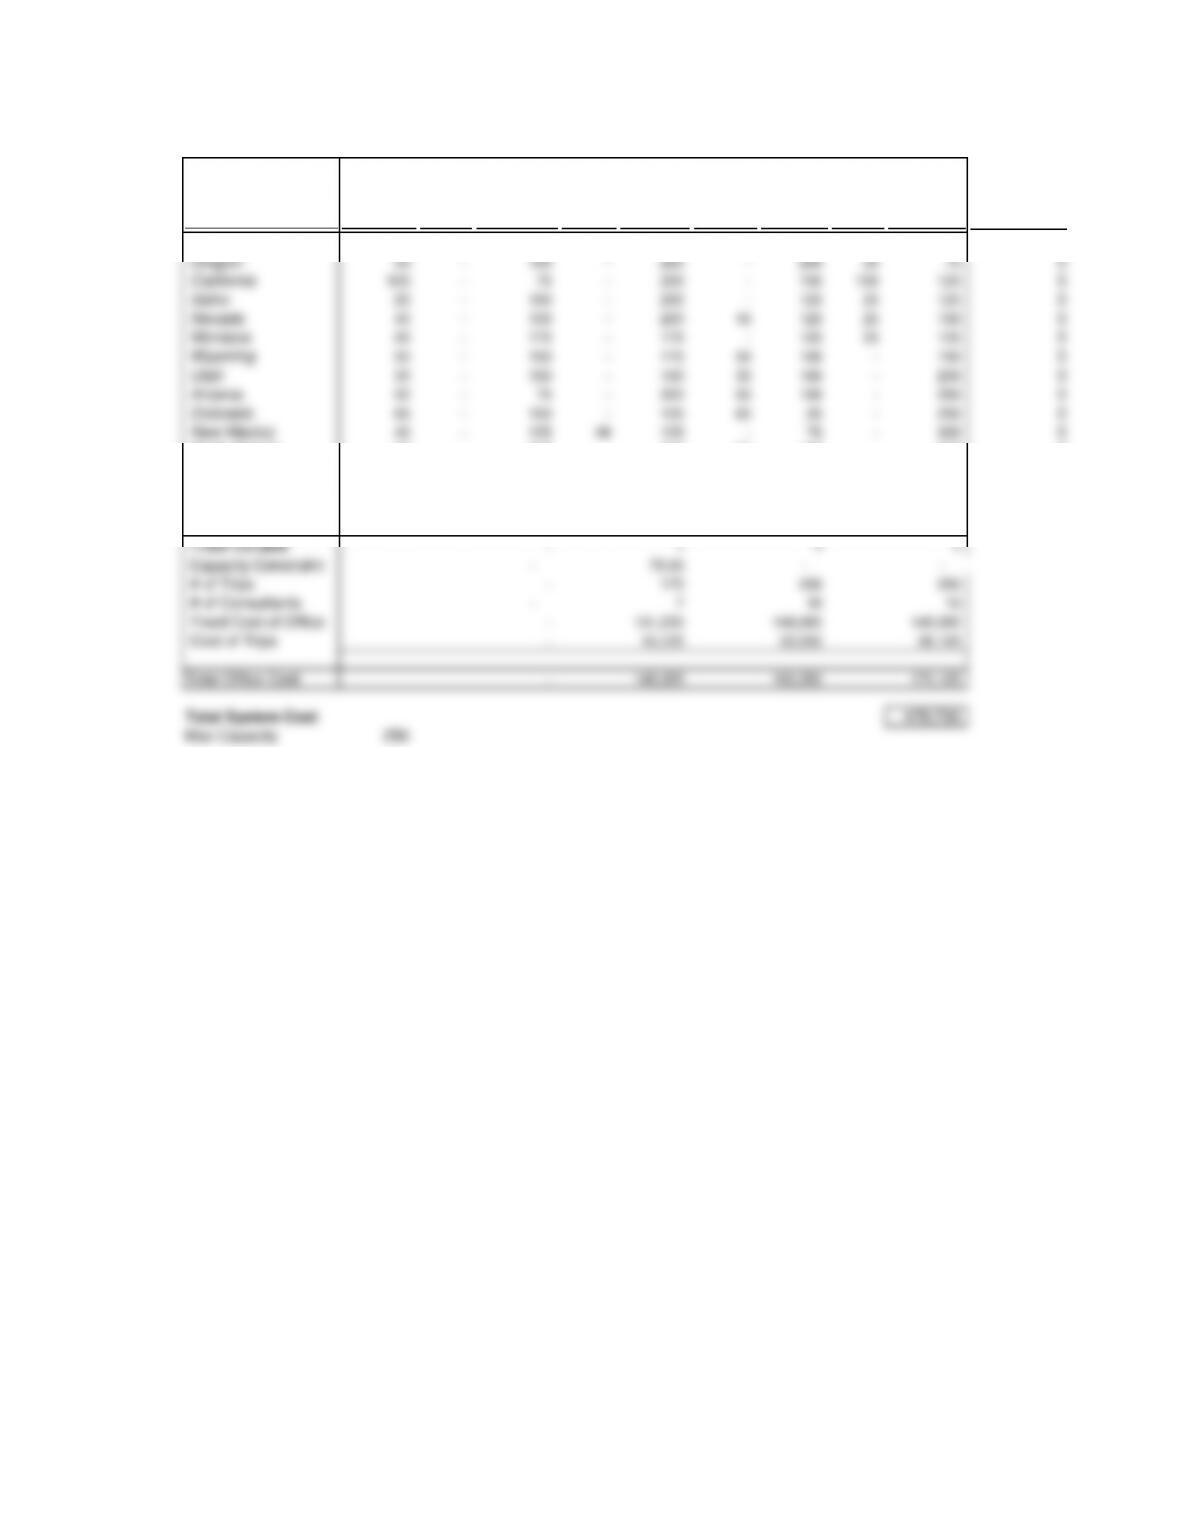
State
Total # of
trips
Trips
from LA
Cost from LA
Trips
from
Tulsa
Cost from
Tulsa
Trips
from
Denver
Cost from
Denver
Trips
from
Seattle
Cost from
Seattle
Demand
Constraints
Washington 40 – 150 – 250 – 200 40 25 0
Oregon 35 – 150 – 250 – 200 35 75 0
California 100 – 75 – 200 – 150 100 125 0
Idaho 25 – 150 – 200 – 125 25 125 0
Nevada 40 – 100 – 200 15 125 25 150 0
Montana 25 – 175 – 175 – 125 25 125 0
Wyoming 50 – 150 – 175 50 100 – 150 0
Utah 30 – 150 – 150 30 100 – 200 0
Arizona 50 – 75 – 200 50 100 – 250 0
Colorado 65 – 150 – 125 65 25 – 250 0
New Mexico 40 – 125 40 125 – 75 – 300 0
North Dakota 30 – 300 – 200 30 150 – 200 0
South Dakota 20 – 300 10 175 10 125 – 200 0
Nebraska 30 – 250 30 100 – 125 – 250 0
Kansas 40 – 250 40 75 – 75 – 300 0
Oklahoma 55 – 250 55 25 – 125 – 300 0
Fixed Variable – 1 1 1
Capacity Constraint – 75.00 – –
# of Trips – 175 250 250
# of Consultants – 7 10 10
Fixed Cost of Office – 131,230 140,000 145,000
Cost of Trips – 14,125 22,250 26,125
Total Office Cost – 145,355 162,250 171,125
Total System Cost 478,730
Max Capacity 250
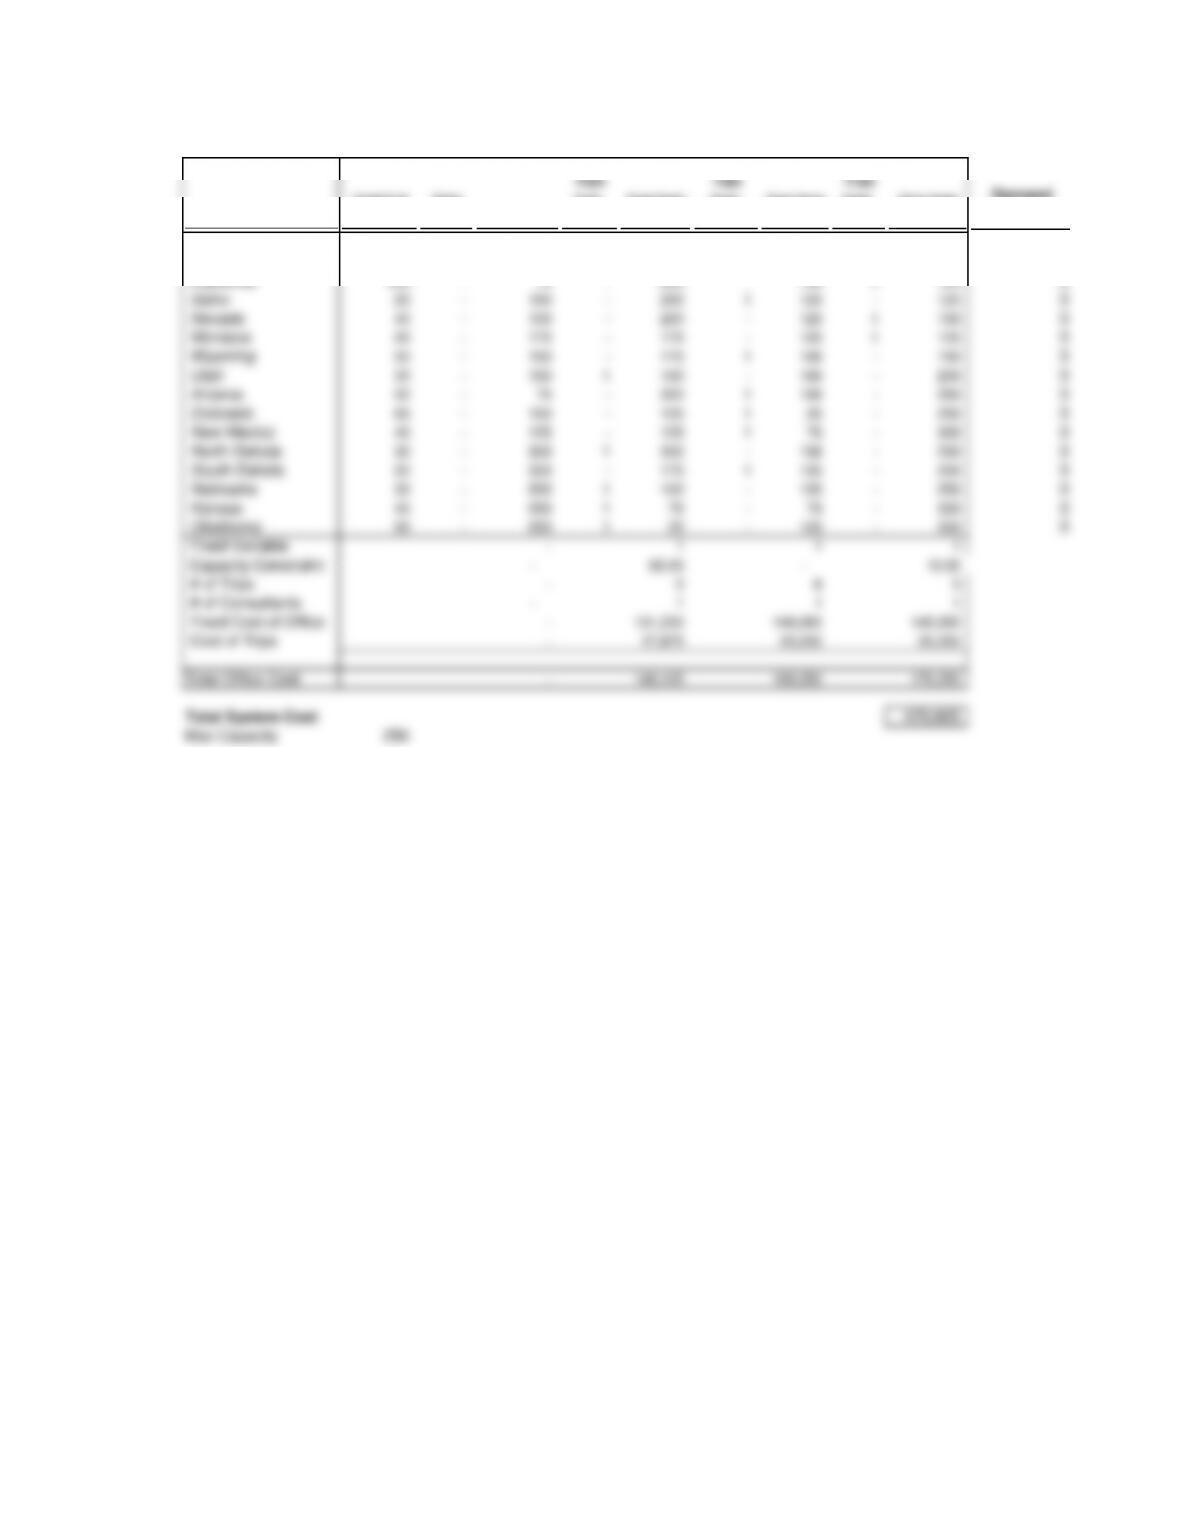
State
Total # of
trips
Trips
from LA
Cost from LA
Trips
from
Tulsa
Cost from
Tulsa
Trips
from
Denver
Cost from
Denver
Trips
from
Seattle
Cost from
Seattle
Demand
Constraints
Washington 40 – 150 – 250 – 200 1 25 0
Oregon 35 – 150 – 250 – 200 1 75 0
California 100 – 75 – 200 – 150 1 125 0
Idaho 25 – 150 – 200 1 125 – 125 0
Nevada 40 – 100 – 200 – 125 1 150 0
Montana 25 – 175 – 175 – 125 1 125 0
Wyoming 50 – 150 – 175 1 100 – 150 0
Utah 30 – 150 1 150 – 100 – 200 0
Arizona 50 – 75 – 200 1 100 – 250 0
Colorado 65 – 150 – 125 1 25 – 250 0
New Mexico 40 – 125 – 125 1 75 – 300 0
North Dakota 30 – 300 1 200 – 150 – 200 0
South Dakota 20 – 300 – 175 1 125 – 200 0
Nebraska 30 – 250 1 100 – 125 – 250 0
Kansas 40 – 250 1 75 – 75 – 300 0
Oklahoma 55 – 250 1 25 – 125 – 300 0
Fixed Variable – 1 1 1
Capacity Constraint – 65.00 – 10.00
# of Trips – 5 6 5
# of Consultants – 1 1 1
Fixed Cost of Office – 131,230 140,000 145,000
Cost of Trips – 17,875 20,250 25,250
Total Office Cost – 149,105 160,250 170,250
Total System Cost 479,605
Max Capacity 250