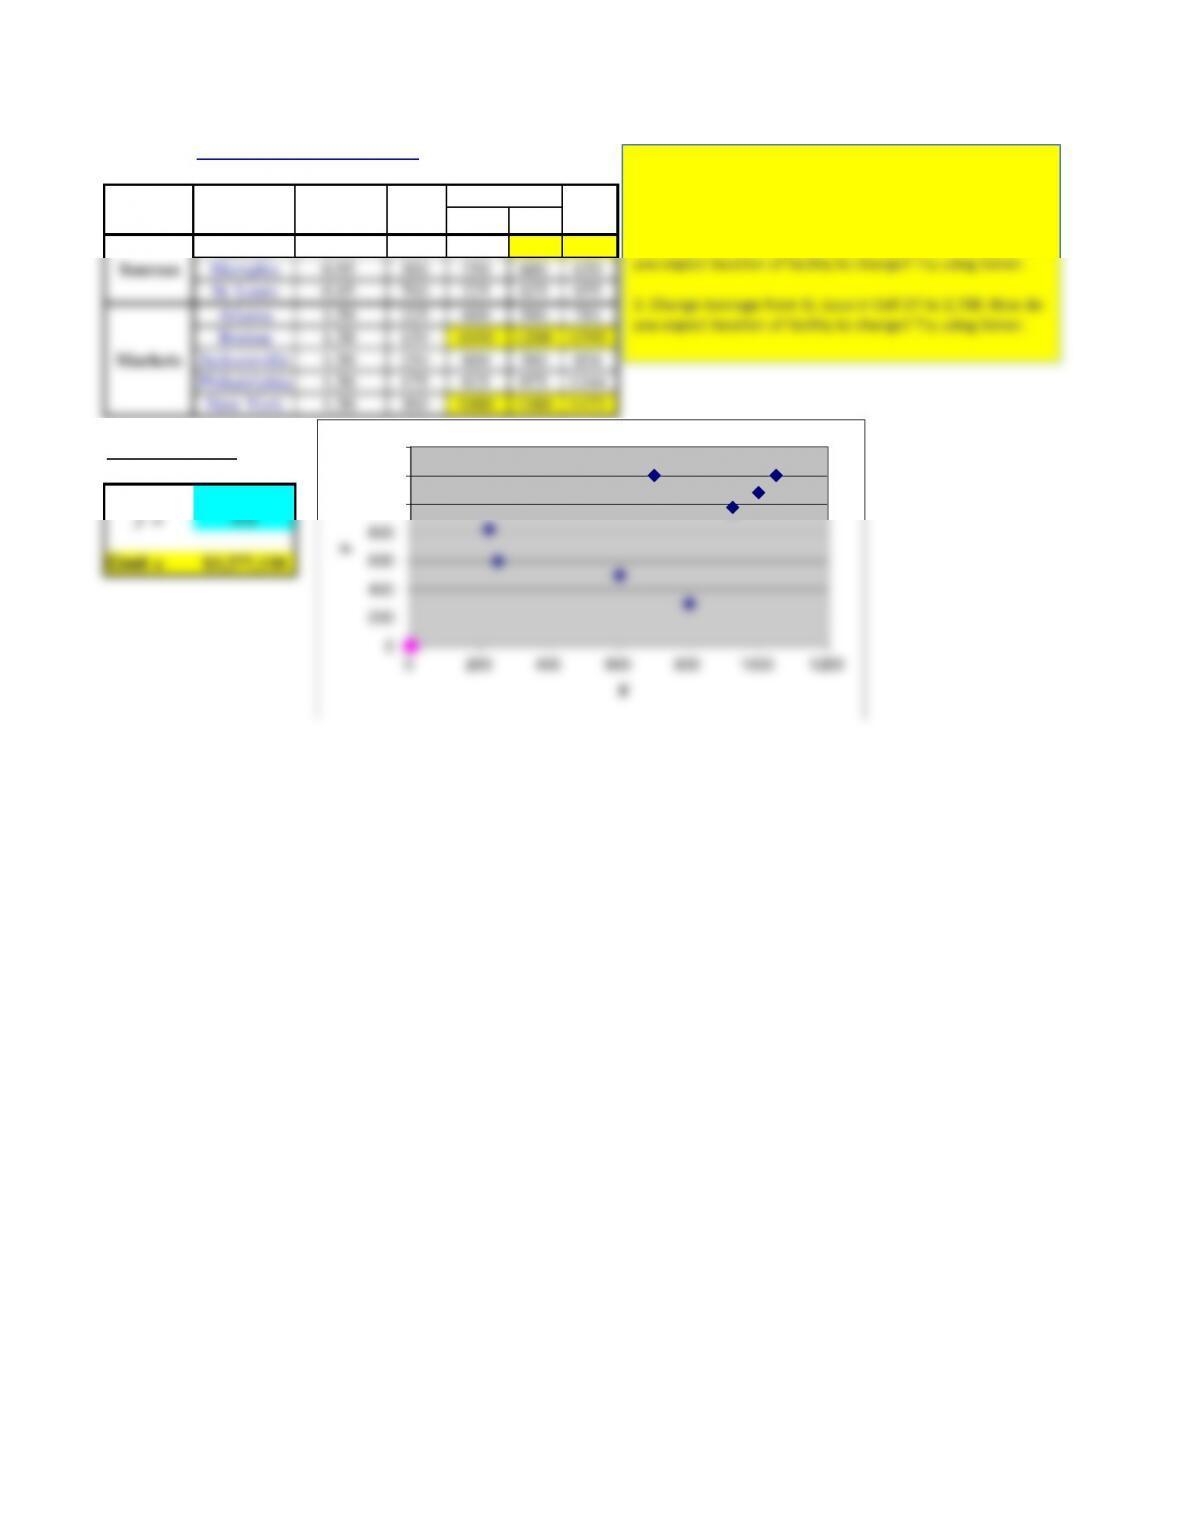
table11.2
Steel Appliances (Figure 5-8)
Sources/ $/Ton Mile Tons
Markets
FnDnxnyndn
Buffalo 0.90 500 700 1200 1389
Memphis 0.95 300 250 600 650
St. Louis 0.85 700 225 825 855
Atlanta 1.50 225 600 500 781
Boston 1.50 150 1050 1200 1595
Jacksonville 1.50 250 800 300 854
Philadelphia 1.50 175 925 975 1344
New York 1.50 300 1000 1080 1472
0 0
Facility Location
x = 0.0
y = 0.0
Cost = 3,277,110$
Coordinates
Sources
Markets
0
200
400
600
800
1000
1200
1400
0 200 400 600 800 1000 1200
Y
X
Using Solver to Optimize Location for Steel Appliances
1. Using Data | Analysis | Solver, solve the model to obtain
location of facility represented by pink dot in chart below.
2. Change tonnage from St. Lous in Cell D7 to 1,700. How do
you expect location of facility to change? Try using Solver.
3. Change tonnage from St. Lous in Cell D7 to 2,700. How do
you expect location of facility to change? Try using Solver.
Page 1