Tables 8-2, 8-3
Aggregate Planning (Chapter 8-9)
Demand Forecast
Month Demand Forecast
January 1,600
February 3,000
March 3,200
April 3,800
May 2,200
June 2,200
Costs
Item Cost
Materials cost/unit 10$
Inventory holding cost/unit/month 2$
Marginal cost of stockout/unit/month 5$
Hiring and training cost/worker 300$
Layoff cost/worker 500$
Labor hours required/unit 4
Regular time cost/hour 4$
Over time cost/hour 6$
Marginal subcontracting cost/unit 30$
Page 1
Planning
Aggregate Plan Decision Variables Constraints
HtLtWtOtItStCtPt
Period # Hired # Laid off # Workforce Overtime Inventory Stockout Subcontract Production Demand Price Workforce Capacity Inventory Over time
0 0 0 80 0 1,000 0 0
1 0 16 64 0 1,960 0 0 2,560 1,600 40 0 0 0 640
2 0 0 64 0 1,520 0 0 2,560 3,000 40 0 0 0 640
3 0 0 64 0880 0 0 2,560 3,200 40 0 0 0 640
4 0 0 64 0 0 220 140 2,560 3,800 40 0 0 0 640
5 0 0 64 0140 0 0 2,560 2,200 40 0 0 0 640
6 0 0 64 0500 0 0 2,560 2,200 40 0 0 0 640
Total Cost = 422,660$
Base Price 40$
Total Revenue = 640,000$ Promote? (0/1) 0 Consumption 0.10
Profit = 217,340$ Month (1/4) 4 Forward buy 0.20
Chapter 8
Set Cell E24 to 0 (there is no promotion)
1. To get Table 8-4, run Solver as is.
2. To get Table 8–6, change Cells B6-B11 in sheet
Tables 8-2, 8-3 to be as shown in Table 8-5 and
then run Solver.
3. To get Table 8-7, return Cells B6-B11 to as they
are in Table 8-2 and change Cells B19 and B20 in
worksheet Tables 8-2, 8-3 to 50 each.
Chapter 9
1. To get Figure 9-1, set Cell E24 to 0 and run Solver.
2. To get Figure 9-2, set Cell E24 to 1 (promotion on) and Cell E25 to 1
(January promotion), H24 to 0.1, H25 to 0.2 and run Solver.
3. To get Figure 9-3, set Cell E24 to 1 (promotion on) and Cell E25 to 4
(April promotion), H24 to 0.1, H25 to 0.2 and run Solver.
4. To get Figure 9-4, set Cell E24 to 1 (promotion on) and Cell E25 to 1
(January promotion), H24 to 1.0, H25 to 0.2 and run Solver.
5. To get Figure 9-5, set Cell E24 to 1 (promotion on) and Cell E25 to 1
(April promotion), H24 to 1.0, H25 to 0.2 and run Solver.
0
500
1,000
1,500
2,000
2,500
3,000
3,500
4,000
1 2 3 4 5 6
Period
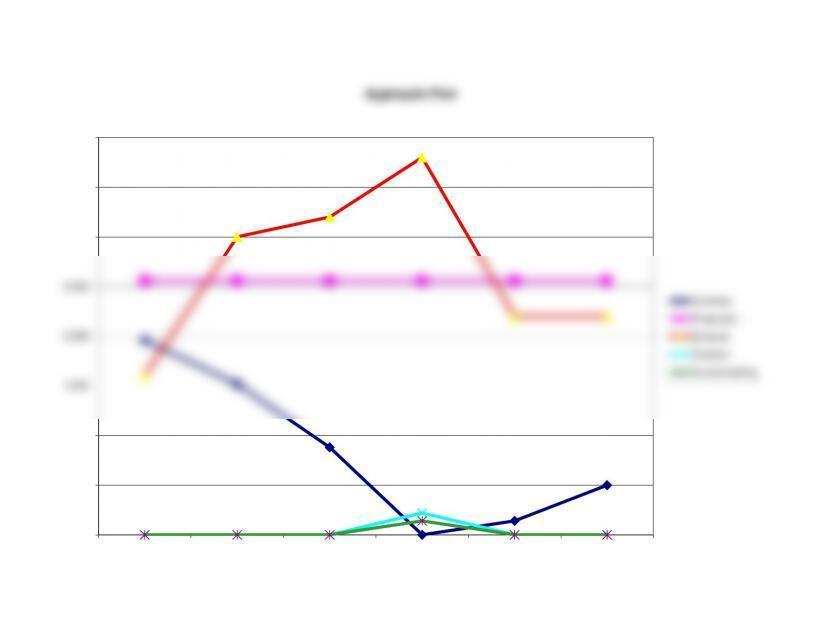
Aggregate Plan
Inventory
Production
Demand
Stockout
Subcontracting
Sheet2
Aggregate Plan
Period # Hired # Laid off # Workforce Overtime Inventory Stockout Subcontract Production Demand
0 0 0 80 1000 0 0
1 0 18 62 01880 0 0 2480 1,600
2 0 0 62 01360 0 0 2480 3,000
3 0 0 62 620 795 0 0 2635 3,200
4 0 0 62 620 0370 02635 3,800
5 0 0 62 620 65 0 0 2635 2,200
6 0 0 62 620 500 0 0 2635 2,200
Aggregate Plan Costs
Period Hiring Lay off Regular Time Overtime Inventory Stockout Subcontract
1 0 9000 39680 03760 0 0
2 0 0 39680 02720 0 0
3 0 0 39680 01590 0 0
4 0 0 39680 0 0 1850 0
5 0 0 39680 0130 0 0
6 0 0 39680 01000 0 0
Total Cost = 258130
Sheet3
Aggregate Plan Decision Variables
Constraints
Period # Hired # Laid off # Workforce Overtime Inventory Stockout Subcontract Production Demand Workforce Production Inventory Overtime
0 0 0 80 0 1,000 0 0
1 0 29 51 0 1,450 0 0 2,050 1,600 0 0 0 513
2 0 0 51 0500 0 0 2,050 3,000 0 0 0 513
316 068 0 0 0 0 2,700 3,200 0 0 0 675
4 0 0 68 0 0 500 600 2,700 3,800 0 0 0 675
5 0 0 68 0 0 0 0 2,700 2,200 0 0 0 675
6 0 0 68 0500 0 0 2,700 2,200 0 0 0 675
Aggregate Plan Costs
Period Hiring Lay off
Regular Time
Overtime Inventory Stockout Subcontract Material
1 0 14,375 32,800 0 2,900 0 0 20,500
2 0 0 32,800 0 1,000 0 0 20,500
3 0 0 43,200 0 0 0 0 27,000
4 0 0 43,200 0 0 2,500 18,000 27,000
5 0 0 43,200 0 0 0 0 27,000
6 0 0 43,200 0 1,000 0 0 27,000
Total Cost = 427,175$
Total Revenue = 496,000$