To Savor or to Groupon?
Input
Mean demand, µ = 60
Standard Deviation of Demand,
s
= 30
Average spend per table = 60$
Revenue from Groupon per table = 15$
Marginal cost per table = 10.00$
Cost per unused table, c = –$
Margin per table used by regular customers, p = 50.00$
Salvage Value per unused table, s = –$
Cost per empty table, Co = –$
Cost per regular customer turned away, Cu = 50.00$
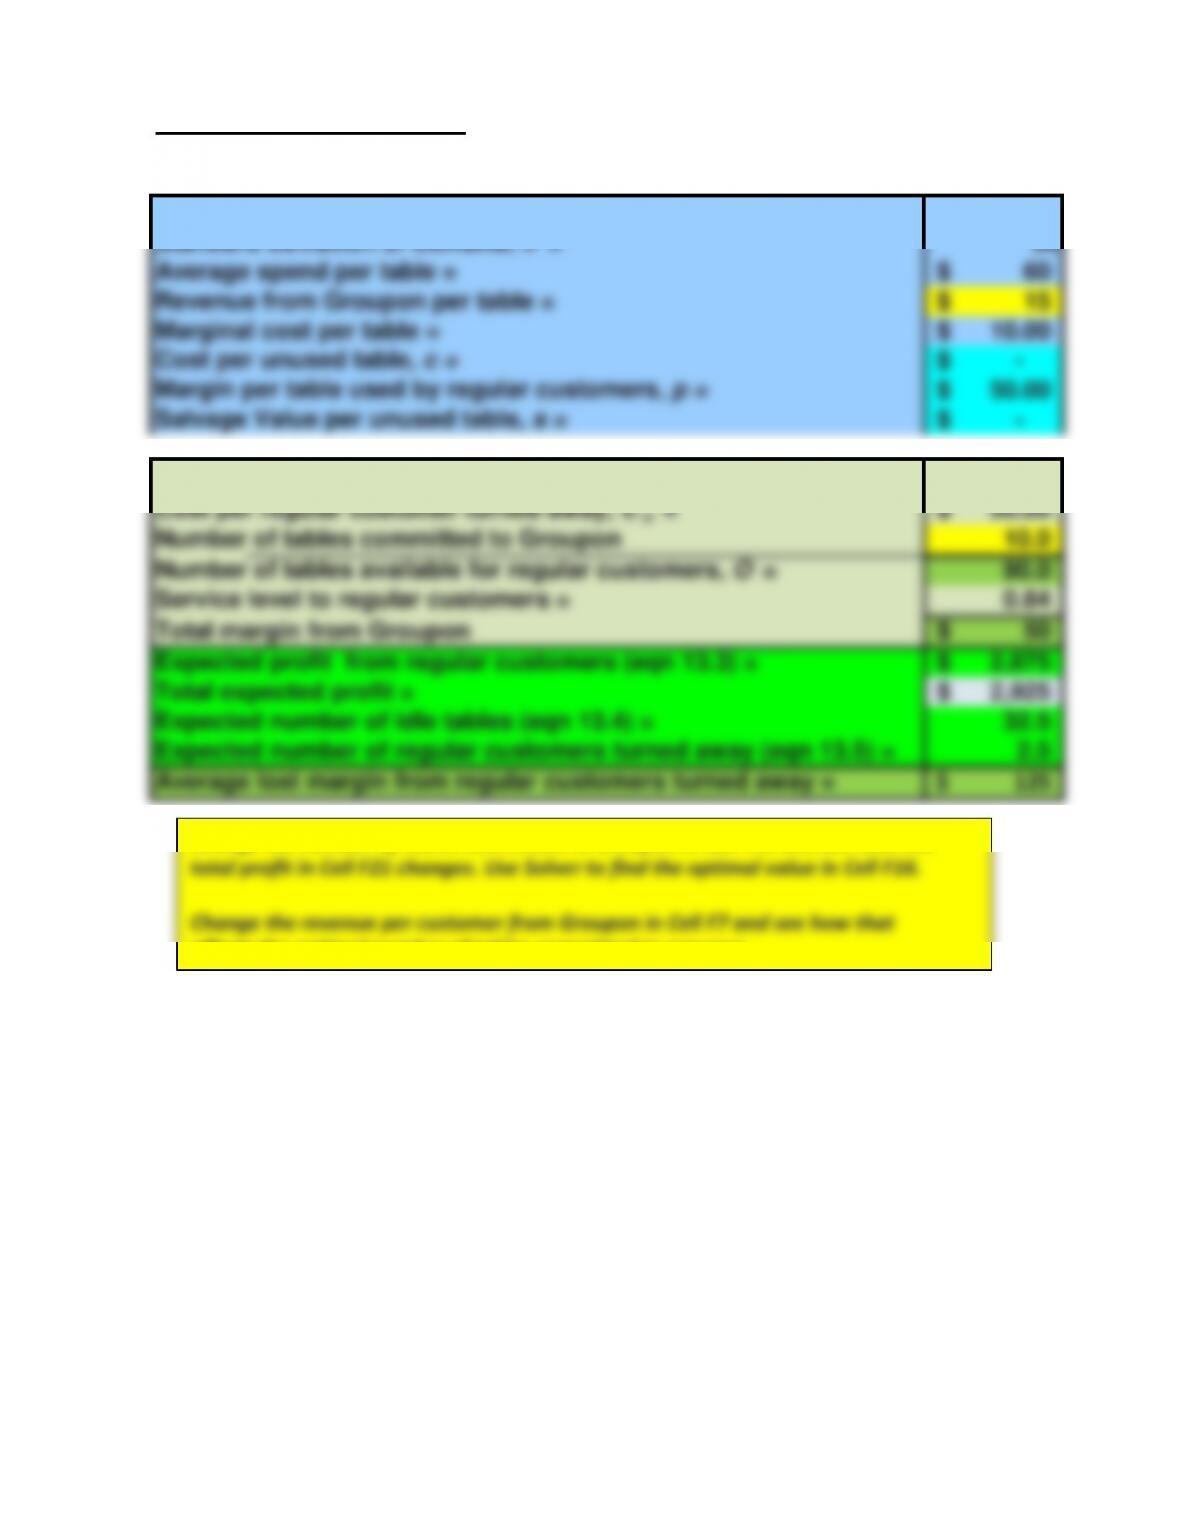
Number of tables committed to Groupon 10.0
Number of tables available for regular customers, O = 90.0
Service level to regular customers = 0.84
Total margin from Groupon 50$
Expected profit from regular customers (eqn 13.3) = 2,875$
Total expected profit = 2,925$
Expected number of idle tables (eqn 13.4) = 32.5
Expected number of regular customers turned away (eqn 13.5) = 2.5
Average lost margin from regular customers turned away = 125$
Change the number of tables committed to Groupon in Cell F16 and see how the
total profit in Cell F21 changes. Use Solver to find the optimal value in Cell F16.
Change the revenue per customer from Groupon in Cell F7 and see how that
affects the optimal number of tables committed to groupon.
To Savor or to Groupon?
Input
Mean demand, µ = 60
Standard Deviation of Demand,
s
= 30
Average spend per table = 60$
Revenue from Savored per table = 15$
Marginal cost per table = 10.00$
Cost per unused table, c = –$
Margin per table used by regular customers, p = 50.00$
Salvage Value per unused table, s = –$
Cost per empty table, Co = –$
Cost per regular customer turned away, Cu = 50.00$
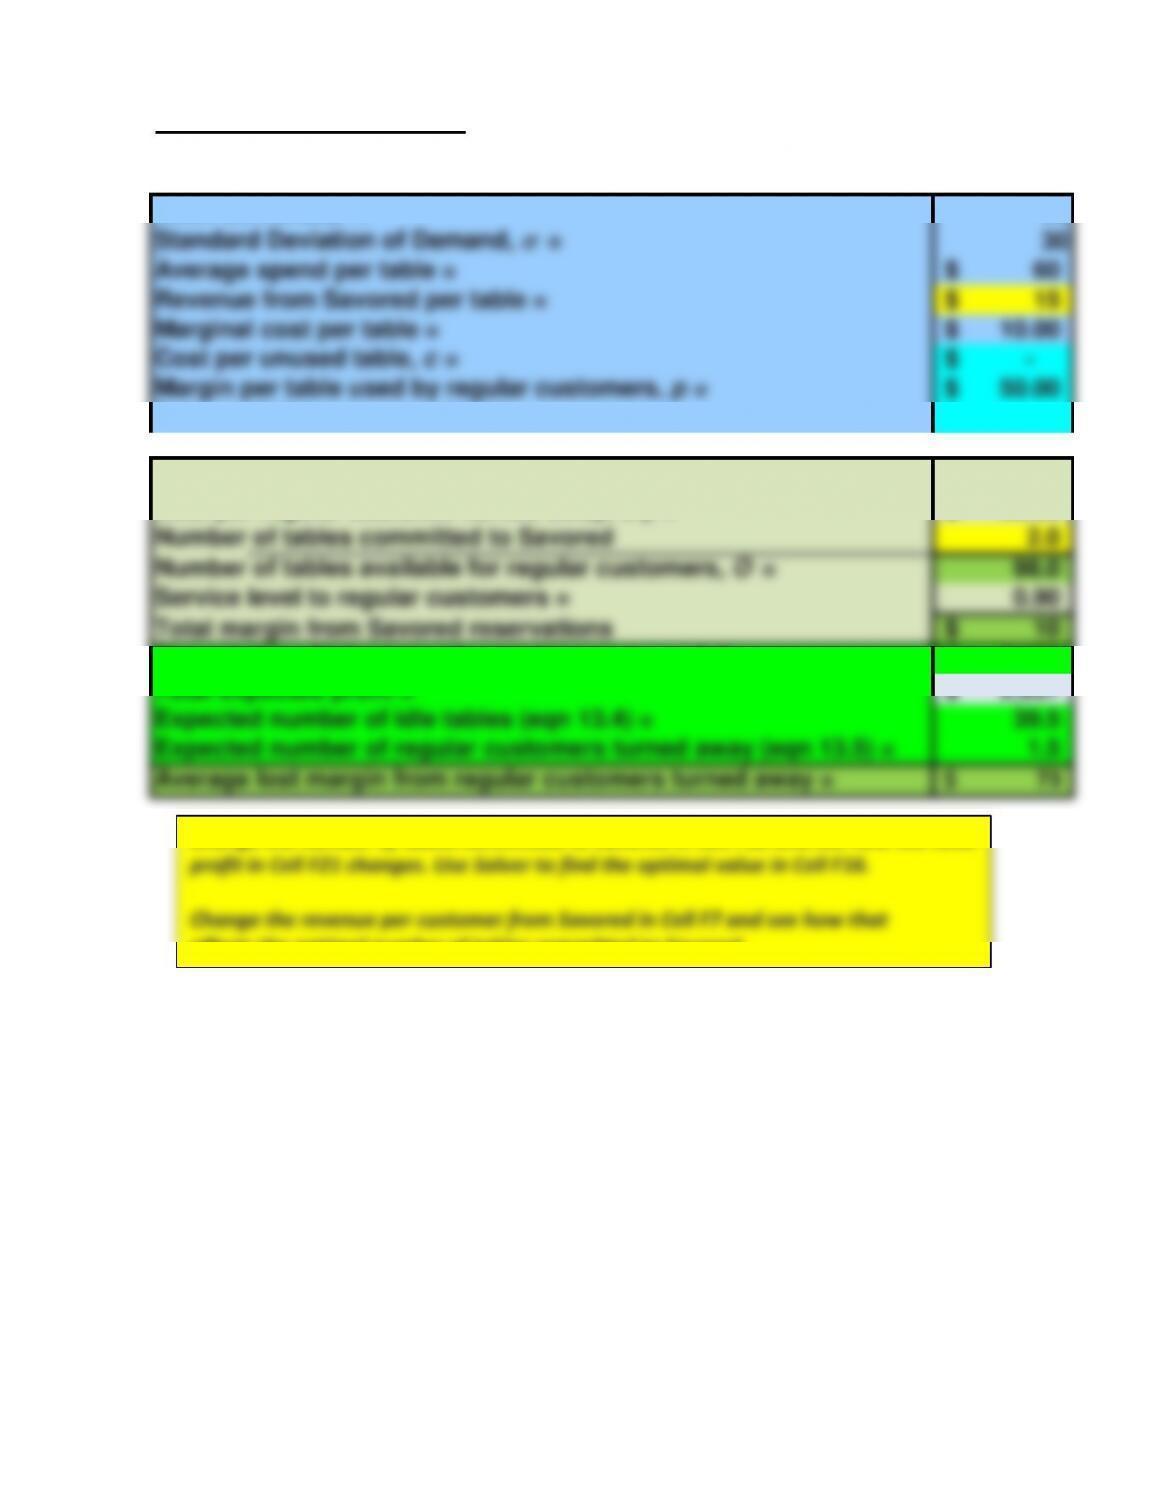
Number of tables committed to Savored 2.0
Number of tables available for regular customers, O = 98.0
Service level to regular customers = 0.90
Total margin from Savored reservations 10$
Expected profit from regular customers (eqn 13.3) = 2,927$
Total expected profit = 2,937$
Expected number of idle tables (eqn 13.4) = 39.5
Expected number of regular customers turned away (eqn 13.5) = 1.5
Average lost margin from regular customers turned away = 73$
Change the number of tables committed to Savored in Cell F16 and see how the total
profit in Cell F21 changes. Use Solver to find the optimal value in Cell F16.
Change the revenue per customer from Savored in Cell F7 and see how that
affects the optimal number of tables committed to Savored.