d.) Net profit = total revenue total costs
I. Demand Estimates, The Marketing Budget, and Marketing Performance
Measures
A. Market Potential and Sales Estimates
1. While determining sales needed to break even or attain various
profit goals is useful, companies need more information regarding
demand in order to assess the feasibility of attaining the needed
sales levels.
2. Total market demand for a product or service is the total volume
that would be bought by a defined consumer group in a defined
geographic area in a defined time period in a defined marketing
environment under a defined level of mix of industry marketing
effort.
3. The upper limit of market demand is called market potential.
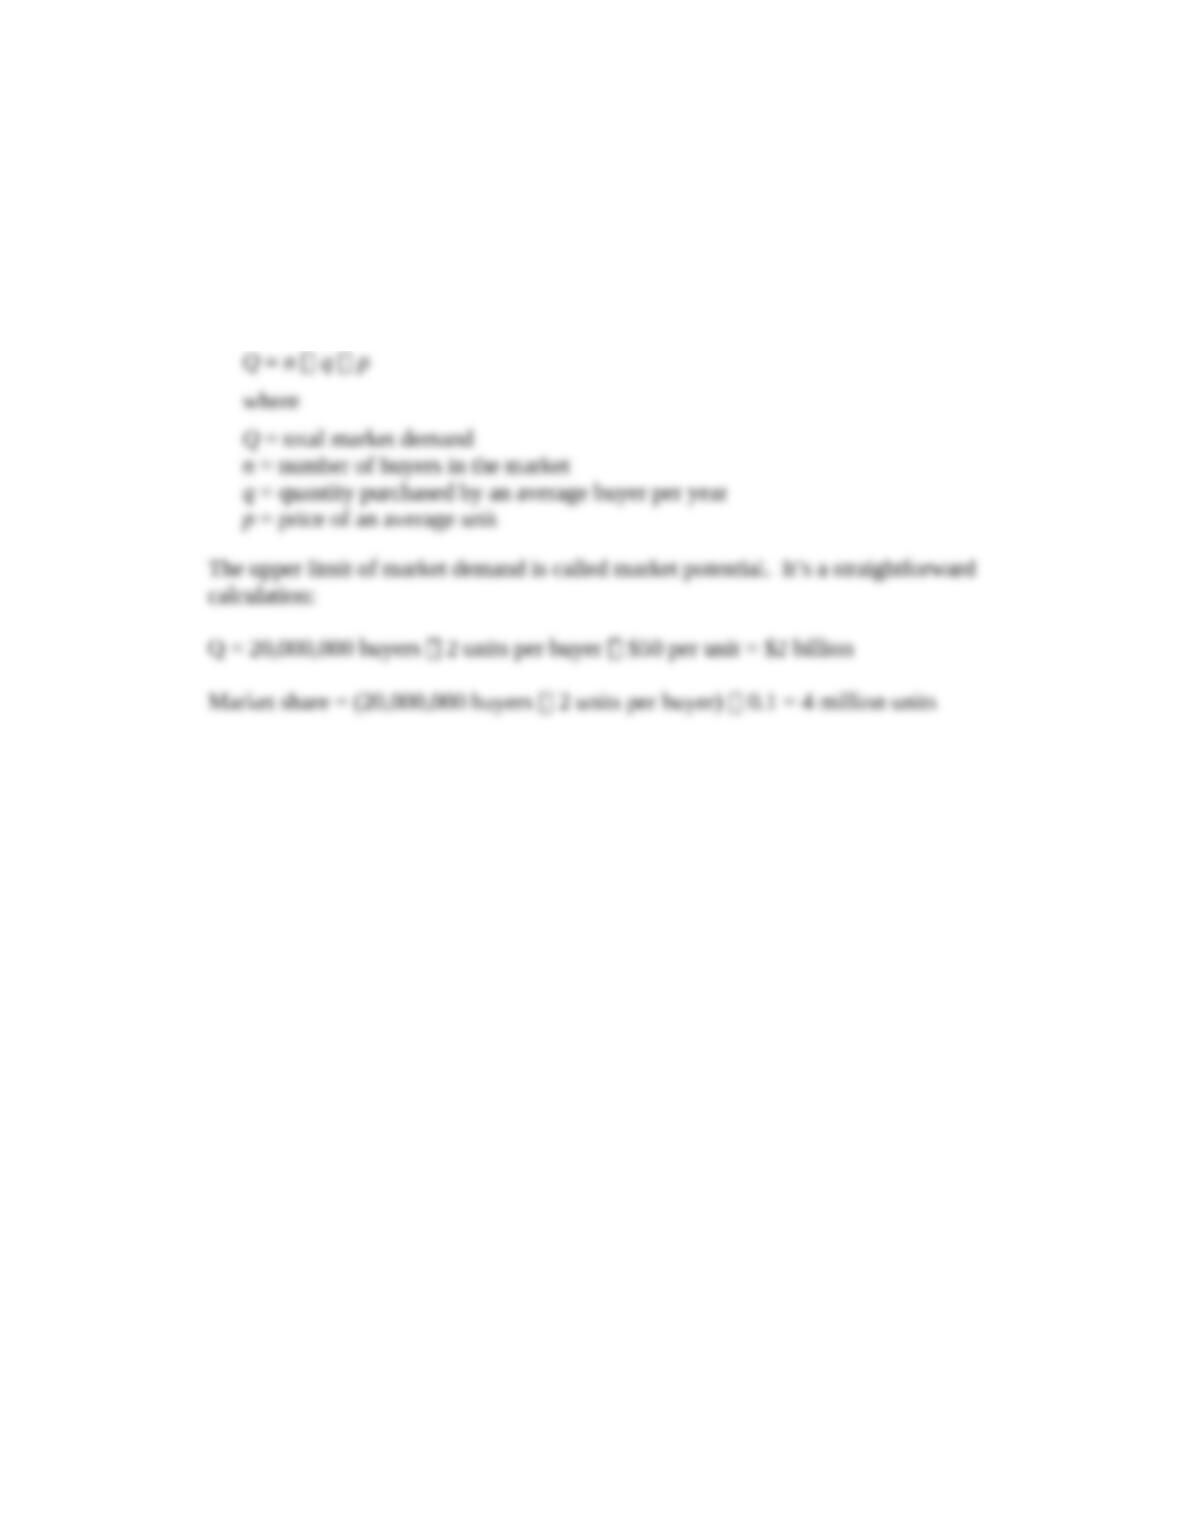
4. One practical method for estimating total market demand uses
three variables:
a) number of prospective buyers
b) quantity purchased by an average buyer per year
c) price of an average unit
d) Market demand can be determined as follows:
Copyright © 2015 Pearson Education, Inc.
A3-1
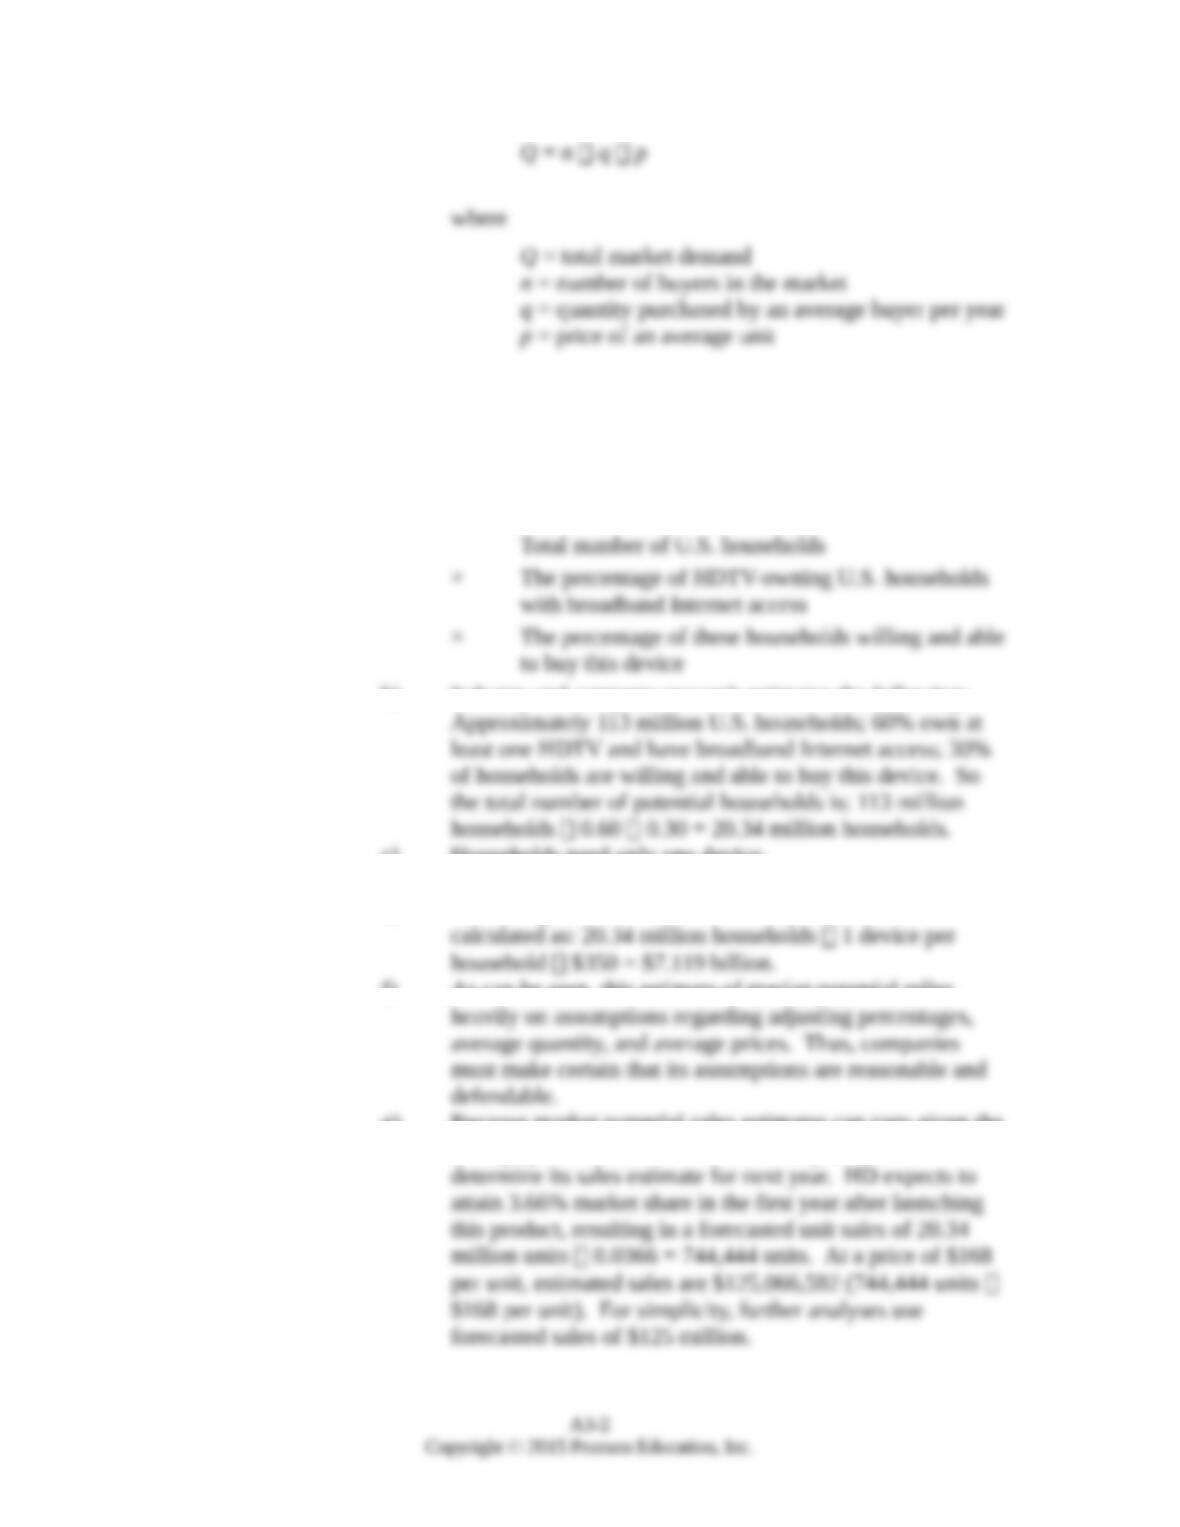
5. A variation of this approach is the chain ratio method, which
involves multiplying a base number by a chain of adjusting
percentages.
a) HD can estimate U.S. demand using a chain of calculations
like the following:
b) Industry and company research estimates the following:
c) Households need only one device.
d) Average retail price across all brands is $350.
e) Estimating total market demand for product can be
f) As can be seen, this estimate of market potential relies
g) Because market potential sales estimates can vary given the
average price used, HD uses unit sales potential to
B. The Profit-and-Loss Statement and Marketing Budget
1. A pro forma (or projected) profit-and-loss statement (also called
an income statement or operating statement) shows projected
revenues less budgeted expenses and estimates the projected net
profit for an organization, product, or brand during a specific
planning period, typically a year.
2. A profit-and-loss statement typically consists of several major
components (see Table and Spreadsheet A3.1 at the end of this
material):
Use Table A3.1 and Spreadsheet A3.1 here.
a) Net sales–gross sales revenue minus returns and allowances
(e.g., trade, cash, quantity, and promotion allowances).
HD’s net sales for 2013 are estimated to be $125 million, as
determined in the previous analysis.
b) Cost of goods sold (sometimes called cost of sales)–the
actual cost of the merchandise sold by a manufacturer or
reseller and includes the cost of inventory, purchases, and
other costs associated with making the goods. For HD, it is
estimated to be 50% of net sales, or $62.5 million.
c) Gross margin (or gross profit)–the difference between net
sales and cost of goods sold. For HD, it is estimated to be
$62.5 million ($125 million $62.5 million).
d) Operating expenses–the expenses incurred while doing
business and include all other expenses beyond the cost of
goods sold. In the HD example, expenses are presented as
marketing expenses and general and administrative
expenses:
(1) Marketing expenses include sales expenses,
promotion expenses, and distribution expenses.
(a) Sales expenses include $5 million for sales
(b) Promotion expenses include $10 million
budgeted for advertising and promotion
Copyright © 2015 Pearson Education, Inc.
A3-3
(c) Distribution expenses include freight and
(d) Total marketing expenses are estimated to be
(2) General and administrative expenses are estimated
e) Net profit before taxes–profit earned after all costs are
3. Table A3.1 (and Table A3.2) also indicates the percentage of sales
that each component of the profit-and-loss statement represents.
These percentages are determined by dividing the cost figure by
net sales.
C. Marketing Performance Measures
1. Whereas the pro forma profit-and-loss statement shows projected
financial performance, the statement given in Table A3.2 shows
HD’s actual financial performance based on actual sales, cost of
goods sold, and expenses during the past year.
Use Table A3.2 and Spreadsheet A3.2 here.
2. Why did HD lose $1 million rather than make the $12.5 million
projected profit?
a) Net sales were only $100 million, which is $25 million
b) Cost of goods sold as a percentage of sales exceeded
c) Allocated indirect overhead was $5 million rather than the
3. At what level of sales would HD have broken even?
a) Contribution margin was 21% rather than the estimated
b) Break-even sales can be calculated:
Copyright © 2015 Pearson Education, Inc.
A3-4
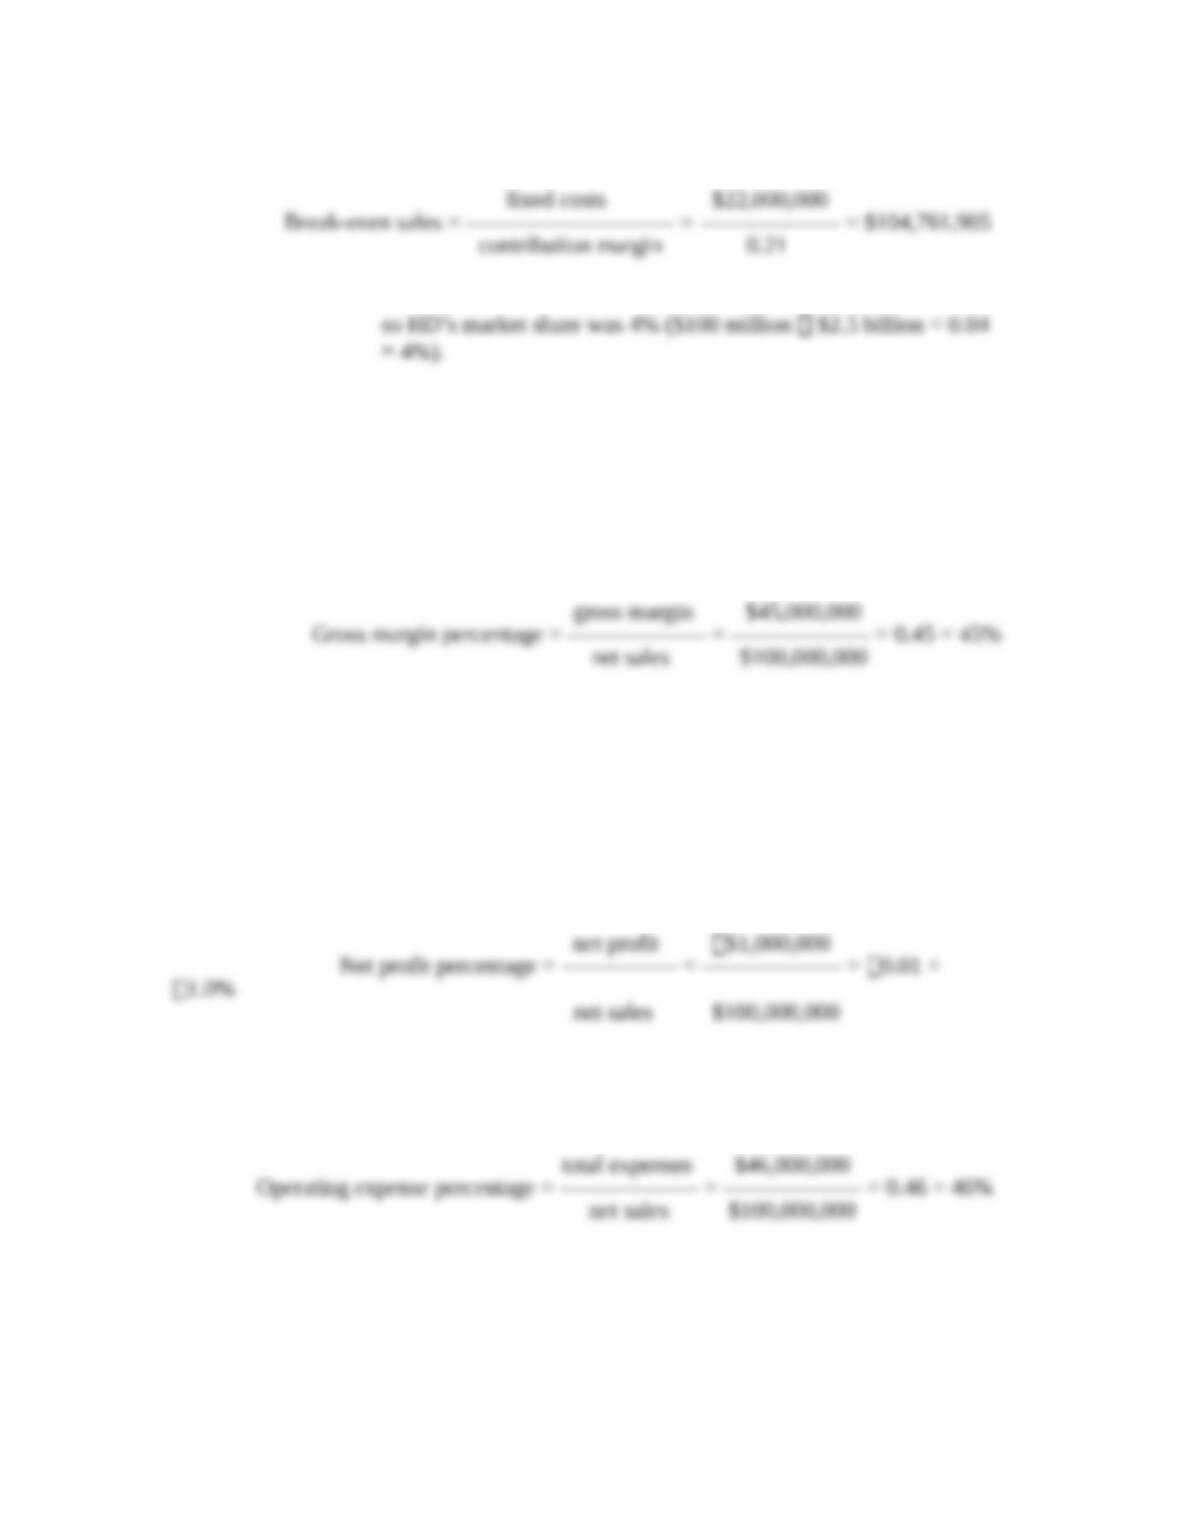
4. Industry sales fell short of forecasted sales and were $2.5 billion,
5. Analytic Ratios
a) Operating ratios are the ratios of selected operating
statement items to net sales.
b) Gross margin percentage indicates the percentage of net
sales remaining after cost of goods sold that can contribute
to operating expenses and net profit before taxes.
(1) For HD:
(2) If there was previous history for this product and
this ratio was declining, management should
examine it more closely to determine why it has
decreased (i.e., decrease in sales volume or price, an
increase in costs, or a combination of these).
c) Net profit percentage shows the percentage of each sales
dollar going to profit.
(1) For HD:
d) Operating expense percentage indicates the portion of net
sales going to operating expenses.
(1) For HD:
e) Inventory turnover rate (also called stockturn rate for
resellers) is the number of times an inventory turns over or
is sold during a specified time period (often one year).
Copyright © 2015 Pearson Education, Inc.
A3-5
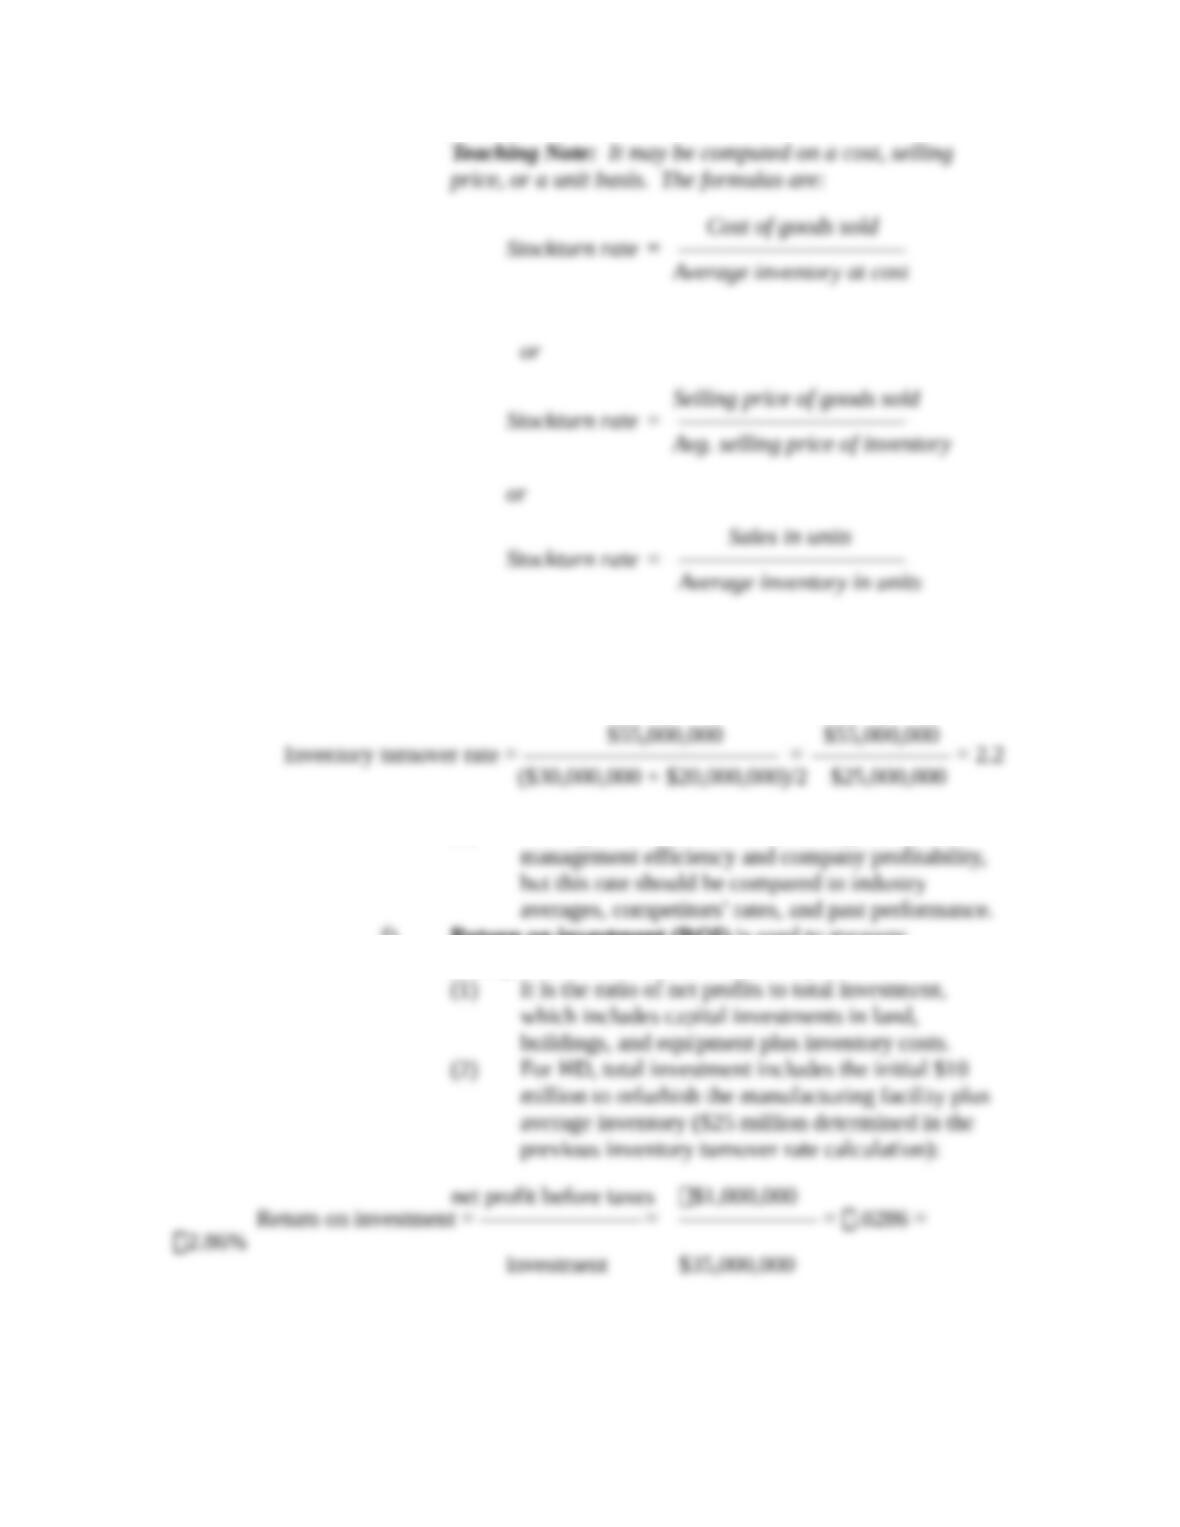
(1) Assuming HD’s beginning and ending inventories
were $30 million and $20 million, respectively, the
inventory turnover rate computed on a cost basis is:
(2) The higher the turnover rate, the higher the
f) Return on investment (ROI) is used to measure
managerial effectiveness and efficiency.
6. Marketing Profitability Metrics
Copyright © 2015 Pearson Education, Inc.
A3-6
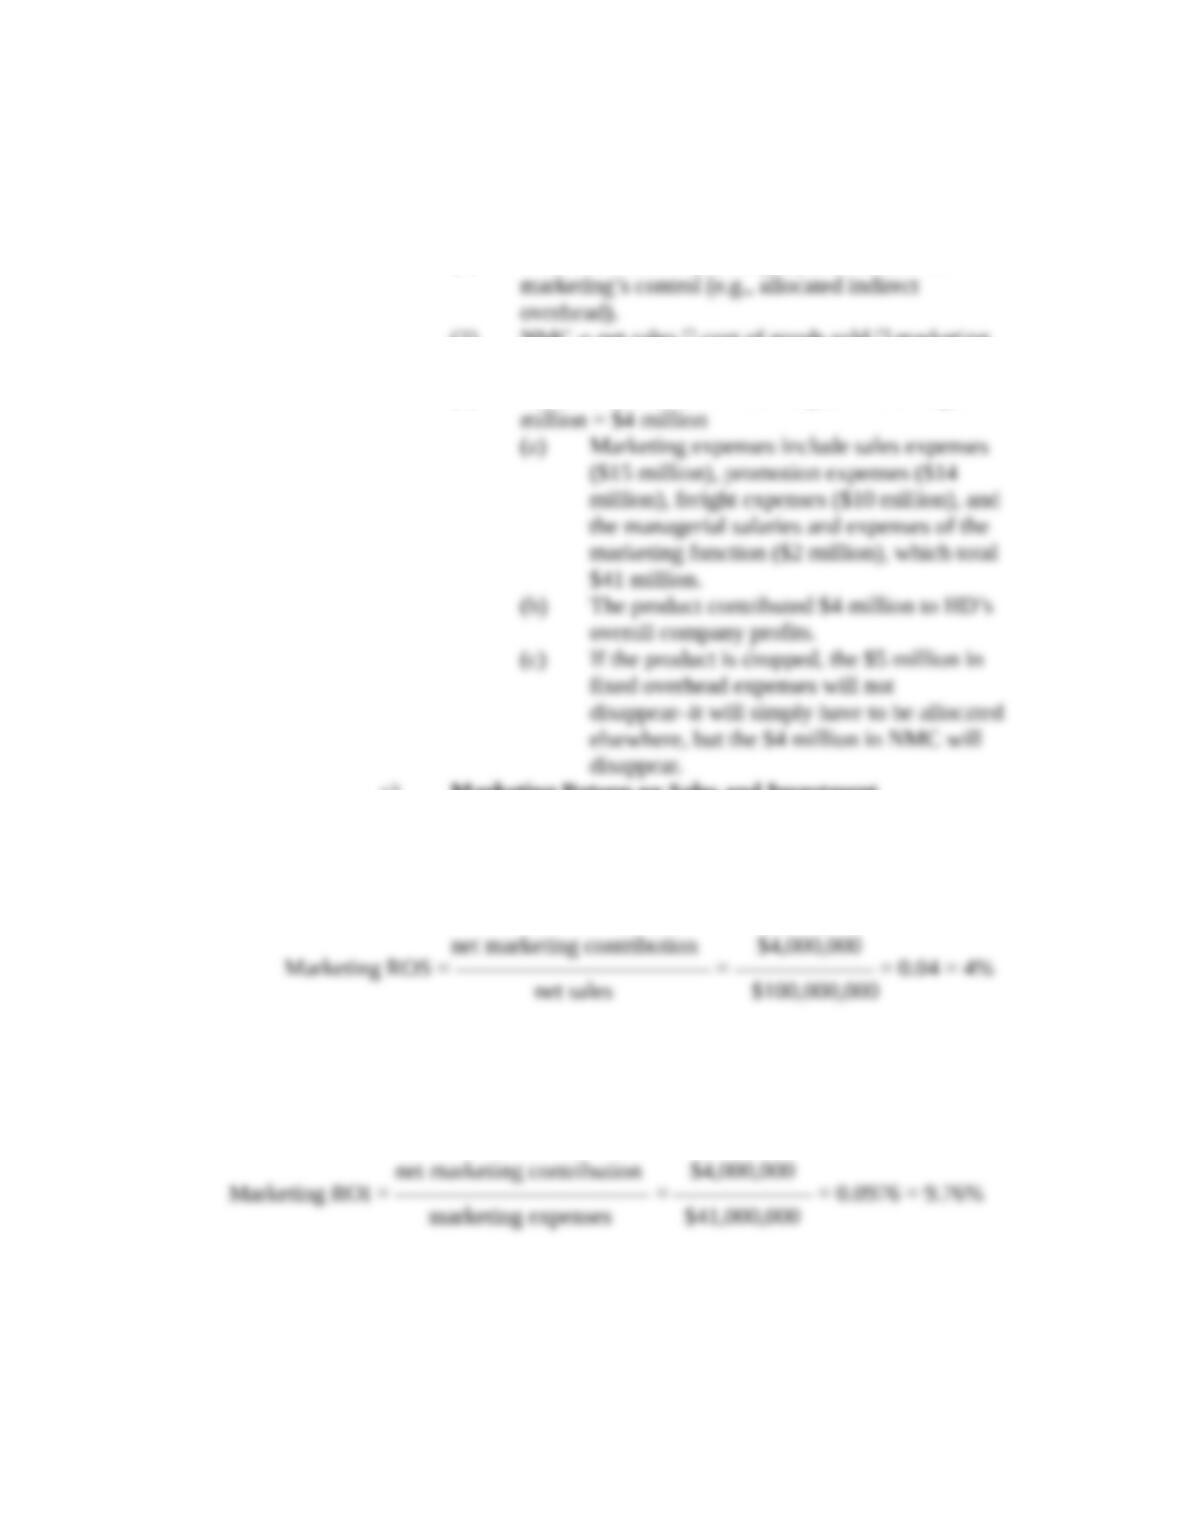
a) If HD drops this product, the profits of the total
organization will decrease by $4 million!
b) Net Marketing Contribution (NMC). Measures
marketing profitability.
(1) Does not include operating expenses not under
(2) NMC = net sales cost of goods sold marketing
expenses
(3) For HD, NMC = $100 million $55 million $41
c) Marketing Return on Sales and Investment
(1) Marketing return on sales (ROS) shows the net
sales attributable to the net marketing contribution.
(a) For HD:
(2) Marketing ROI measures the marketing
productivity of a marketing investment.
(a) For HD:
(b) Marketing ROI could be greater than 100%,
which can be achieved by attaining a higher
net marketing contribution and/or a lower
total marketing expense.
Copyright © 2015 Pearson Education, Inc.
A3-7
Copyright © 2015 Pearson Education, Inc.
A3-8
D. Marketing by the Numbers Exercise Set Two
2.1. Determine the market potential for a product that has 20 million prospective
buyers who purchase an average of 2 per year and price averages $50. How many
units must a company sell if it desires a 10% share of this market?
Answer:
2.2. Develop a profit-and-loss statement for the Westgate division of North Industries.
This division manufactures light fixtures sold to consumers through home
improvement and hardware stores. Cost of goods sold represents 40% of net
sales. Marketing expenses include selling expenses, promotion expenses, and
freight. Selling expenses include sales salaries totaling $3 million per year and
sales commissions (5% of sales). The company spent $3 million on advertising
last year, and freight costs were 10% of sales. Other costs include $2 million for
managerial salaries and expenses for the marketing function and another $3
million for indirect overhead allocated to the division.
a. Develop the profit-and-loss statement if net sales were $20 million last
year.
b. Develop the profit-and-loss statement if net sales were $40 million last
year.
c. Calculate Westgate’s breakeven sales.
Teaching Note: The profit-and-loss statements can be developed using Spreadsheet A3.1
or A3.2, but the equations in some cells will need to be changed to reflect the percentages
for this problem.
Copyright © 2015 Pearson Education, Inc.
A3-9
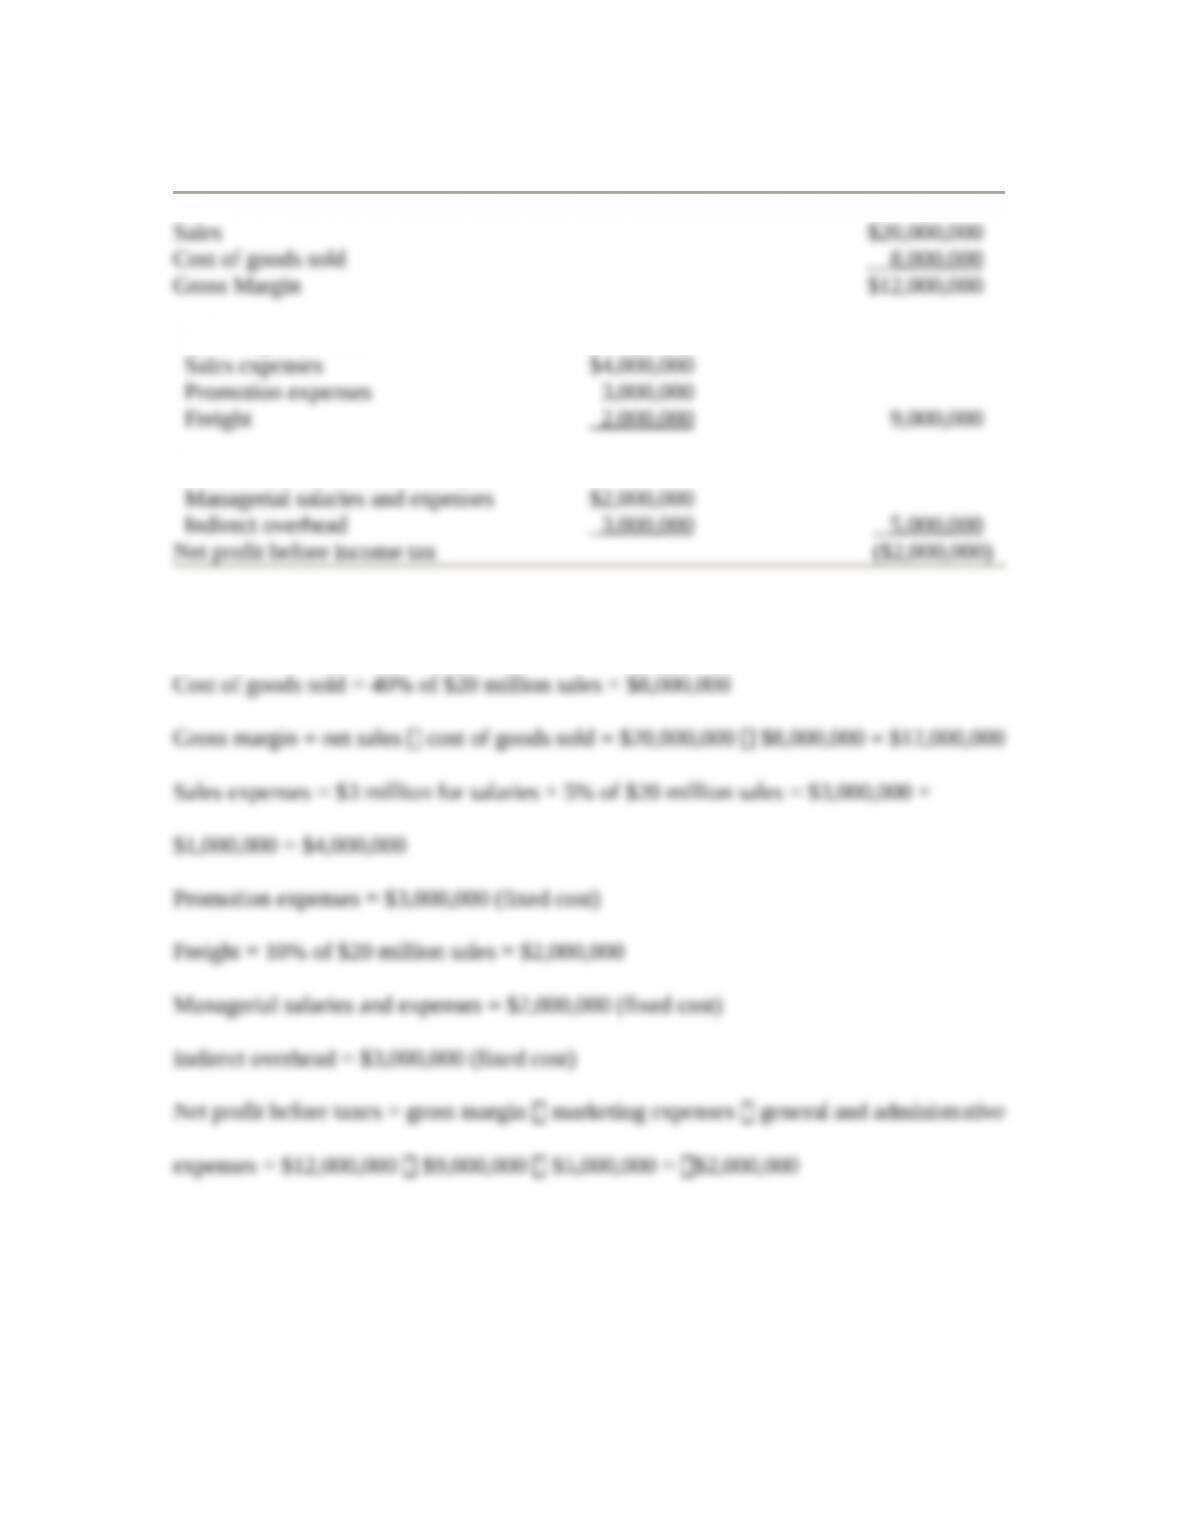
a.) The profit-and-loss statement at $20 million net sales:
Marketing Expenses
General and Administrative Expenses
where,
Copyright © 2015 Pearson Education, Inc.
A3-10
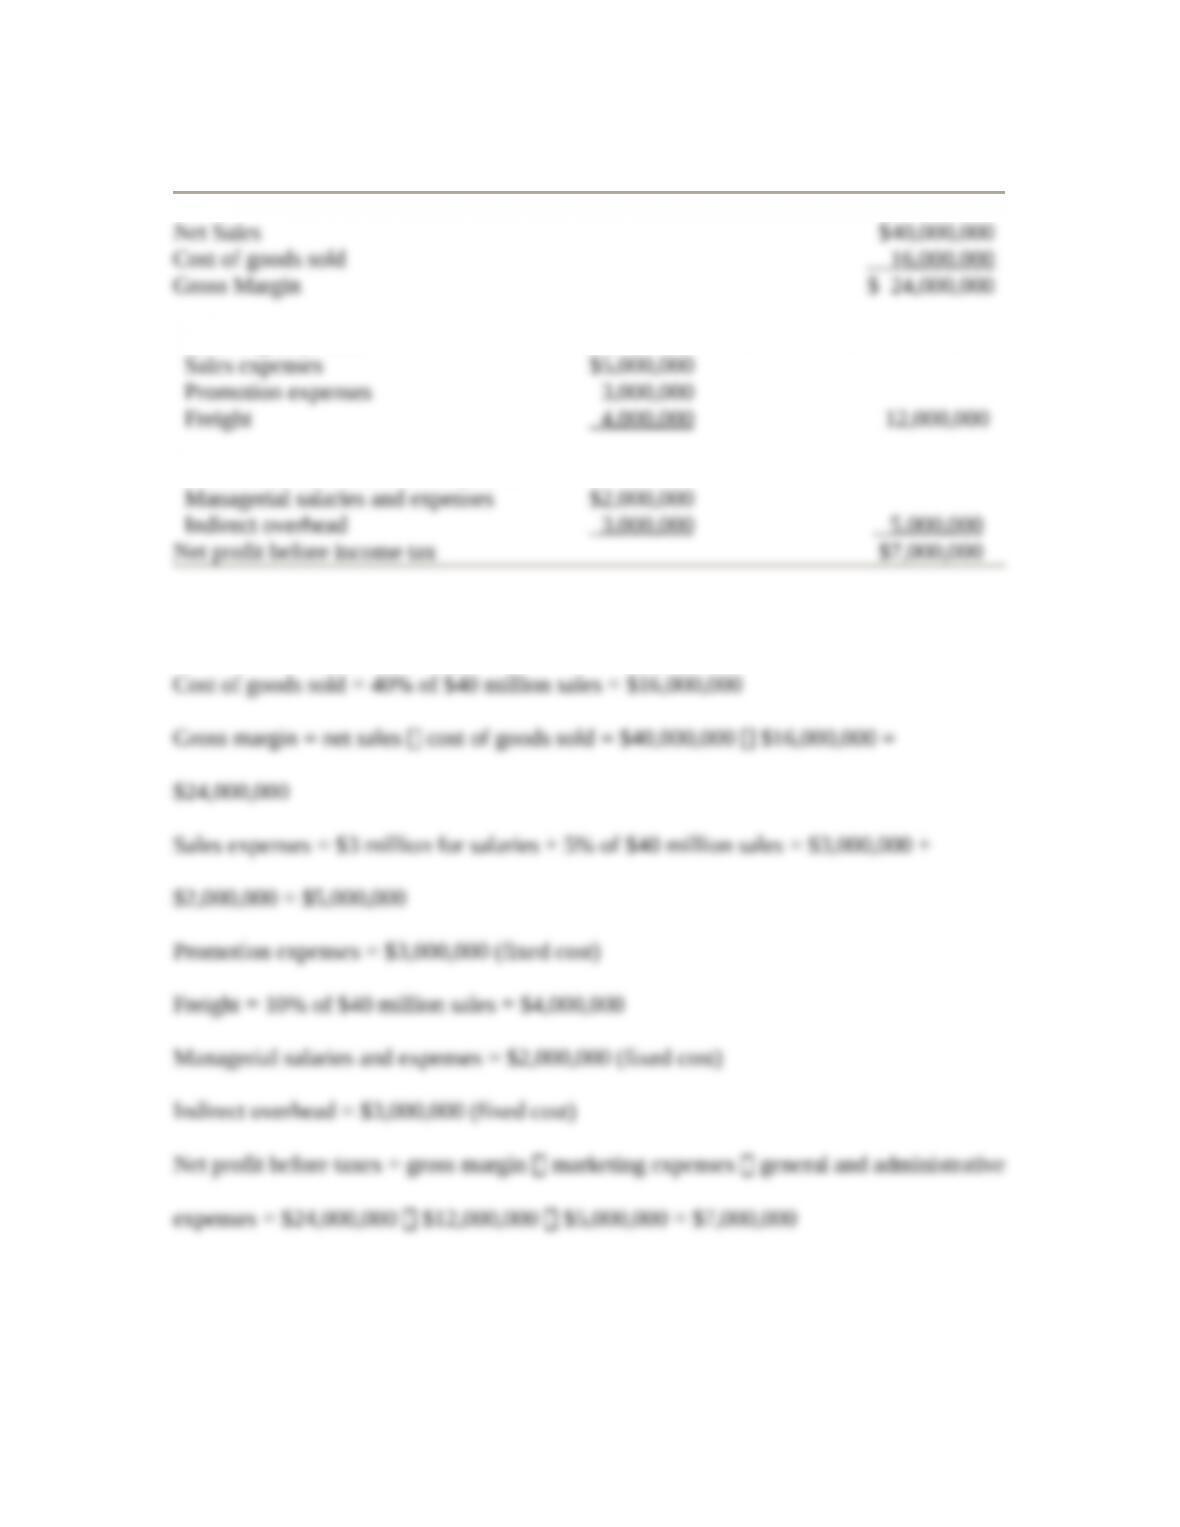
b.) The profit-and-loss statement at $40 million net sales:
Marketing Expenses
General and Administrative Expenses
where,
Copyright © 2015 Pearson Education, Inc.
A3-11