Unlock document.
This document is partially blurred.
Unlock all pages and 1 million more documents.
Get Access
P15-36B Completing a comprehensive financial statement analysis
Learning Objectives 2, 4
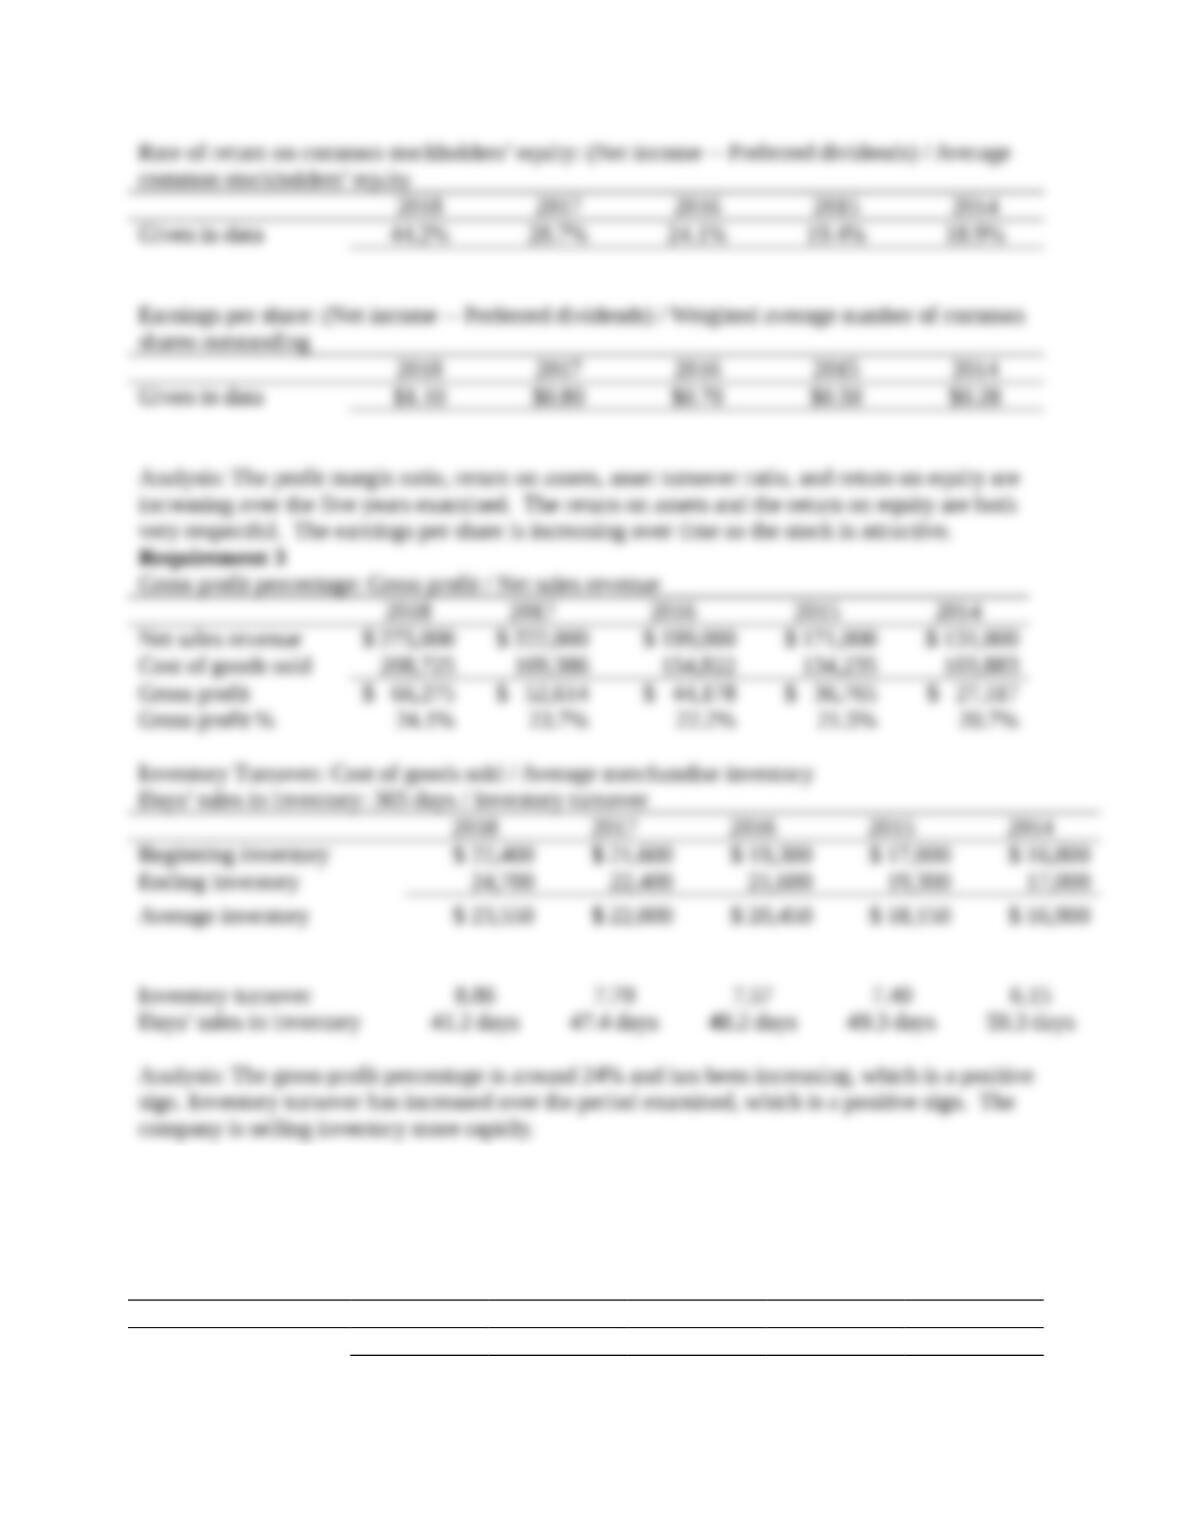
3. 2018: Inventory turnover 8.86
In its annual report, XYZ Athletic Supply, Inc. includes the following five-year financial
summary:
XYZ ATHLETIC SUPPLY, INC.
Five-Year Financial Summary (Partial; adapted)
(Dollar amounts in thousands
except per share data)
2018 2017 2016 2015 2014 2013
Net Sales Revenue $ 275,000 $ 222,000 $ 199,000 $ 171,000 $ 131,000
Net Sales Revenue Increase 24% 12% 16% 31% 17%
Domestic Comparative Store
Sales Increase
6% 6% 5% 8% 10%
Other Income—Net 2,090 1,780 1,770 1,700 1,310
Cost of Goods Sold 208,725 169,386 154,822 134,235 103,883
Selling and Administrative
Expenses
41,280 36,340 31,670 27,450 22,540
Interest:
Interest Expense (1,070) (1,370) (1,330) (1,100) (800)
Interest Income 140 155 150 230 140
Income Tax Expense 4,420 3,900 3,610 3,390 2,730
Net Income 21,735 12,939 9,488 6,755 2,497
Per Share of Common Stock:
Net Income 1.10 0.80 0.70 0.50 0.28
Dividends 0.45 0.43 0.39 0.35 0.31
Financial Position
Current Assets, Excluding
Merchandise Inventory
$ 30,900 $ 27,200 $ 26,800 $ 24,400 $ 21,800
Merchandise Inventory 24,700 22,400 21,600 19,300 17,000 $ 16,800
Property, Plant, and Equipment,
Net
51,600 46,200 40,500 35,000 25,200
Total Assets 107,200 95,800 88,900 78,700 64,000
Current Liabilities 32,600 27,800 28,800 25,600 17,000
Long-term Debt 23,000 21,200 16,800 18,600 12,900
Stockholders’ Equity 51,600 46,800 43,300 35,500 34,100
Financial Ratios
Acid-Test Ratio 0.9 1.0 0.9 1.0 1.3
Rate of Return on Total Assets 22.5% 15.5% 12.8% 10.9% 9.9%
Rate of Return on Common
Stockholders’ Equity
44.2% 28.7% 24.1% 19.4% 18.9%
Requirements
Analyze the company’s financial summary for the fiscal years 2014–2018 to decide whether to
invest in the common stock of XYZ. Include the following sections in your analysis.
1. Trend analysis for net sales revenue and net income (use 2014 as the base year).
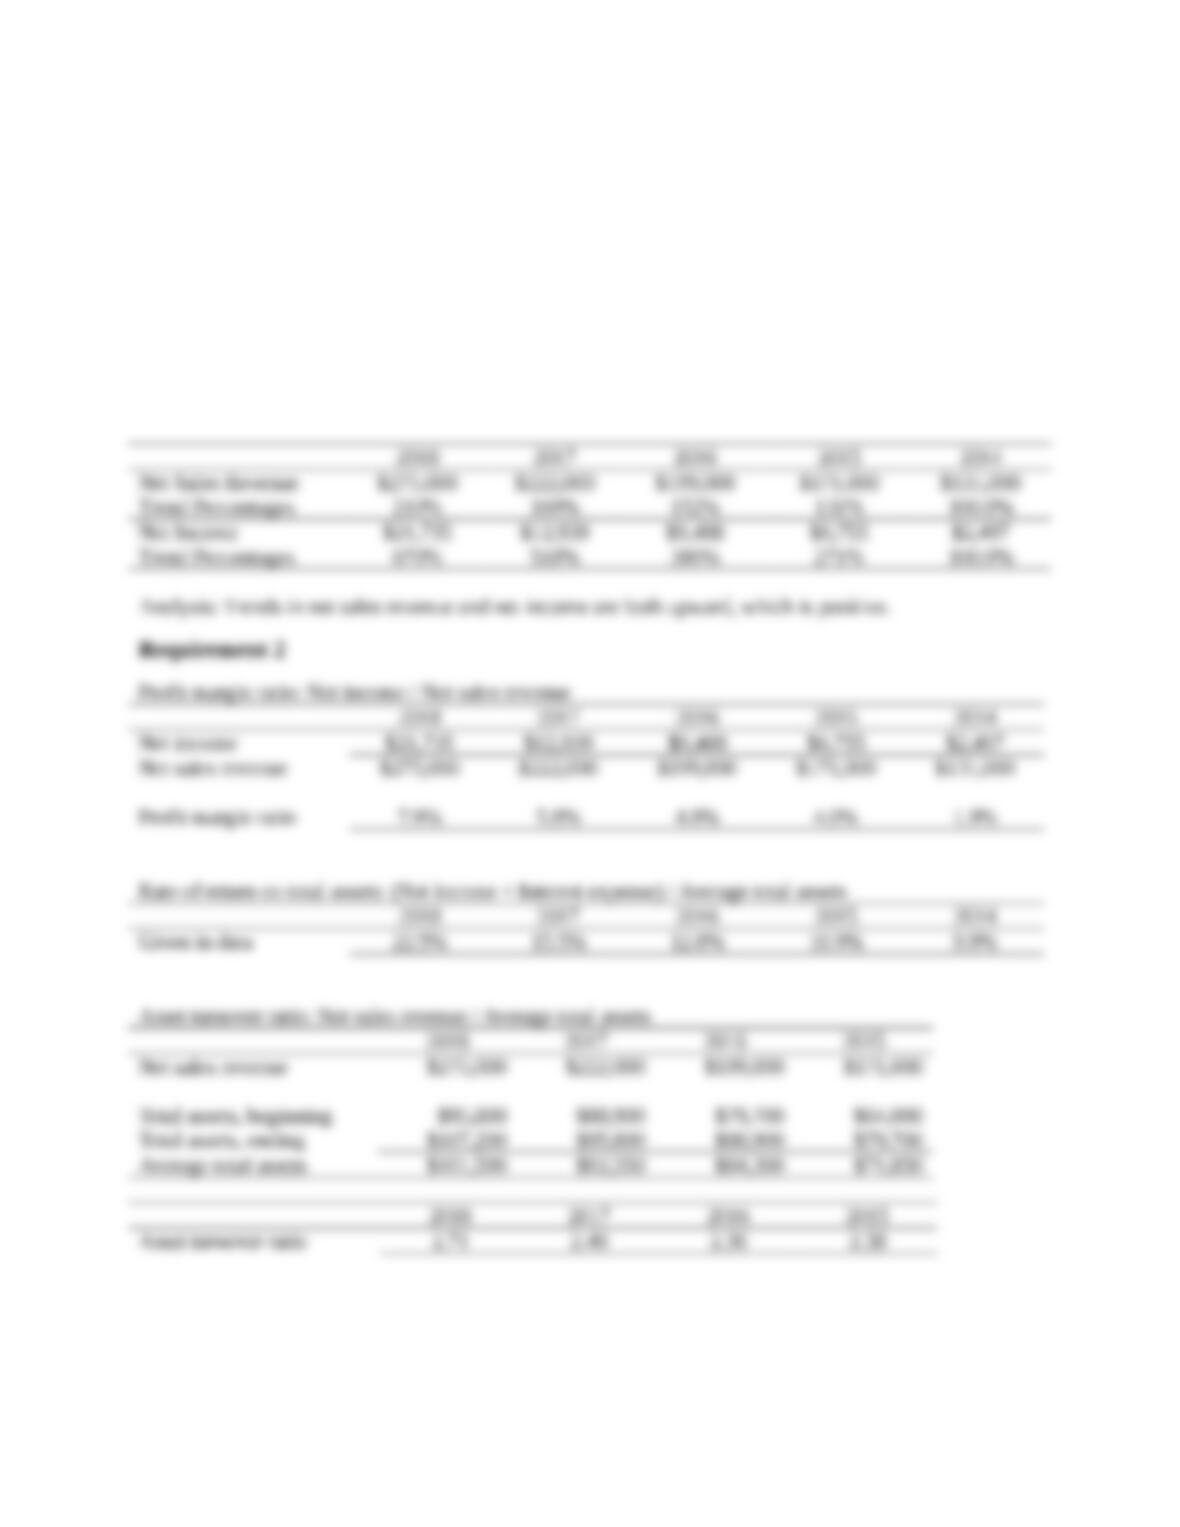
2. Profitability analysis.
3. Evaluation of the ability to sell merchandise inventory.
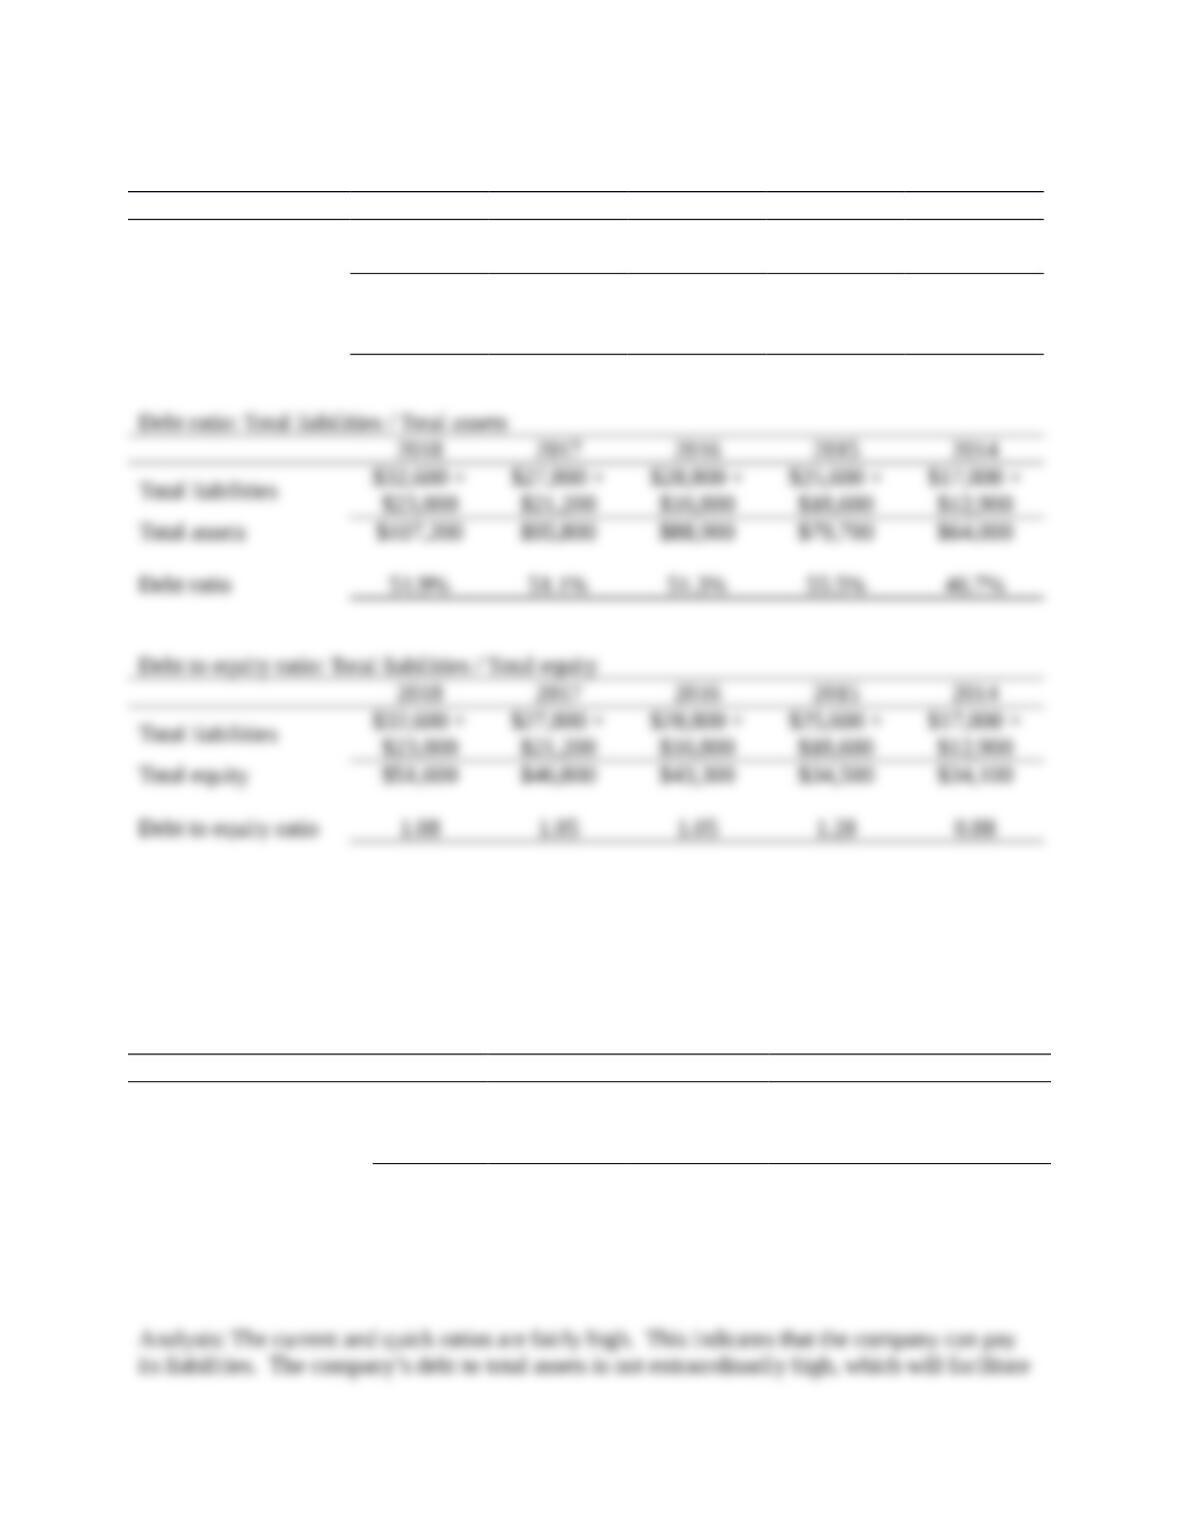
4. Evaluation of the ability to pay debts.
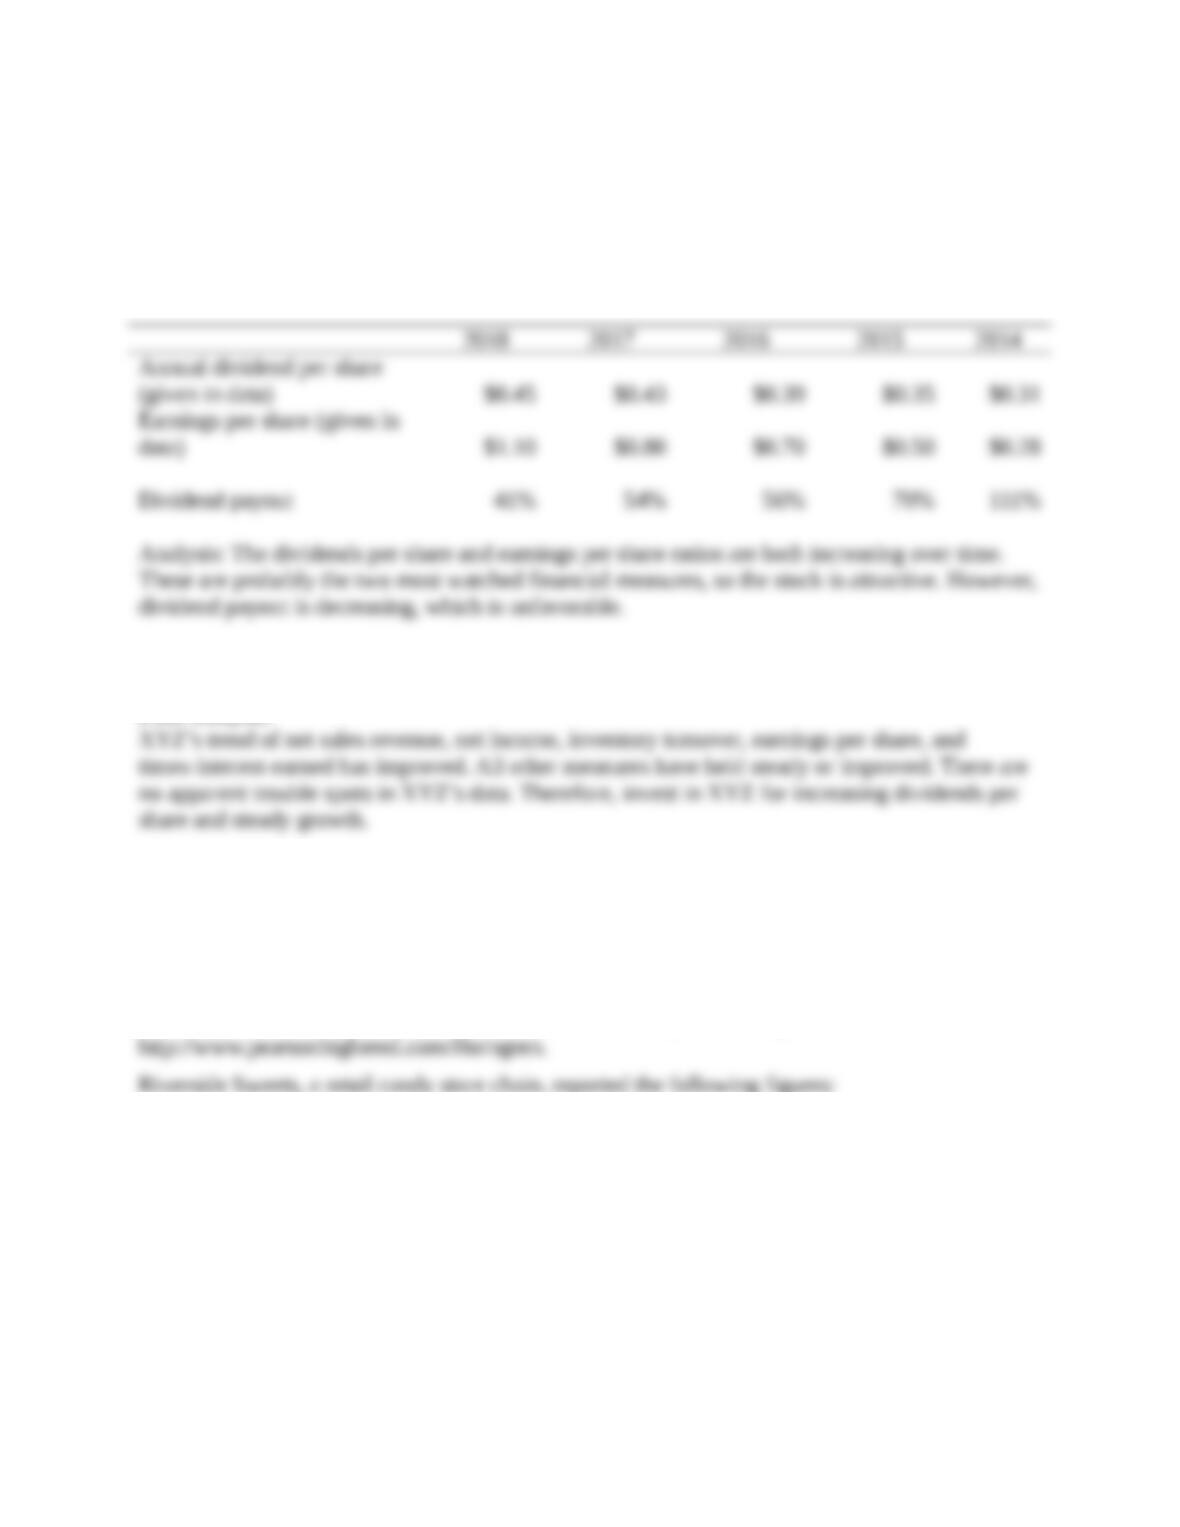
5. Evaluation of dividends.
6. Should you invest in the common stock of XYZ Athletic Supply, Inc.? Fully explain your
final decision
SOLUTION
Requirement 1
P15-36B, cont.
Requirement 2, cont.
P15-36B, cont.
Requirement 4
Acid-test ratio: (Cash + Cash equivalents + Short-term investments + Net current receivables) /
Current liabilities
2018 2017 2016 2015 2014
Given in data 0.9 1.0 0.9 1.0 1.3
Current ratio: Current assets / Current liabilities
2018 2017 2016 2015 2014
Current assets $30,900 +
$24,700
$27,200 +
$22,400
$26,800 +
$21,600
$24,400 +
$19,300
$21,800 +
$17,000
Current liabilities $32,600 $27,800 $28,800 $25,600 $17,000
Current ratio 1.71 1.78 1.68 1.71 2.28
P15-36B, cont.
Requirement 4, cont.
Times interest earned ratio: (Net income + income tax expense + Interest expense) / Interest
expense
2018 2017 2016 2015 2014
Net income $ 21,735 $ 12,939 $ 9,488 $ 6,755 $ 2,497
Income tax expense 4,420 3,900 3,610 3,390 2,730
Interest expense 1,070 1,370 1,330 1,100 800
Total $ 27,225 $ 18,209 $ 14,428 $ 11,245 $ 6,027
Times-interest-earned
ratio 25.44 13.29 10.85 10.22 7.53
the company making all payments for debt. The times-interest-earned ratio has increased from
2014 to 2018 which is favorable.
Requirement 5
Dividend payout: Annual dividend per share / Earnings per share
Requirement 6
Final analysis:
Excel Skill Problem
P15-37 Using Excel for financial statement analysis
Download an Excel template for this problem online in MyAccountingLab or at
Additional financial information:
a. 75% of net sales revenue are on account.
b. Market price of stock is $36 per share on June 30, 2019.
c. Annual dividend for 2019 was $1.50 per share.
d. All short-term investments are cash equivalents.
Requirements
1. Perform a horizontal analysis on the balance sheet for 2018 and 2019.
2. Perform a vertical analysis on the income statement.
3. Compute the following ratios:
a. Working Capital
b. Current Ratio
c. Acid-Test (Quick) Ratio
d. Cash Ratio
e. Accounts Receivable Turnover
f. Days’ Sales in Receivables
g. Inventory Turnover
h. Days’ Sales in Inventory
i. Gross Profit Percentage
j. Debt Ratio
k. Debt to Equity Ratio
l. Times-Interest-Earned Ratio
m. Profit Margin Ratio
n. Rate of Return on Total Assets
o. Asset Turnover Ratio
p. Rate of Return on Common Stockholders’ Equity
q. Earnings per Share (EPS)
r. Price/Earnings Ratio
s. Dividend Yield
t. Dividend Payout
SOLUTION


