P15-29A Completing a comprehensive financial statement analysis
Learning Objectives 2, 4
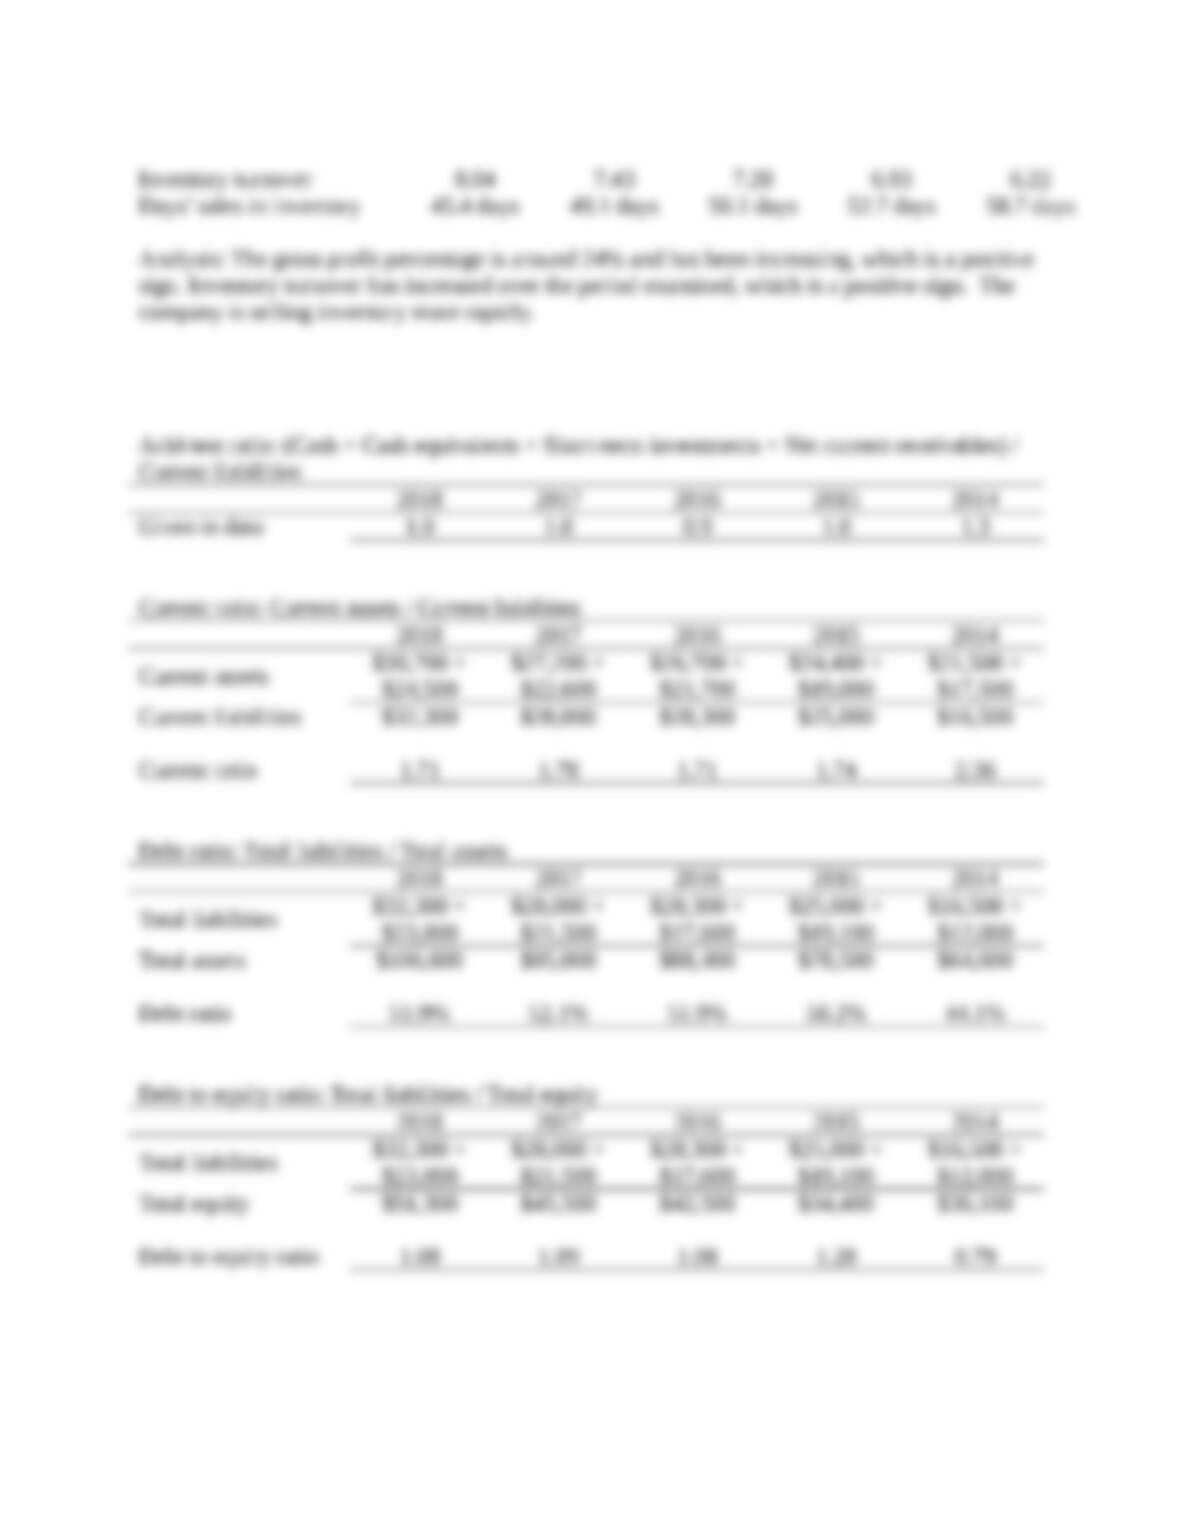
3. 2018: Inventory turnover 8.04
In its annual report, ABC Athletic Supply, Inc. includes the following five-year financial
summary:
ABC ATHLETIC SUPPLY, INC.
Five-Year Financial Summary (Partial; adapted)
(Dollar amounts in thousands
except per share data)
2018 2017 2016 2015 2014 2013
Net Sales Revenue $ 250,000 $ 216,000 $ 191,000 $ 161,000 $ 134,000
Net Sales Revenue Increase 16% 13% 19% 20% 17%
Domestic Comparative Store Sales
Increase
5% 6% 4% 7% 9%
Other Income—Net 2,110 1,840 1,760 1,690 1,330
Cost of Goods Sold 189,250 164,592 148,216 126,385 106,396
Selling and Administrative Expenses 41,210 36,330 31,620 27,440 22,540
Interest:
Interest Expense (1,080) (1,380) (1,400) (1,020) (830)
Interest Income 125 165 155 235 190
Income Tax Expense 4,470 3,900 3,700 3,320 2,700
Net Income 16,225 11,803 7,979 4,760 3,054
Per Share of Common Stock:
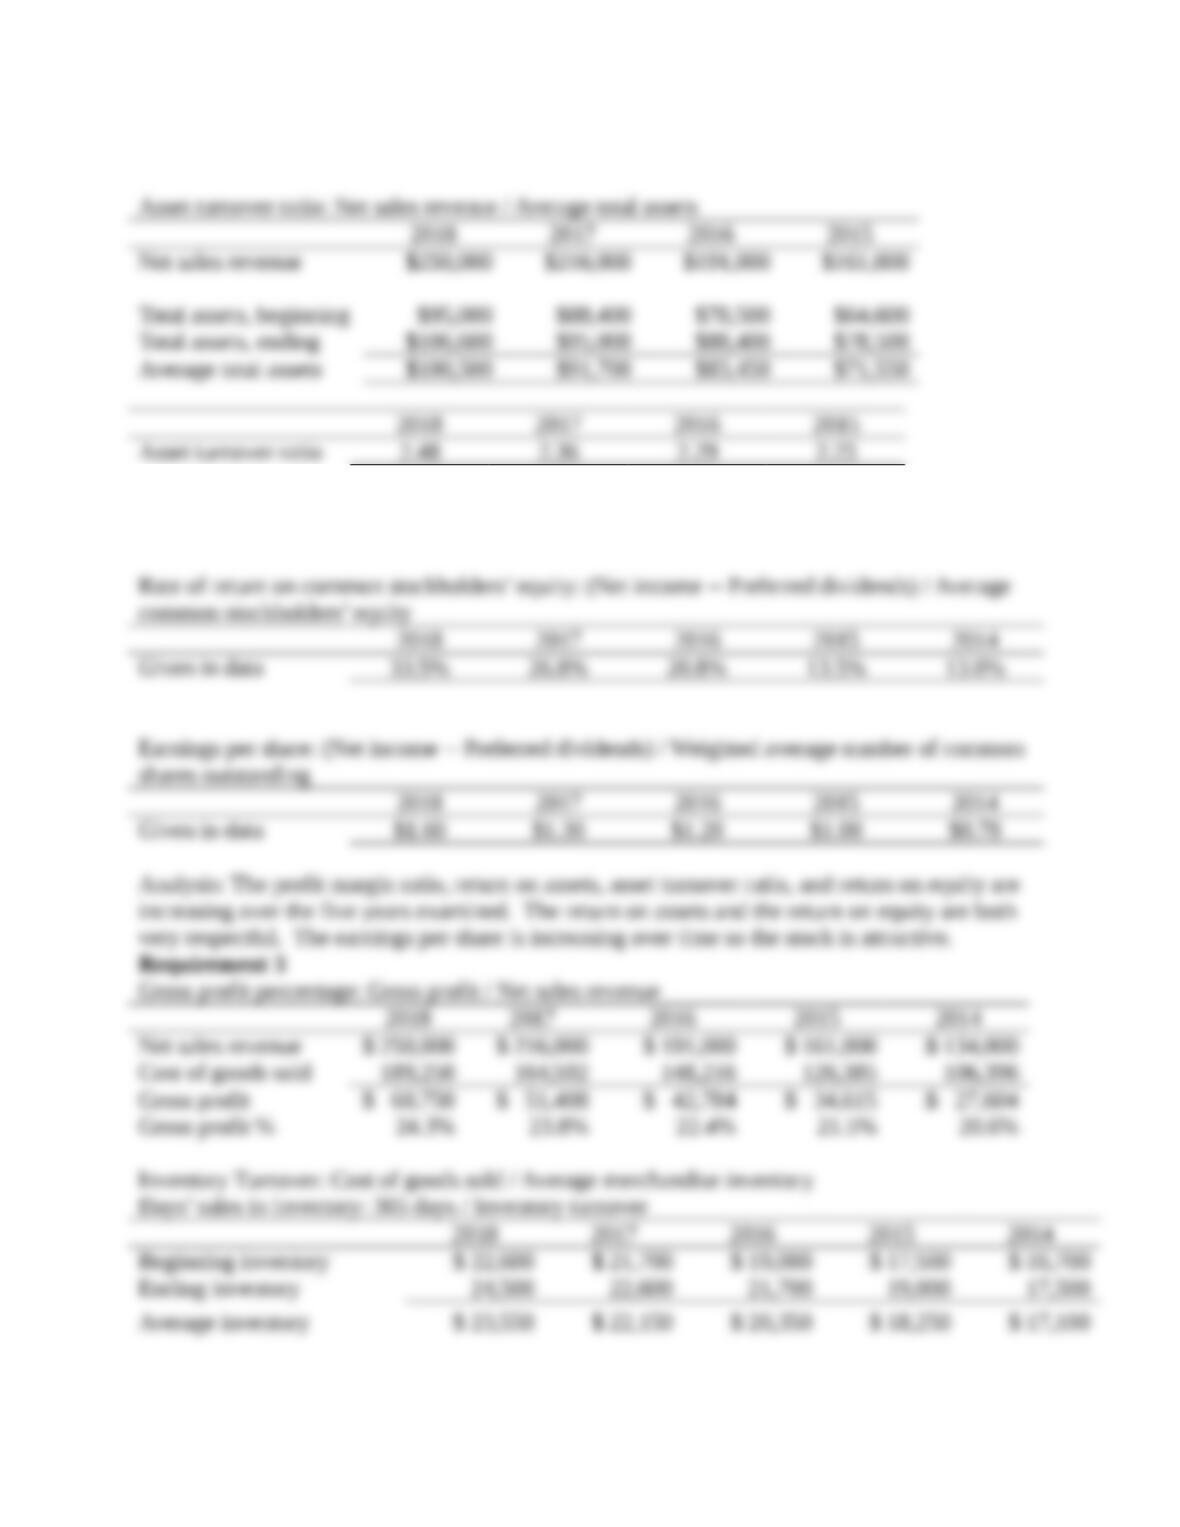
Net Income 1.60 1.30 1.20 1.00 0.78
Dividends 0.40 0.38 0.34 0.30 0.26
Financial Position
Current Assets, Excluding
Merchandise Inventory
$ 30,700 $ 27,200 $ 26,700 $ 24,400 $ 21,500
Merchandise Inventory 24,500 22,600 21,700 19,000 17,500 $
16,700
Property, Plant, and Equipment, Net 51,400 45,200 40,000 35,100 25,600
Total Assets 106,600 95,000 88,400 78,500 64,600
Current Liabilities 32,300 28,000 28,300 25,000 16,500
Long-term Debt 23,000 21,500 17,600 19,100 12,000
Stockholders’ Equity 51,300 45,500 42,500 34,400 36,100
Financial Ratios
Acid-Test Ratio 1.0 1.0 0.9 1.0 1.3
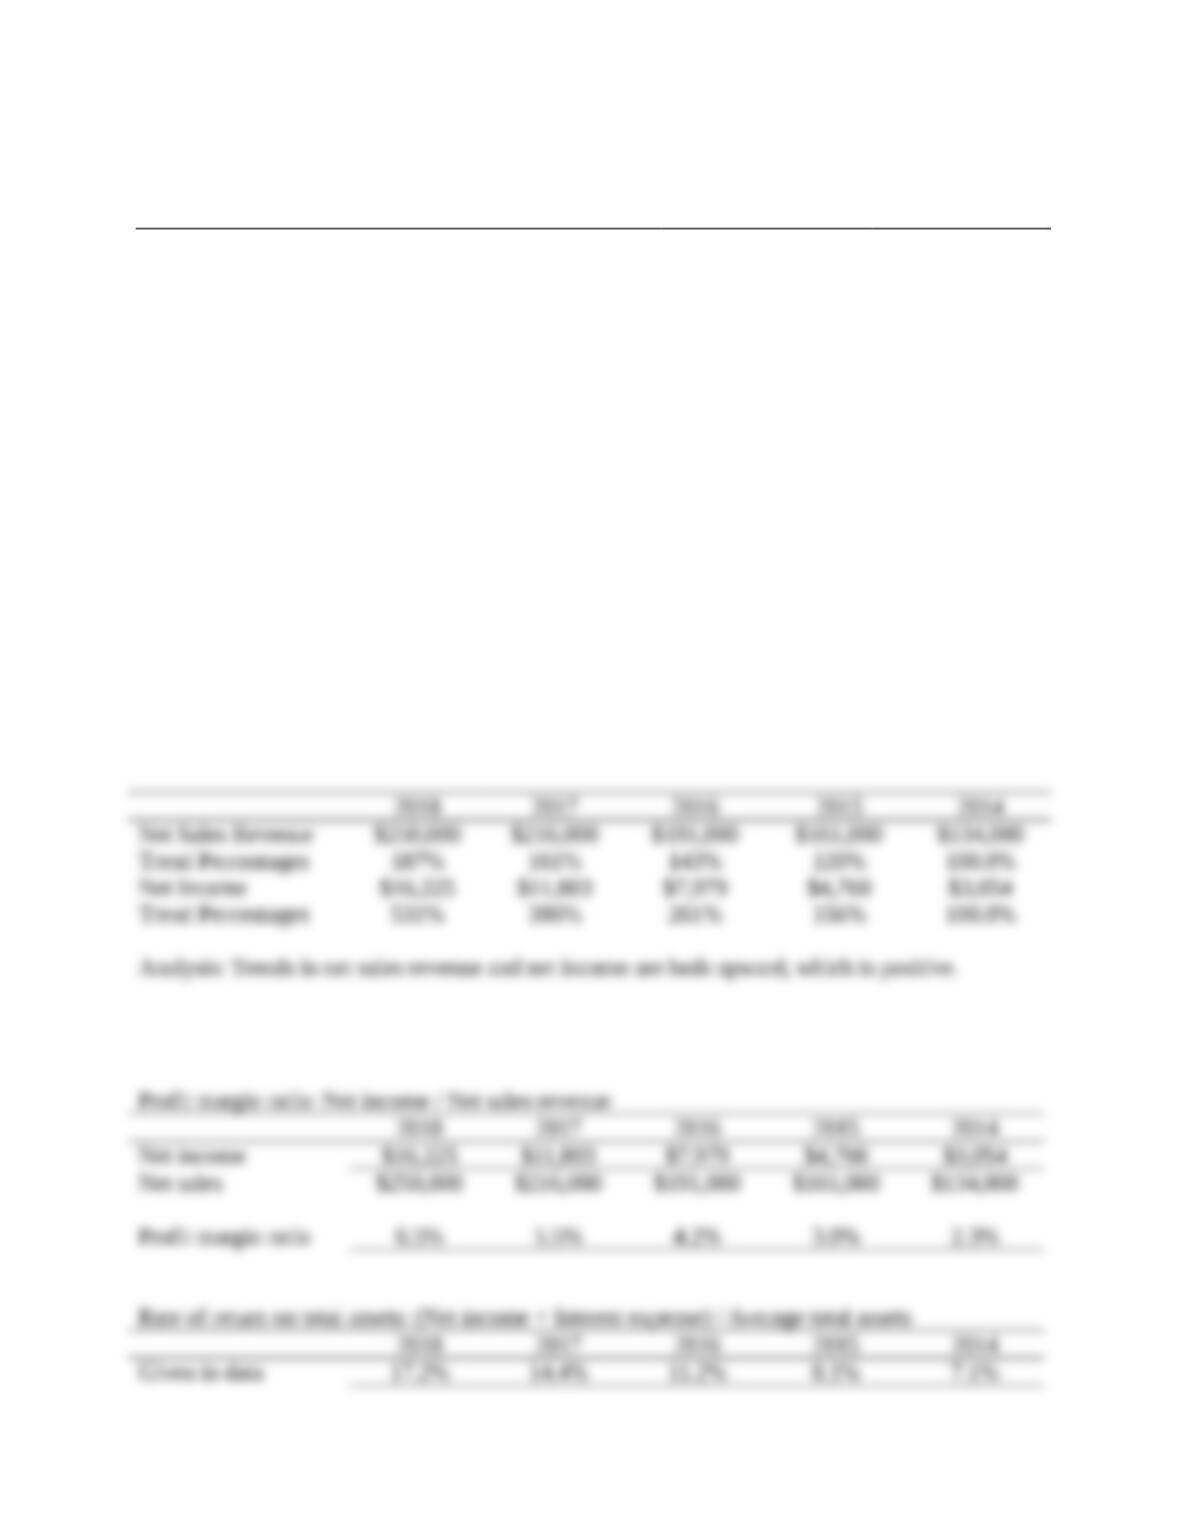
Rate of Return on Total Assets 17.2% 14.4% 11.2% 8.1% 7.1%
Rate of Return on Common
Stockholders’ Equity
33.5% 26.8% 20.8% 13.5% 13.0%
P15-29A, cont.
Requirements
Analyze the company’s financial summary for the fiscal years 2014–2018 to decide whether to
invest in the common stock of ABC. Include the following sections in your analysis.
1. Trend analysis for net sales revenue and net income (use 2014 as the base year).
2. Profitability analysis.
3. Evaluation of the ability to sell merchandise inventory.
4. Evaluation of the ability to pay debts.
5. Evaluation of dividends.
6. Should you invest in the common stock of ABC Athletic Supply, Inc.? Fully explain your
final decision
SOLUTION
Requirement 1
P15-29A, cont.
Requirement 2
P15-29A, cont.
Requirement 2, cont.
P15-29A, cont.
Requirement 4
P15-29A, cont.
Requirement 4, cont.
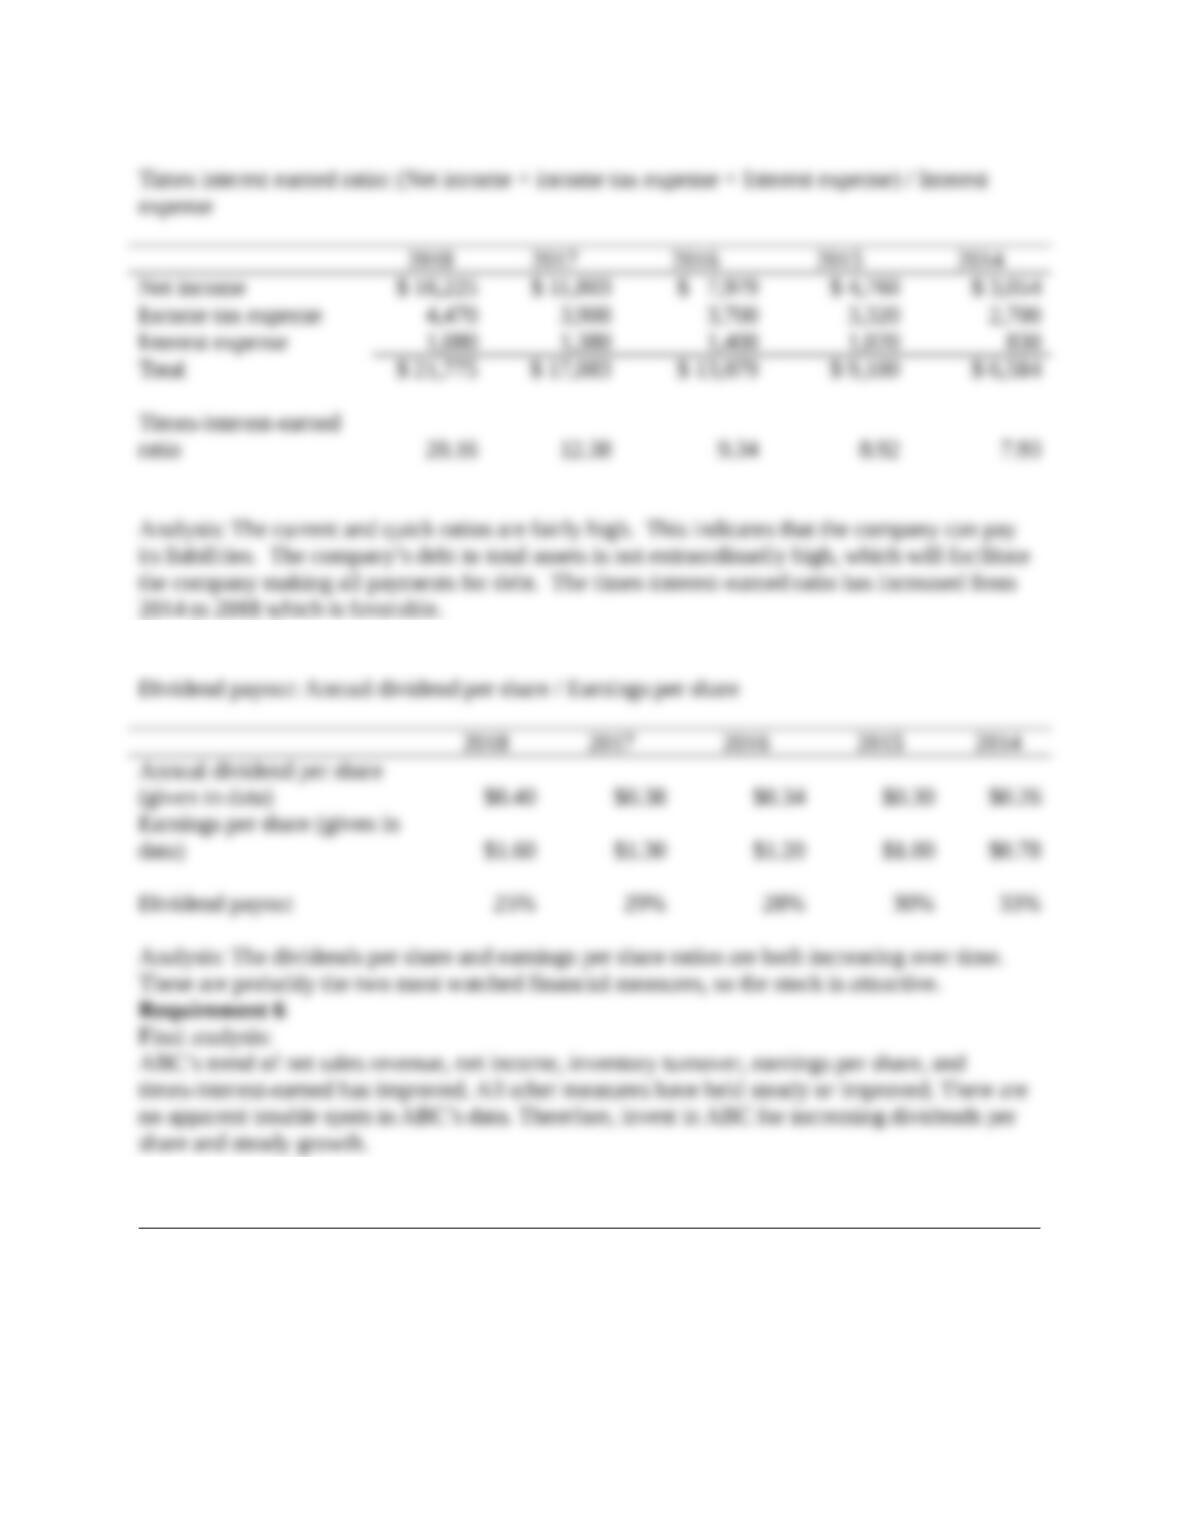
Requirement 5
Problems (Group B)
P15-30B Computing trend analysis and return on common equity
Learning Objectives 2, 4
2. 2018: 11.9%
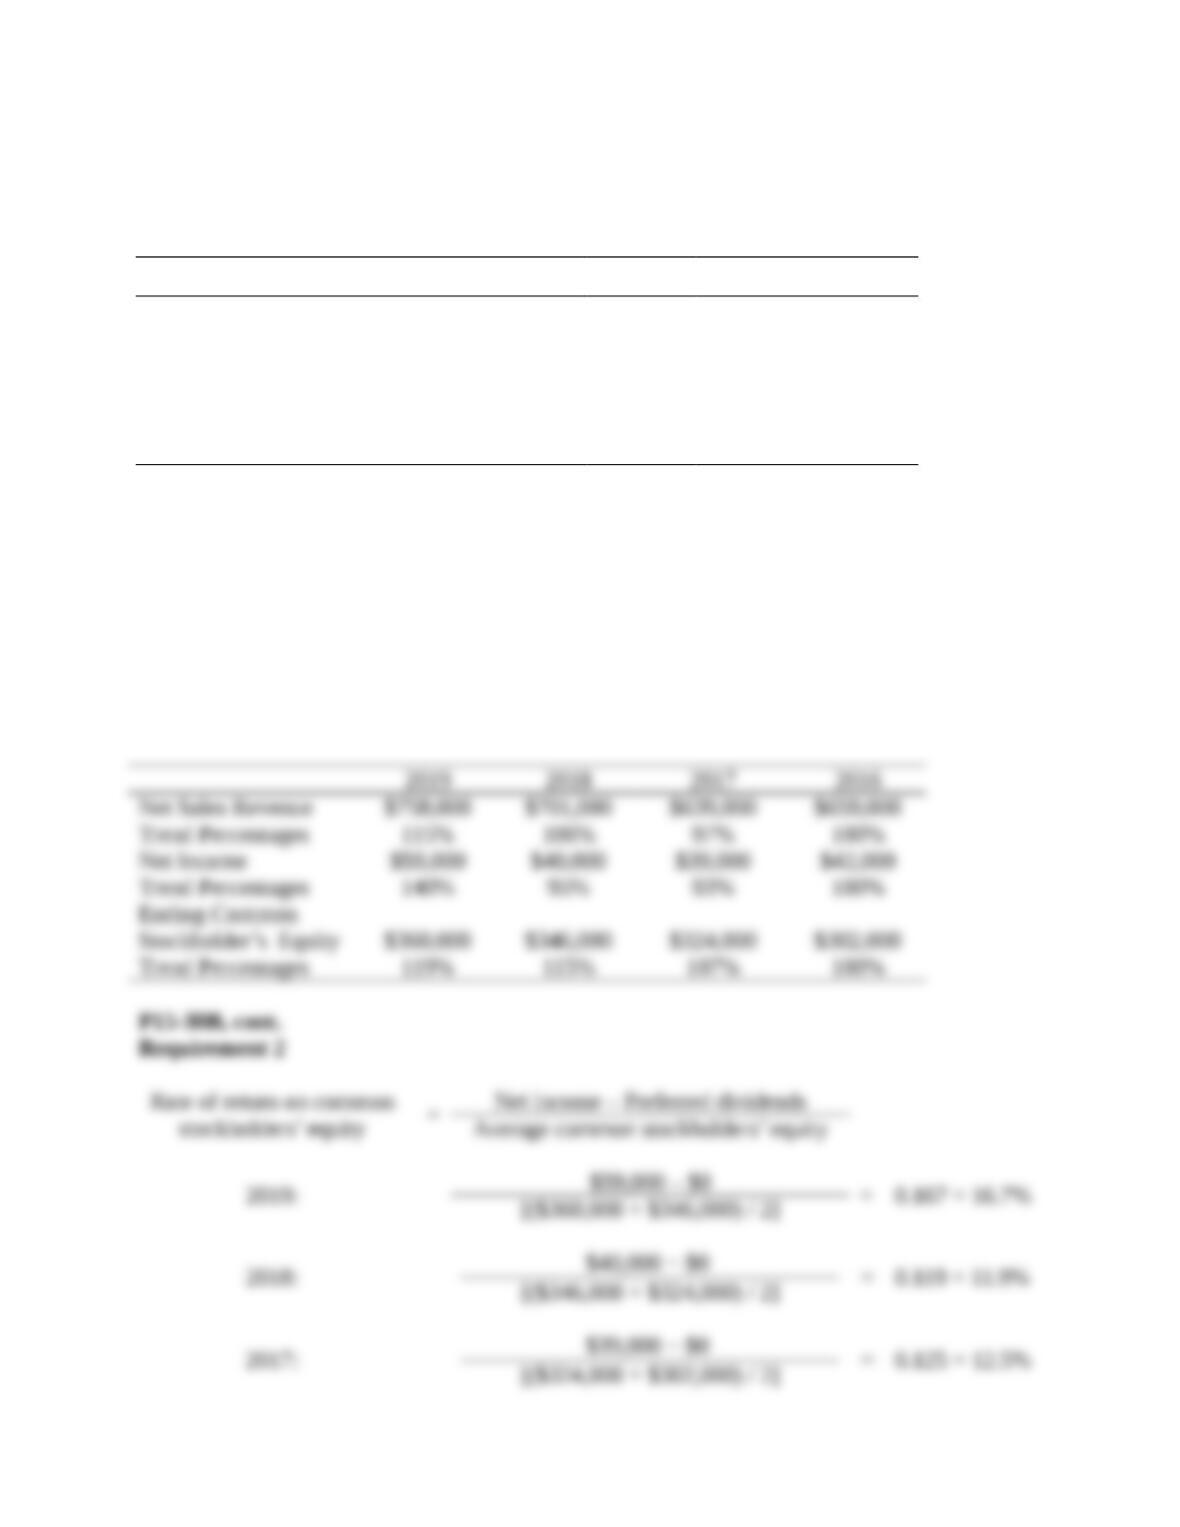
Net sales revenue, net income, and common stockholders’ equity for Azbel Mission Corporation,
a manufacturer of contact lenses, follow for a four-year period.
2019 2018 2017 2016
Net Sales Revenue $
758,000
$
701,000
$
639,000
$
659,000
Net Income 59,000 40,000 39,000 42,000
Ending Common Stockholders’
Equity
360,000 346,000 324,000 302,000
Requirements
1. Compute trend analyses for each item for 2017–2019. Use 2016 as the base year, and round to
the nearest whole percent.
2. Compute the rate of return on common stockholders’ equity for 2017–2019, rounding to three
decimal places.
SOLUTION
Requirement 1
P15-31B Performing vertical analysis
Learning Objective 3
1. Net Income 10.9%
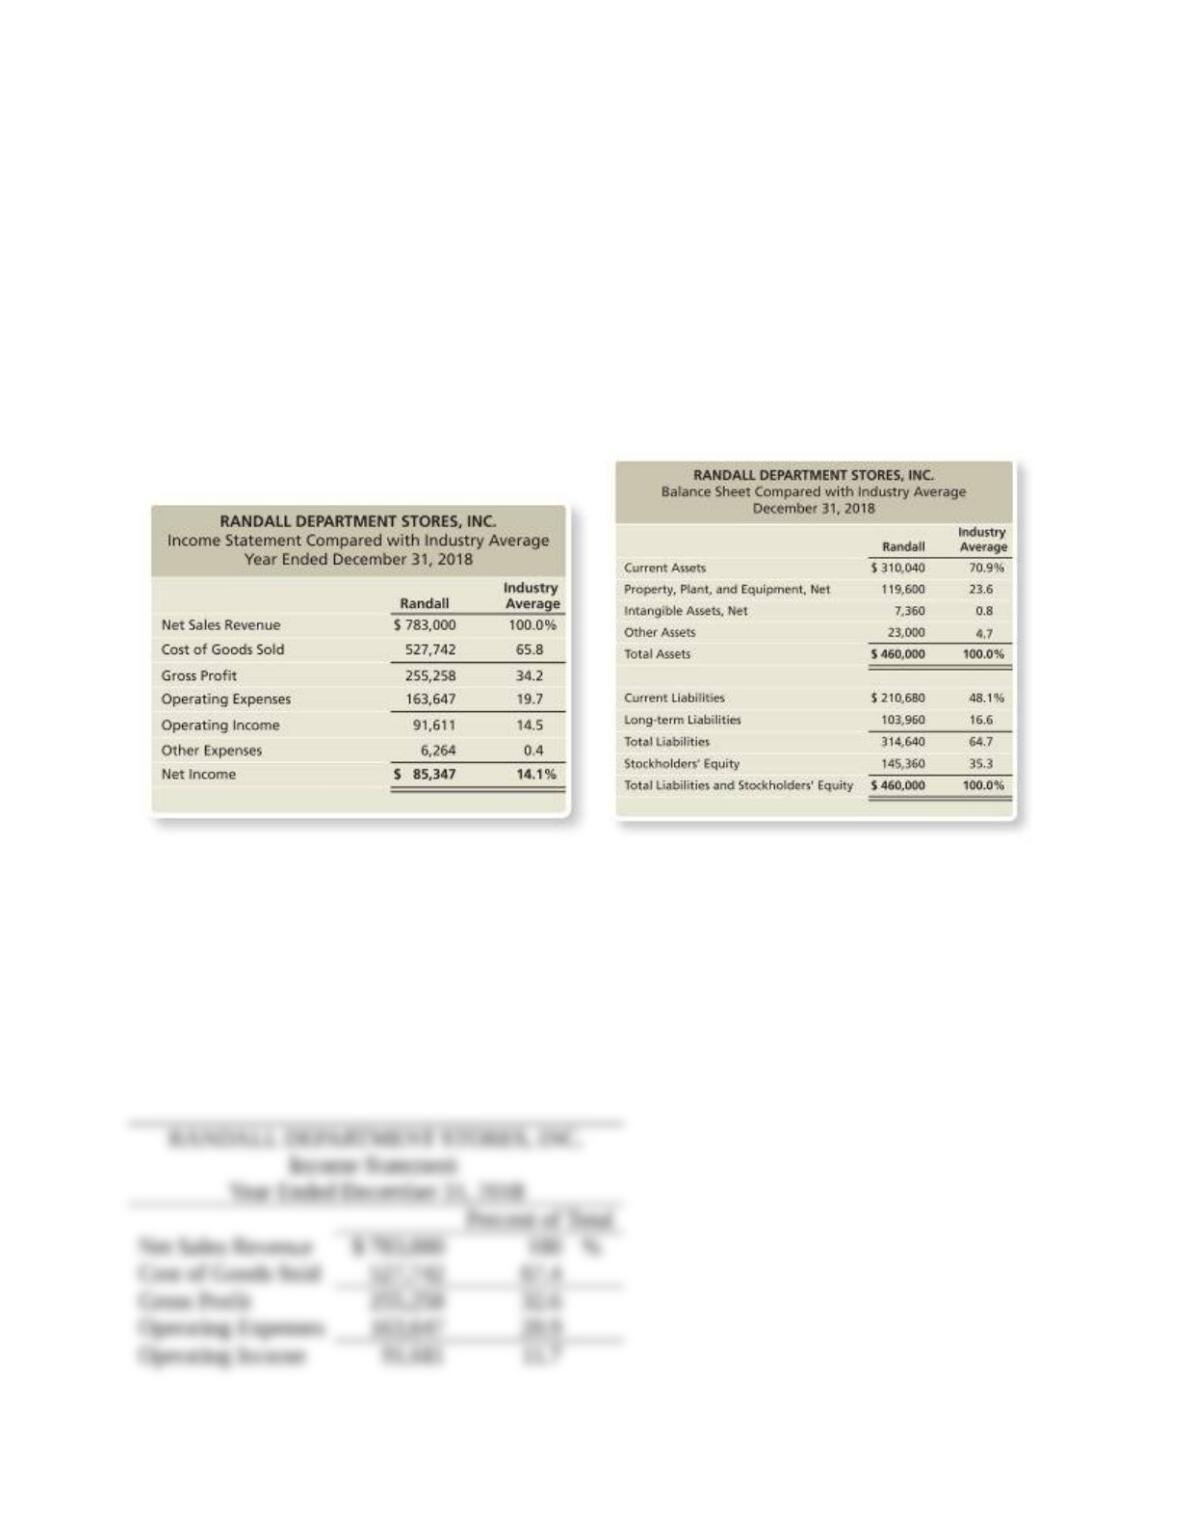
The Randall Department Stores, Inc. chief executive officer (CEO) has asked you to compare the
company’s profit performance and financial position with the averages for the industry. The CEO
has given you the company’s income statement and balance sheet as well as the industry average
data for retailers.
Requirements
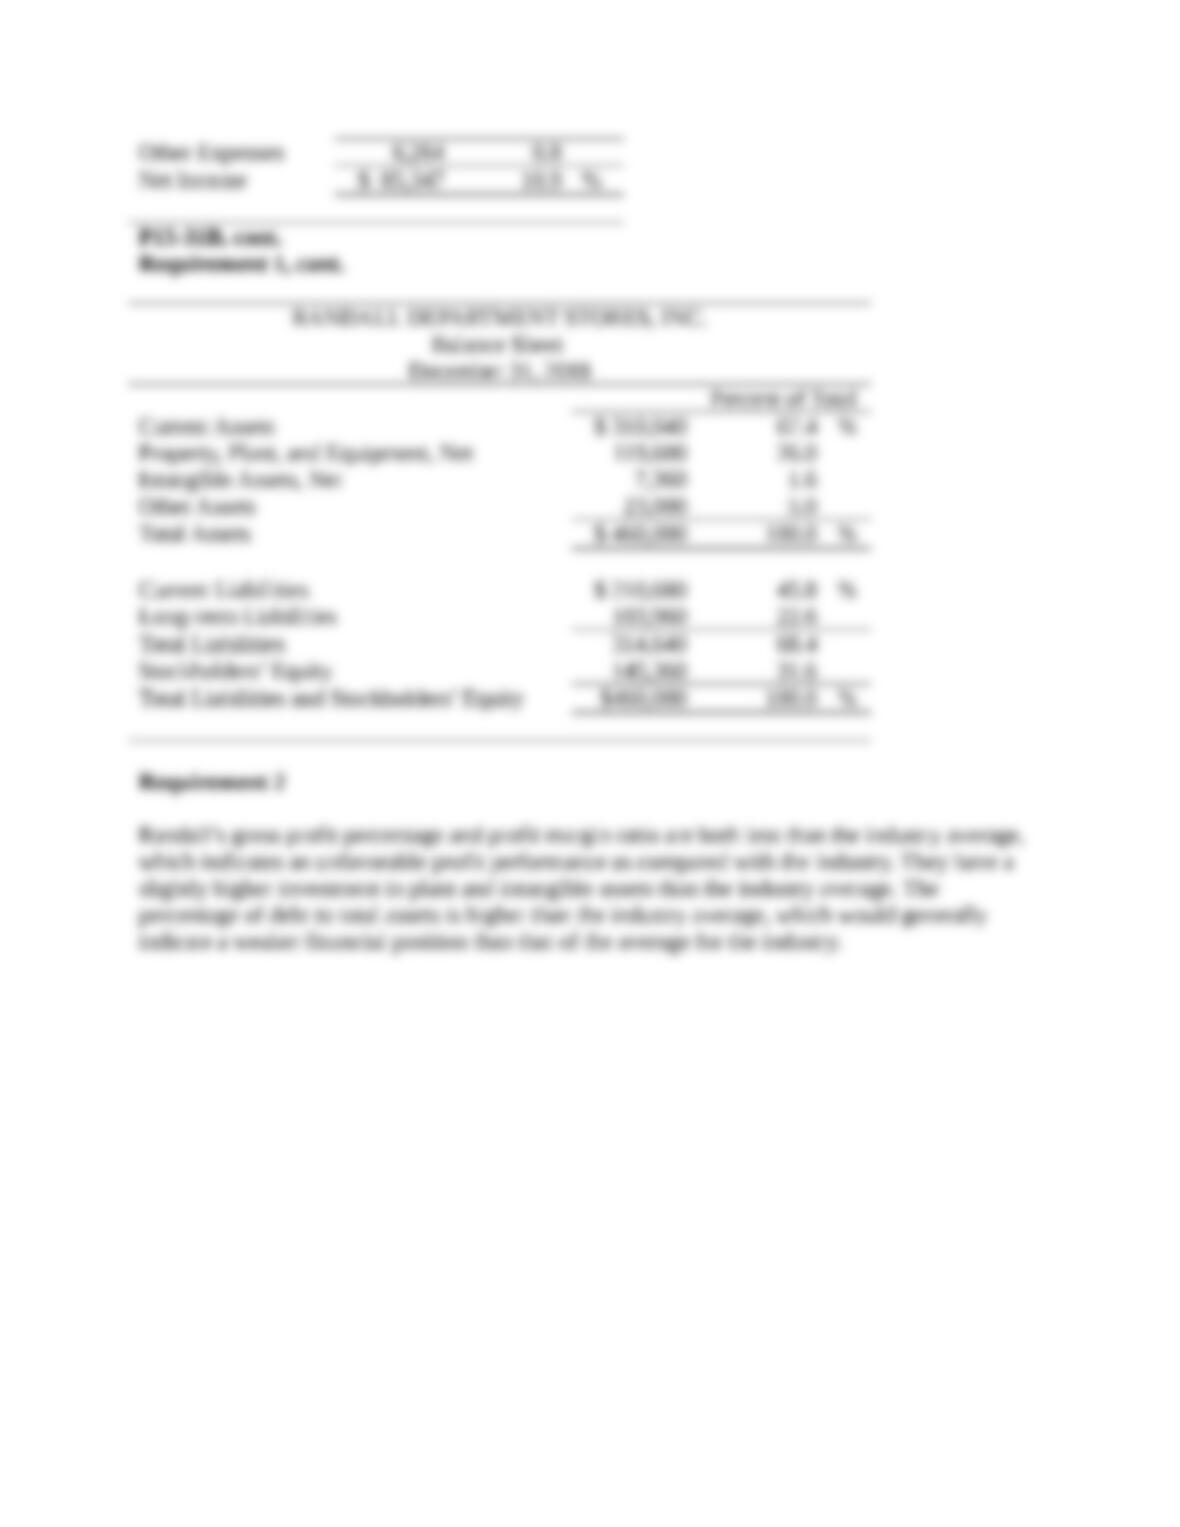
1. Prepare a vertical analysis for Randall for both its income statement and balance sheet.
2. Compare the company’s profit performance and financial position with the average for the
industry.
SOLUTION
Requirement 1
Note: Problem P15-31B must be completed before attempting Problem P15-32B.
P15-32B Preparing common-size statements, analysis of profitability and financial position,
comparison with the industry, and using ratios to evaluate a company
Learning Objectives 3, 4
1. Current Assets 67.4%
Consider the data for Randall Department Stores presented in Problem P15-31B.
Requirements
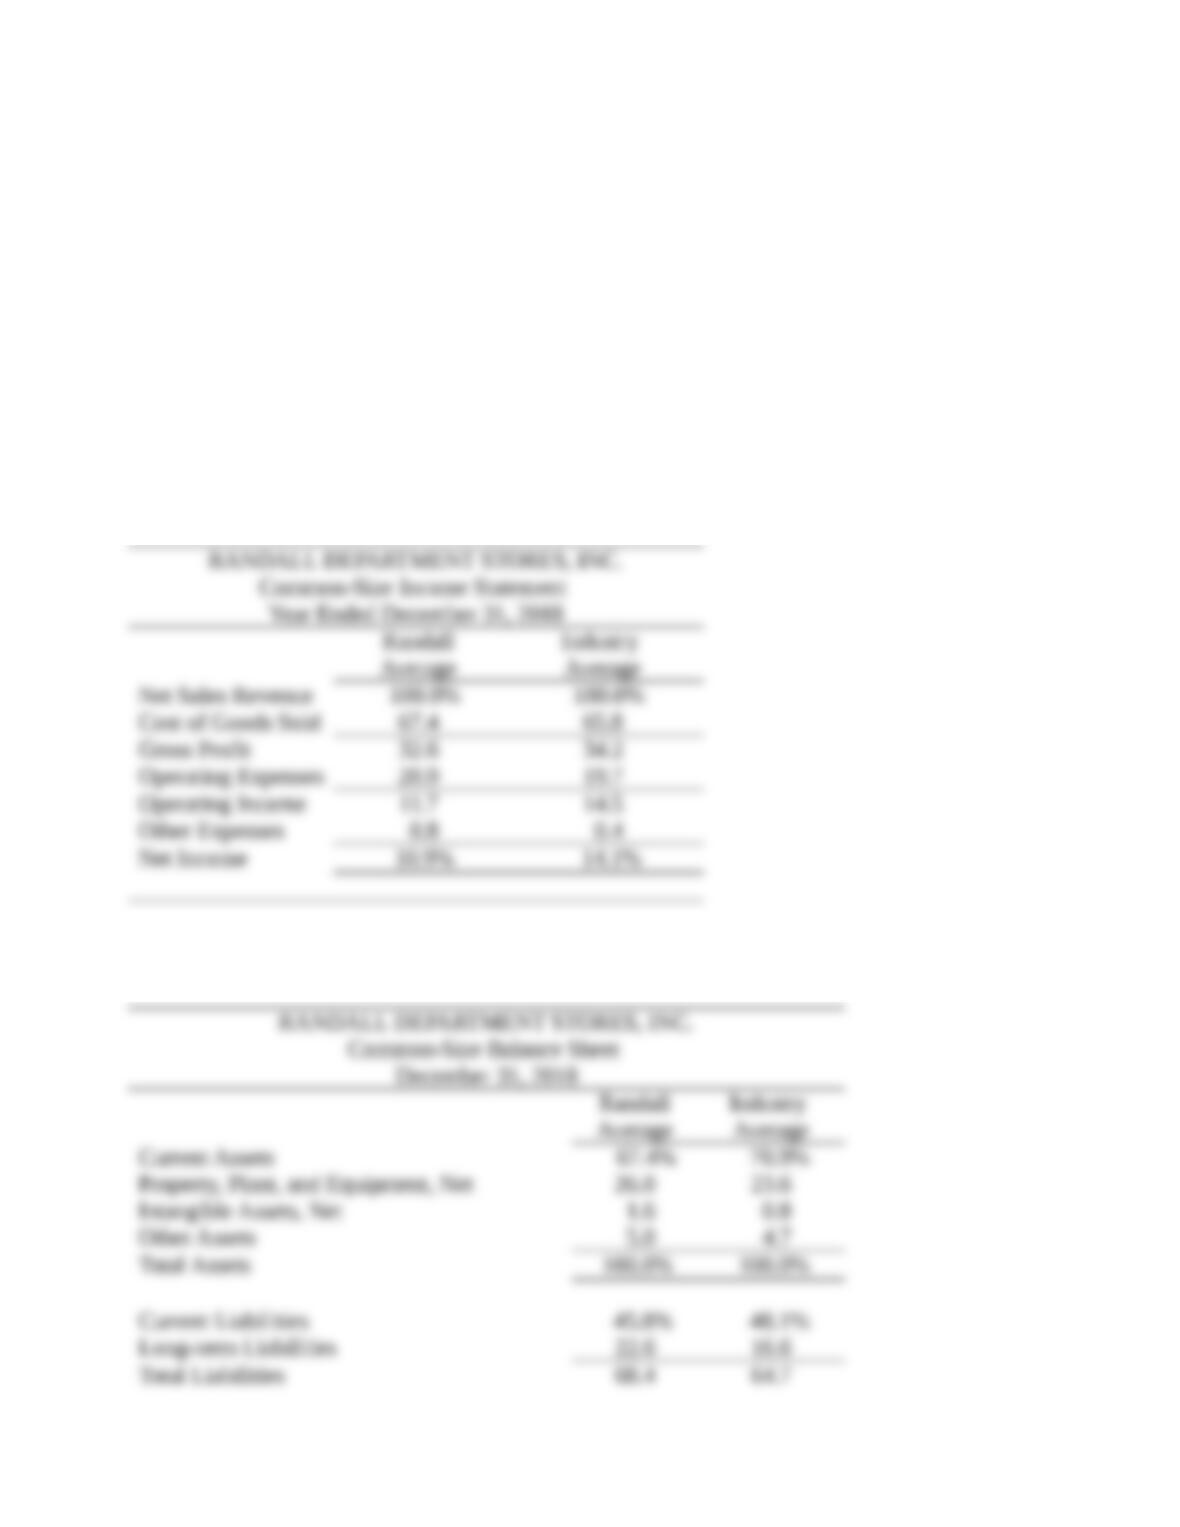
1. Prepare a common-size income statement and balance sheet for Randall. The first column of
each statement should present Randall’s common-size statement, and the second column, the
industry averages.
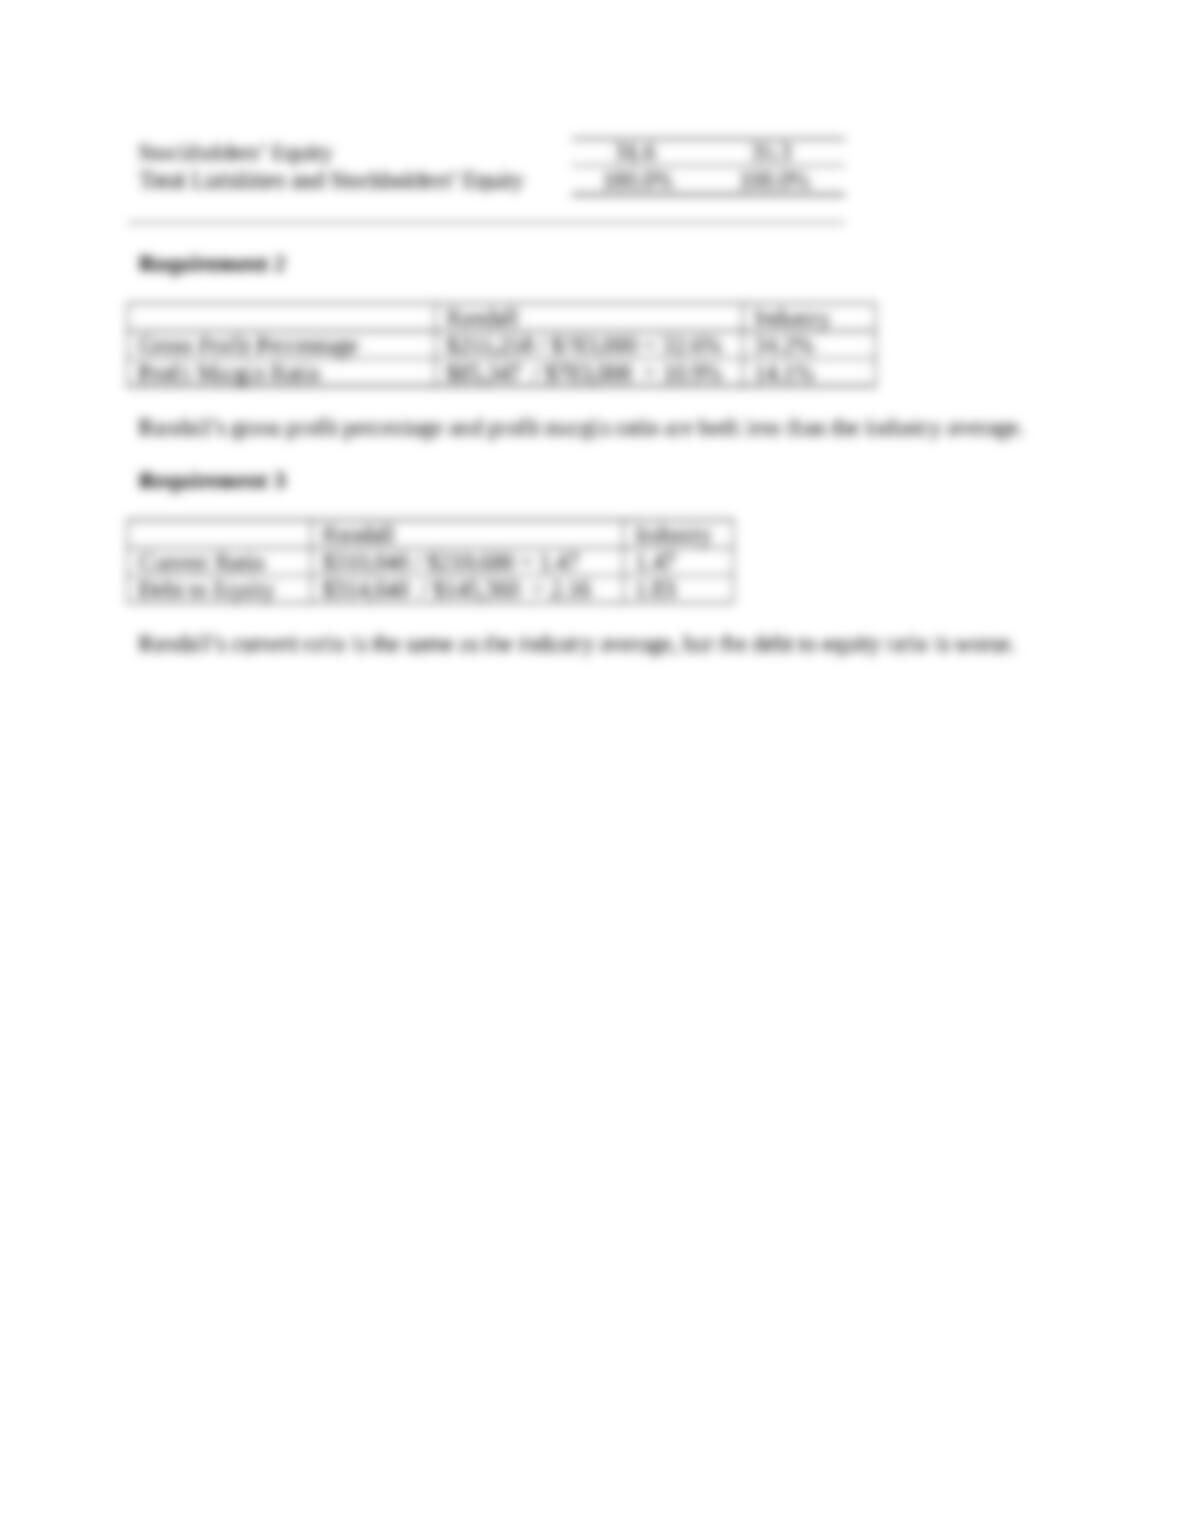
2. For the profitability analysis, compute Randall’s (a) gross profit percentage and (b) profit
margin ratio. Compare these figures with the industry averages. Is Randall’s profit
performance better or worse than the industry average?
3. For the analysis of financial position, compute Randall’s (a) current ratio and (b) debt to
equity ratio. Compare these ratios with the industry averages. Assume the current ratio
industry average is 1.47, and the debt to equity industry average is 1.83. Is Randall’s financial
position better or worse than the industry averages?
SOLUTION
Requirement 1
P15-32B, cont.
Requirement 1, cont.