Note: Problem P15-24A must be completed before attempting Problem P15-25A.
P15-24A Performing vertical analysis
Learning Objective 3
1. Net Income 11.3%
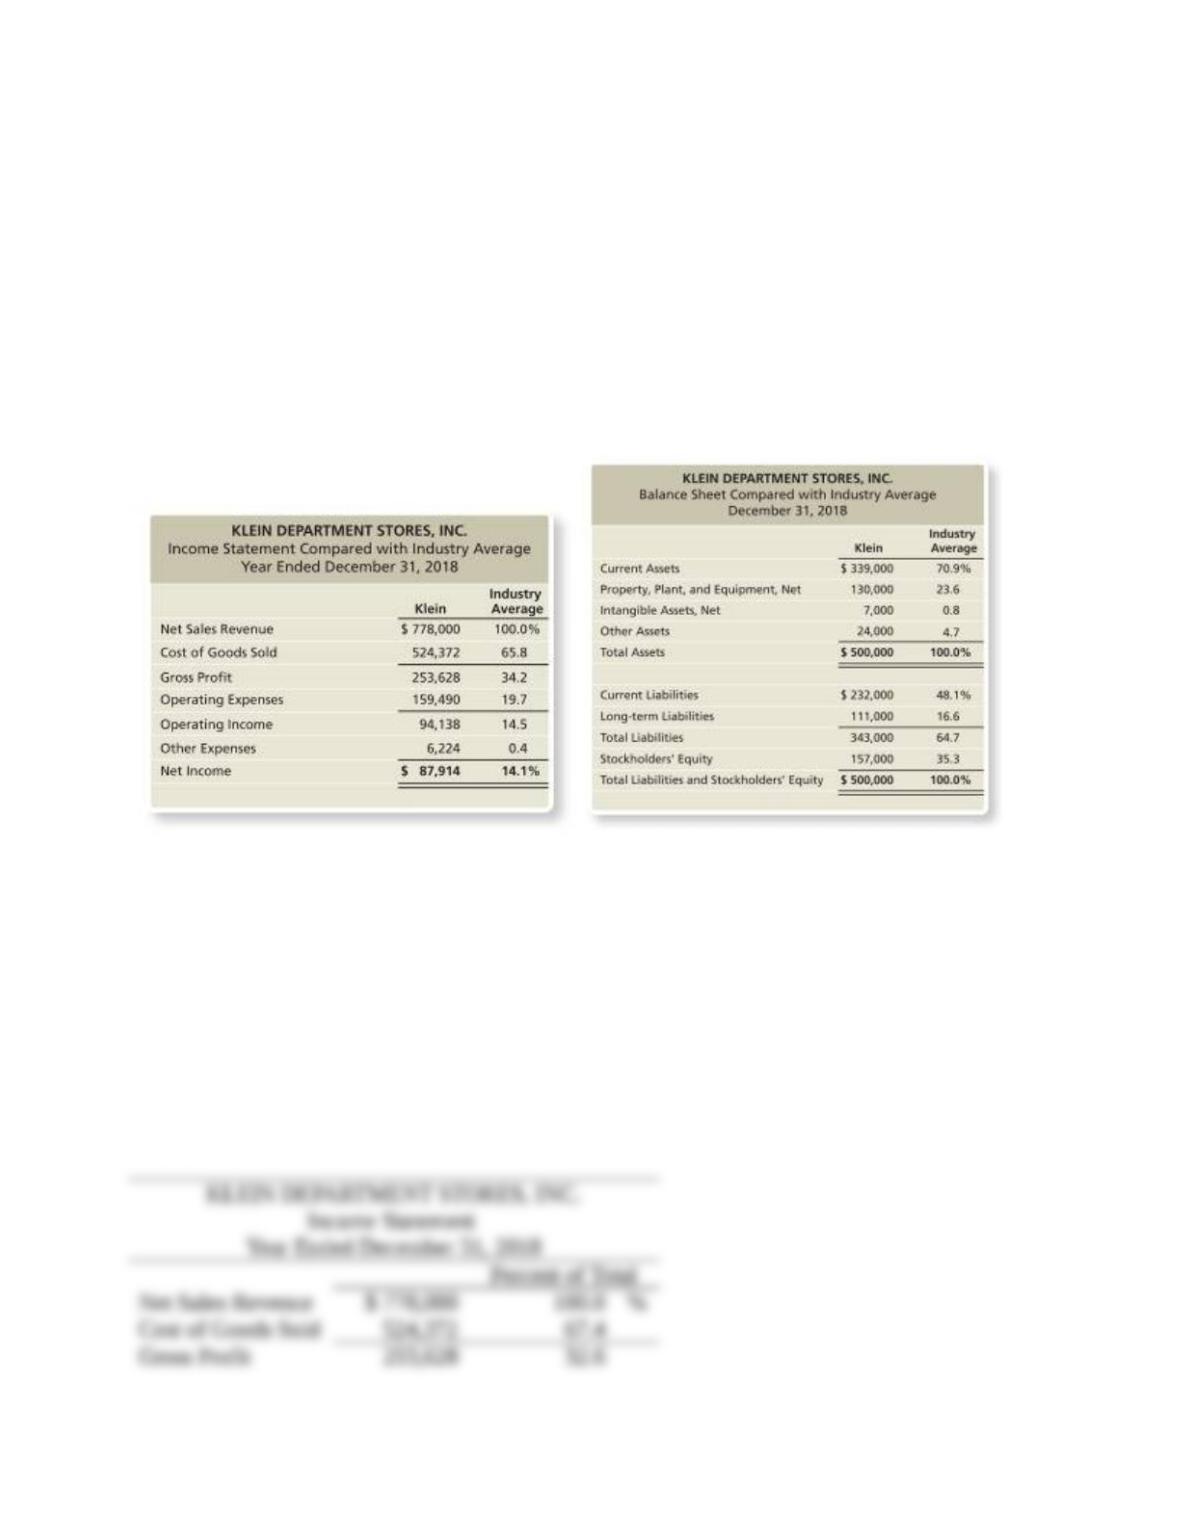
The Klein Department Stores, Inc. chief executive officer (CEO) has asked you to compare the
company’s profit performance and financial position with the averages for the industry. The CEO
has given you the company’s income statement and balance sheet as well as the industry average
data for retailers.
Requirements
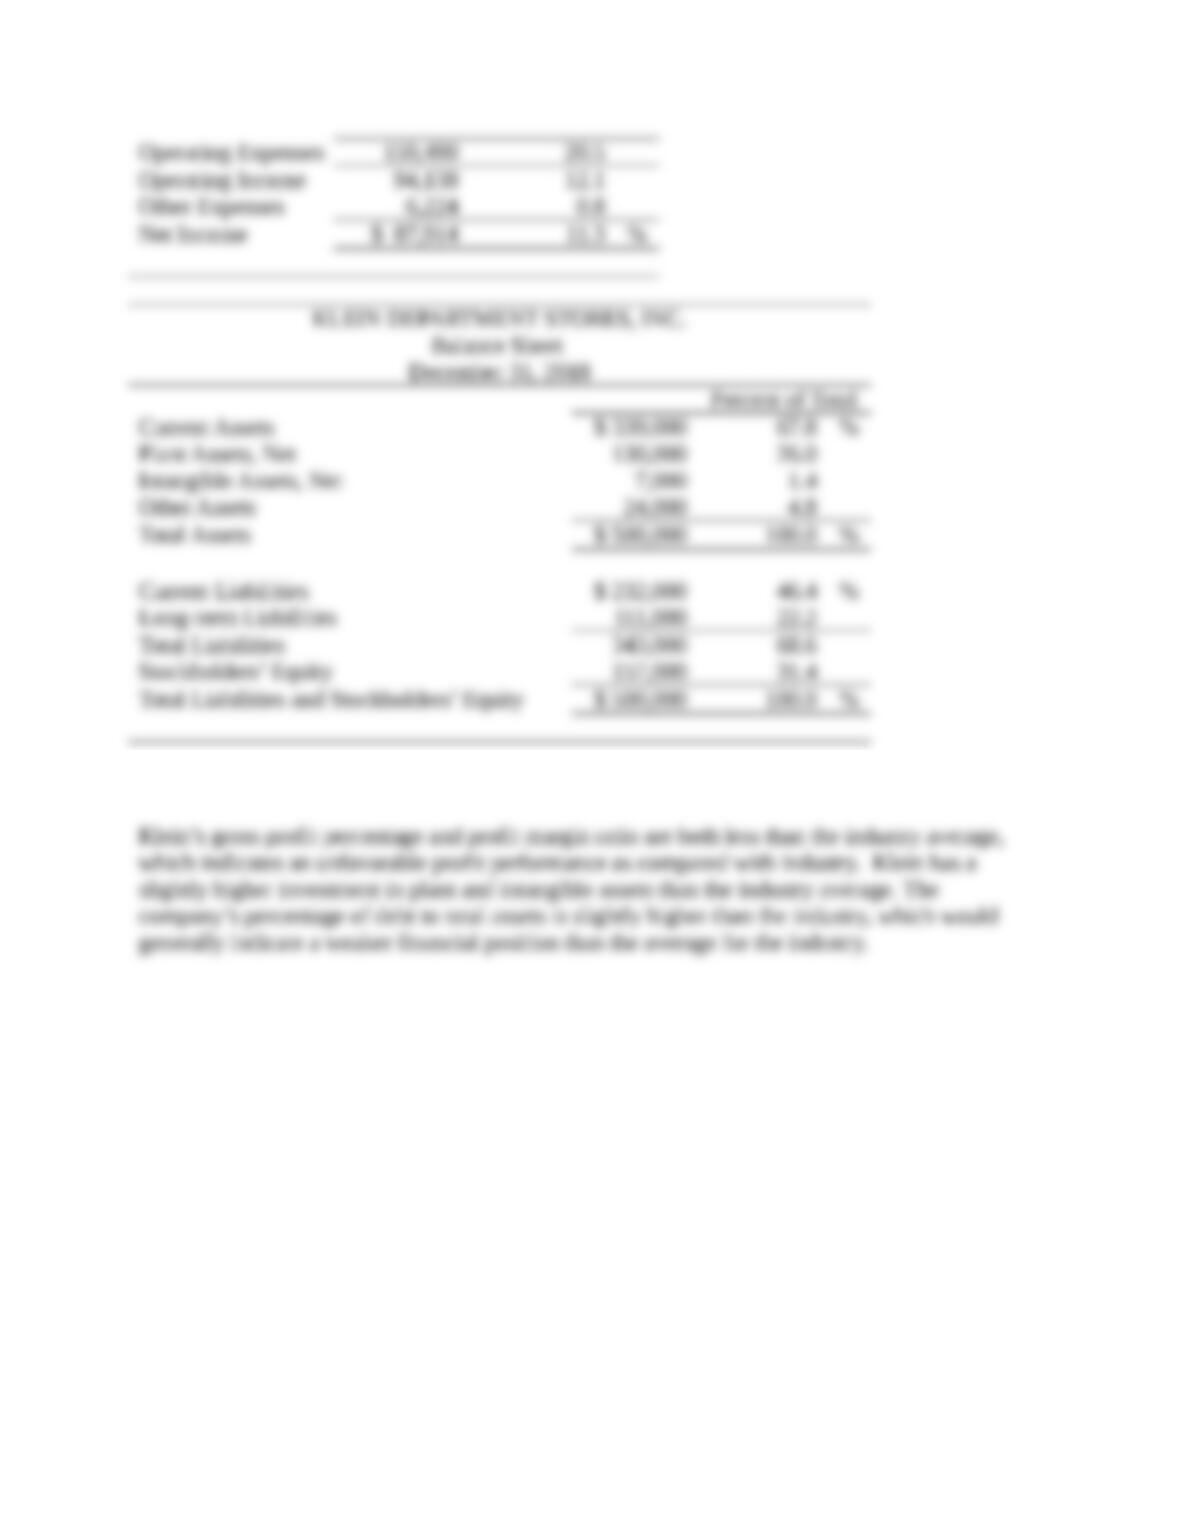
1. Prepare a vertical analysis for Klein for both its income statement and balance sheet.
2. Compare the company’s profit performance and financial position with the average for the
industry.
P15-24A, cont.
SOLUTION
Requirement 1
Requirement 2
P15-25A Preparing common-size statements, analysis of profitability and financial position,
comparison with the industry, and using ratios to evaluate a company
Learning Objectives 3, 4
2. Gross Profit Percentage 32.6%
Consider the data for Klein Department Stores presented in Problem P15-24A.
Requirements
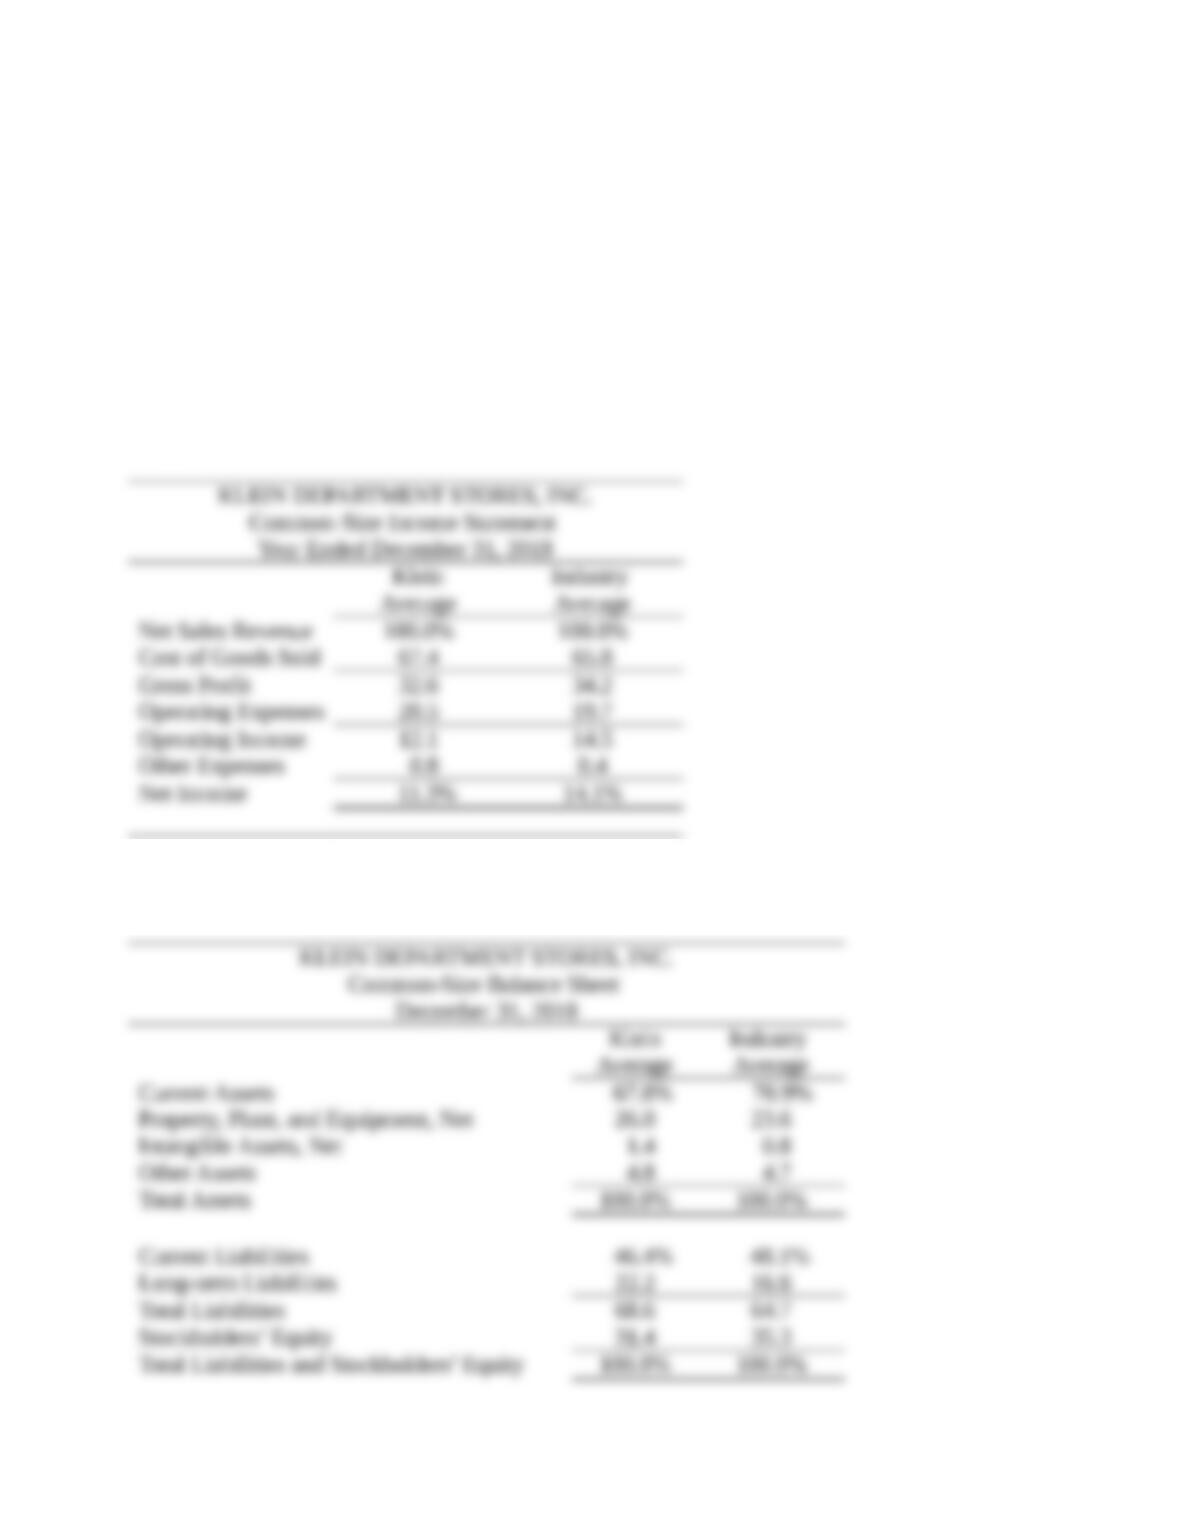
1. Prepare a common-size income statement and balance sheet for Klein. The first column of
each statement should present Klein’s common-size statement, and the second column, the
industry averages.
2. For the profitability analysis, compute Klein’s (a) gross profit percentage and (b) profit
margin ratio. Compare these figures with the industry averages. Is Klein’s profit performance
better or worse than the industry average?
3. For the analysis of financial position, compute Klein’s (a) current ratio and (b) debt to equity
ratio. Compare these ratios with the industry averages. Assume the current ratio industry
average is 1.47, and the debt to equity industry average is 1.83. Is Klein’s financial position
better or worse than the industry averages?
SOLUTION
Requirement 1
P15-25A, cont.
Requirement 1, cont.
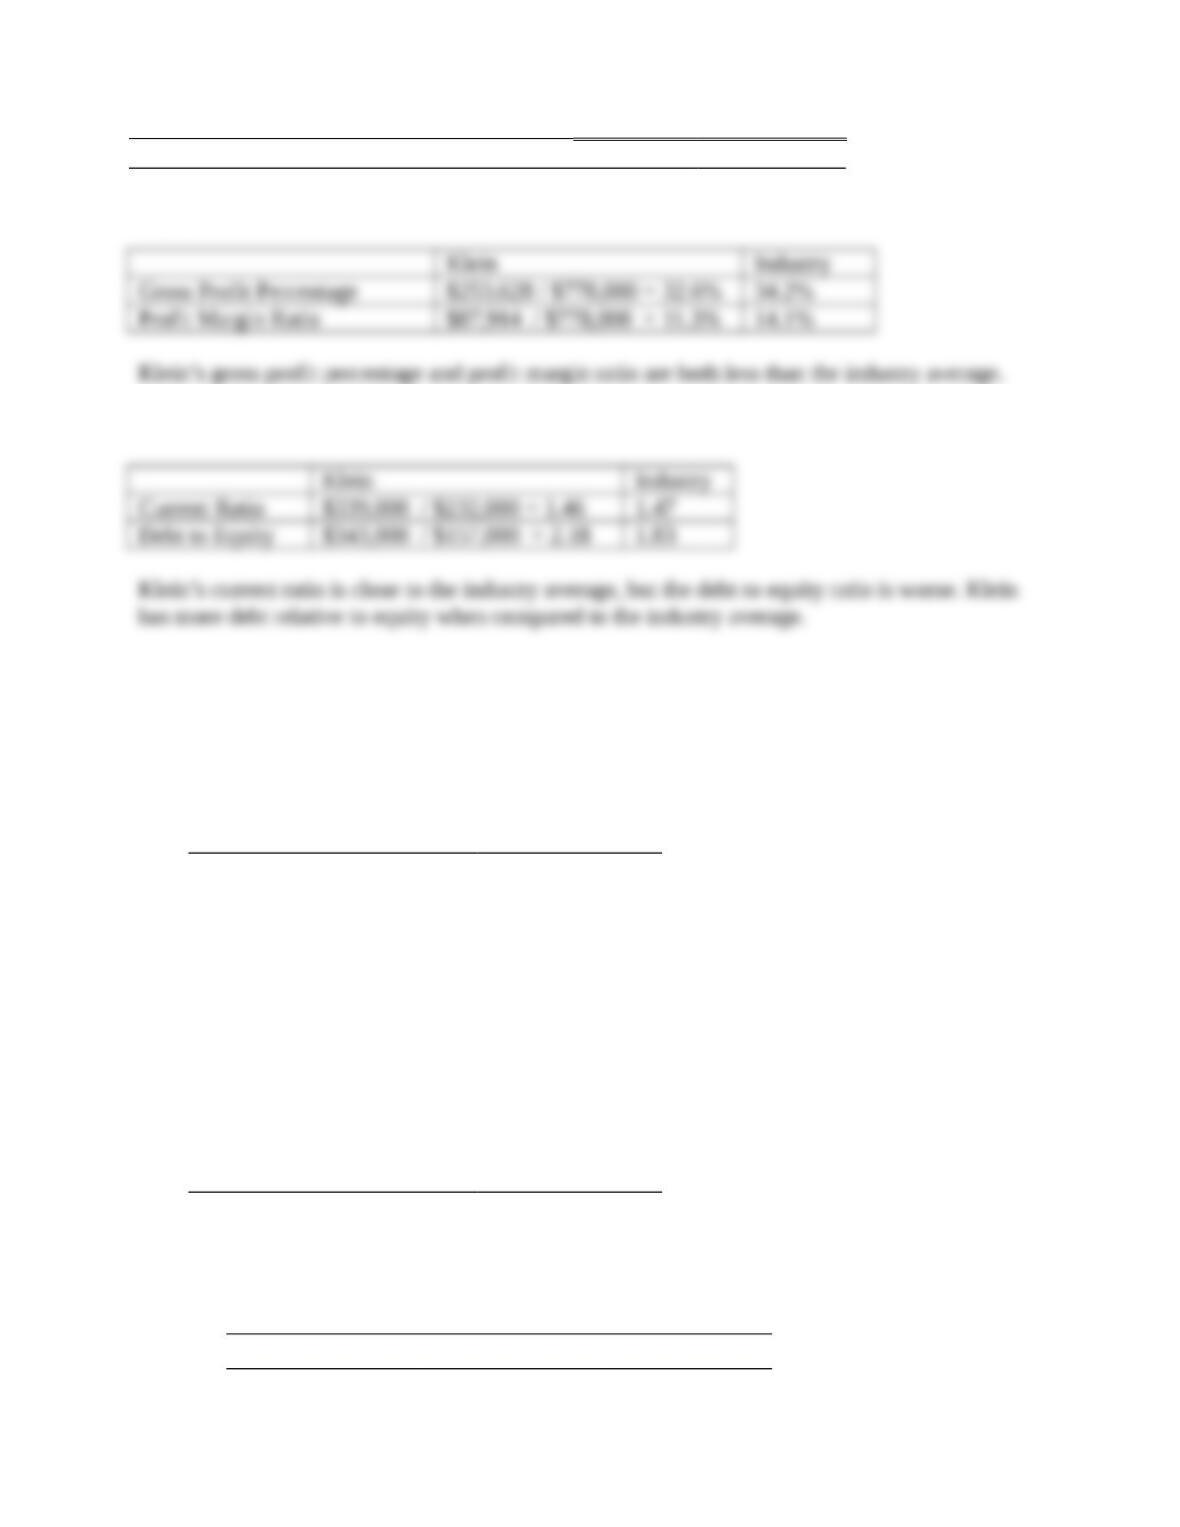
Requirement 2
Requirement 3
P15-26A Determining the effects of business transactions on selected ratios
Learning Objective 4
1. Current Ratio 1.55
Financial statement data of Style Traveler Magazine include the following items:
Cash $ 23,000
Accounts Receivable, Net 81,000
Merchandise Inventory 185,000
Total Assets 635,000
Accounts Payable 99,000
Accrued Liabilities 37,000
Short-term Notes Payable 51,000
Long-term Liabilities 224,000
Net Income 68,000
Common Shares Outstanding 20,000 shares
Requirements
1. Compute Style Traveler’s current ratio, debt ratio, and earnings per share. Round all ratios to
two decimal places, and use the following format for your answer:
Current Ratio Debt Ratio Earnings per Share
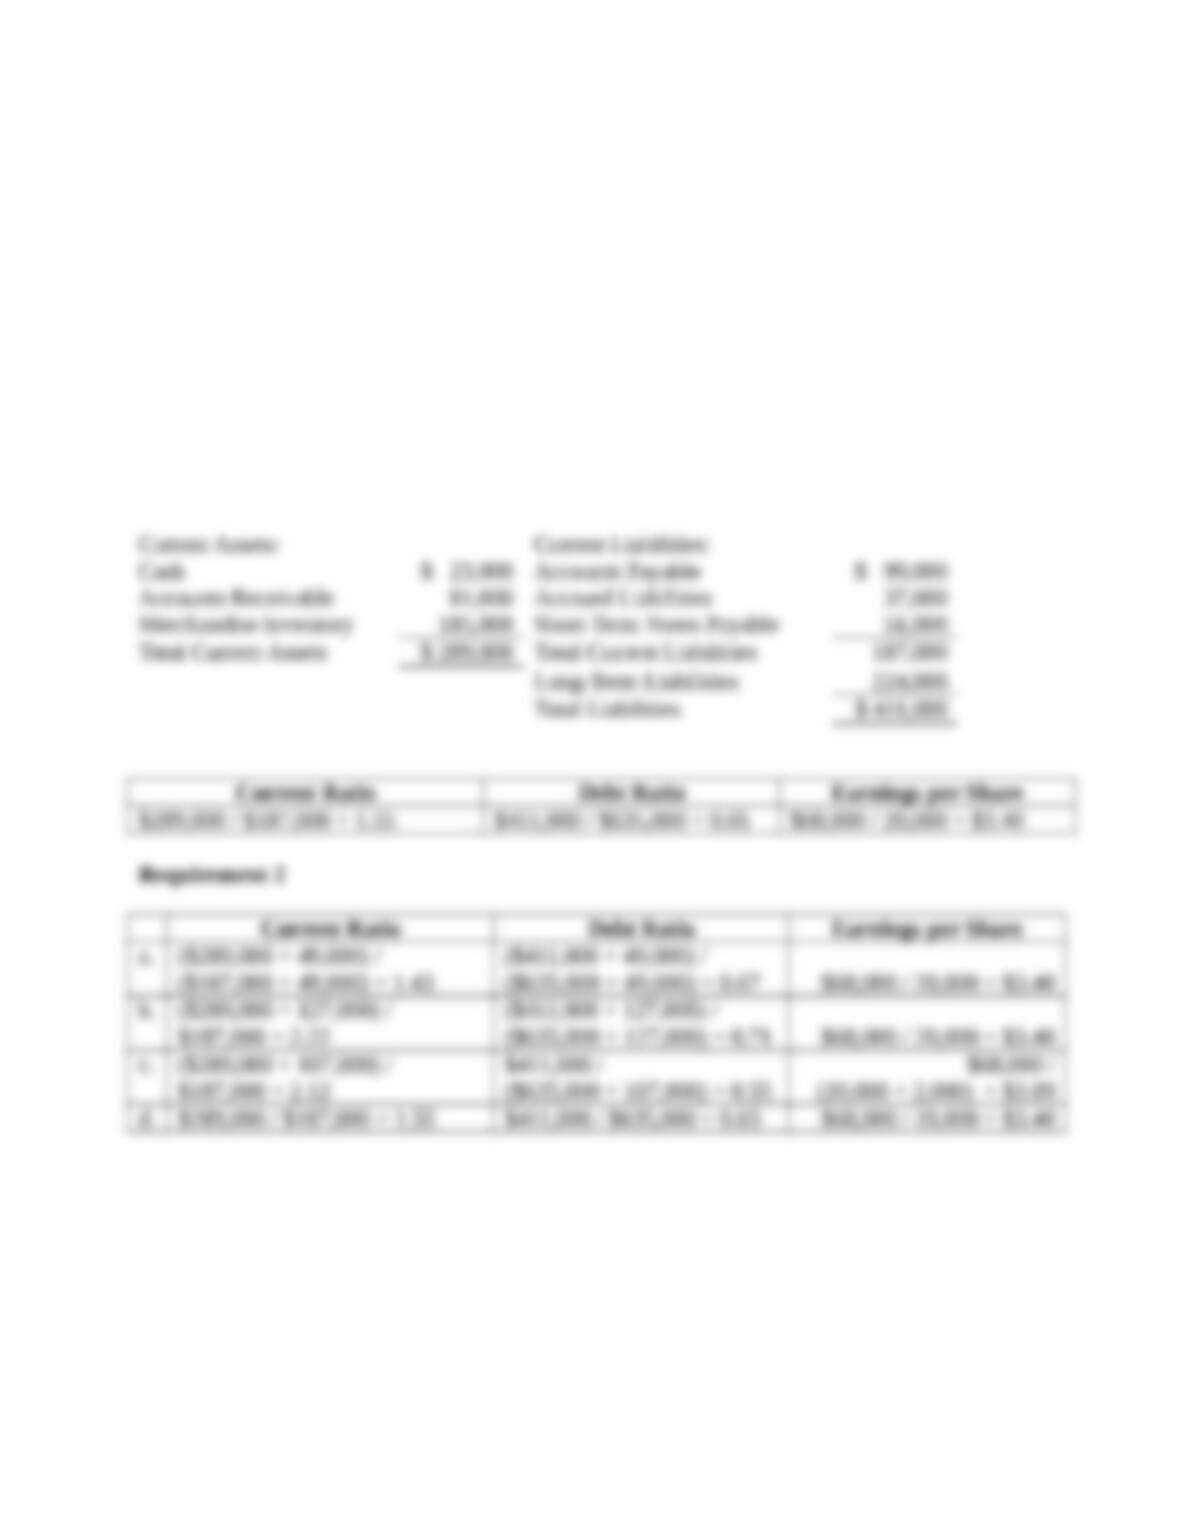
2. Compute the three ratios after evaluating the effect of each transaction that follows. Consider
each transaction separately.
a. Purchased merchandise inventory of $49,000 on account.
b. Borrowed $127,000 on a long-term note payable.
c. Issued 2,000 shares of common stock, receiving cash of $107,000.
d. Received cash on account, $5,000.
P15-26A cont.
SOLUTION
Requirement 1
P15-27A Using ratios to evaluate a stock investment
Learning Objective 4
1. 2018: e. 48.9%
Comparative financial statement data of Sanfield, Inc. follow:
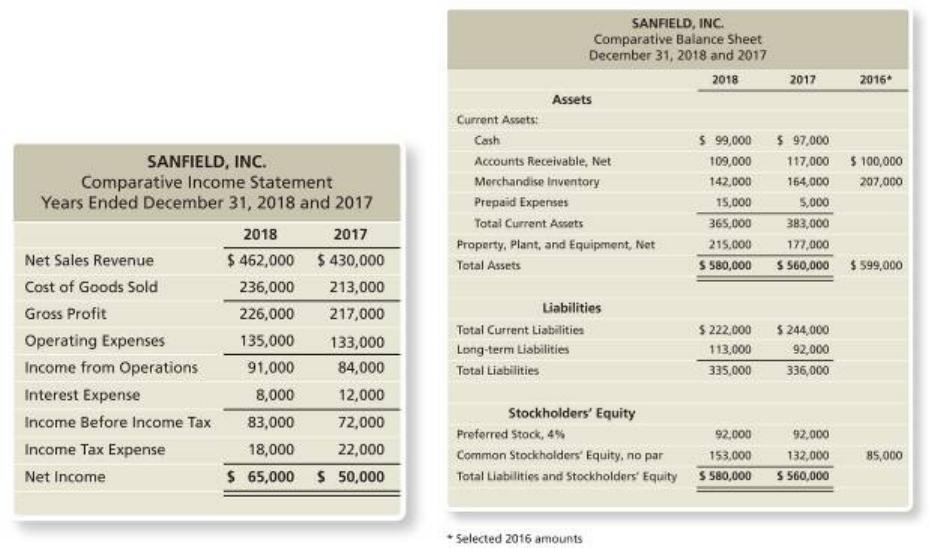
1. Market price of Sanfield’s common stock: $51.48 at December 31, 2018, and $37.08 at
December 31, 2017.
2. Common shares outstanding: 16,000 on December 31, 2018 and 15,000 on December 31,
2017 and 2016.
3. All sales are on credit.
Requirements
1. Compute the following ratios for 2018 and 2017:
a. Current ratio
b. Cash ratio
c. Times-interest-earned ratio
d. Inventory turnover
e. Gross profit percentage
f. Debt to equity ratio
g. Rate of return on common stockholders’ equity
h. Earnings per share of common stock
i. Price/earnings ratio
P15-27A, cont.
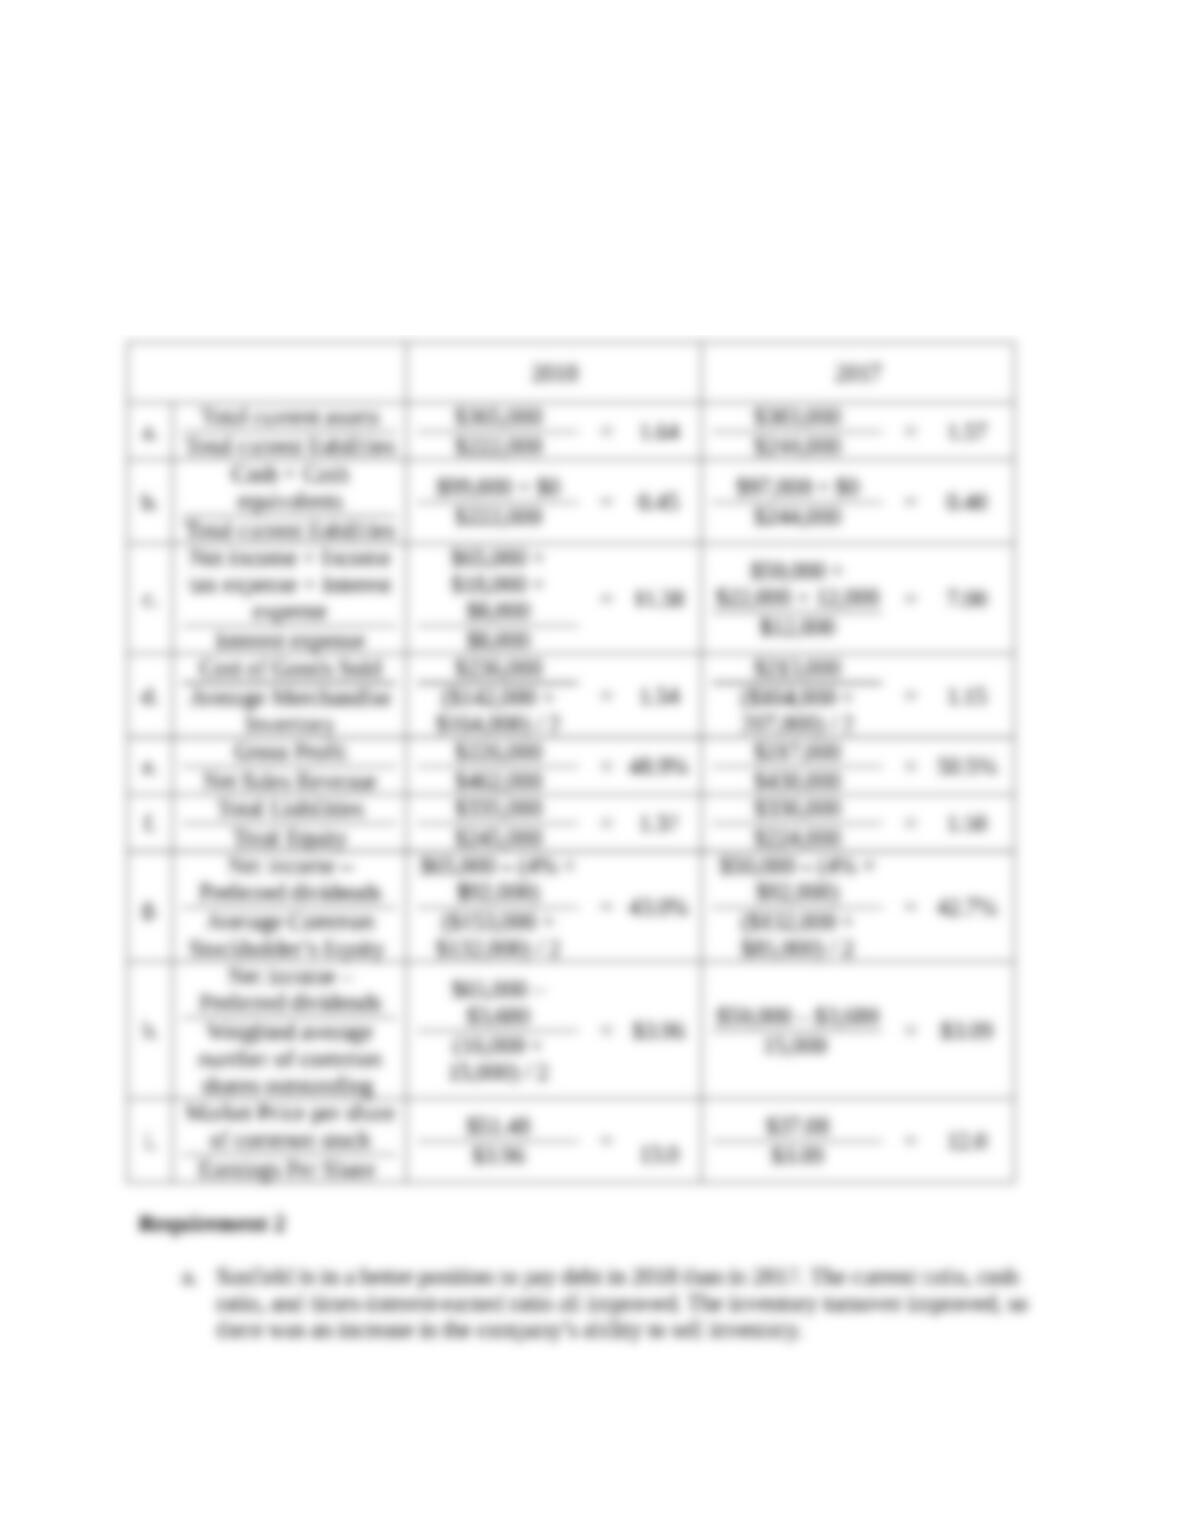
2. Decide (a) whether Sanfield’s ability to pay debts and to sell inventory improved or
deteriorated during 2018 and (b) whether the investment attractiveness of its common stock
appears to have increased or decreased.
SOLUTION
Requirement 1

P15-28A Using ratios to decide between two stock investments
Learning Objective 4
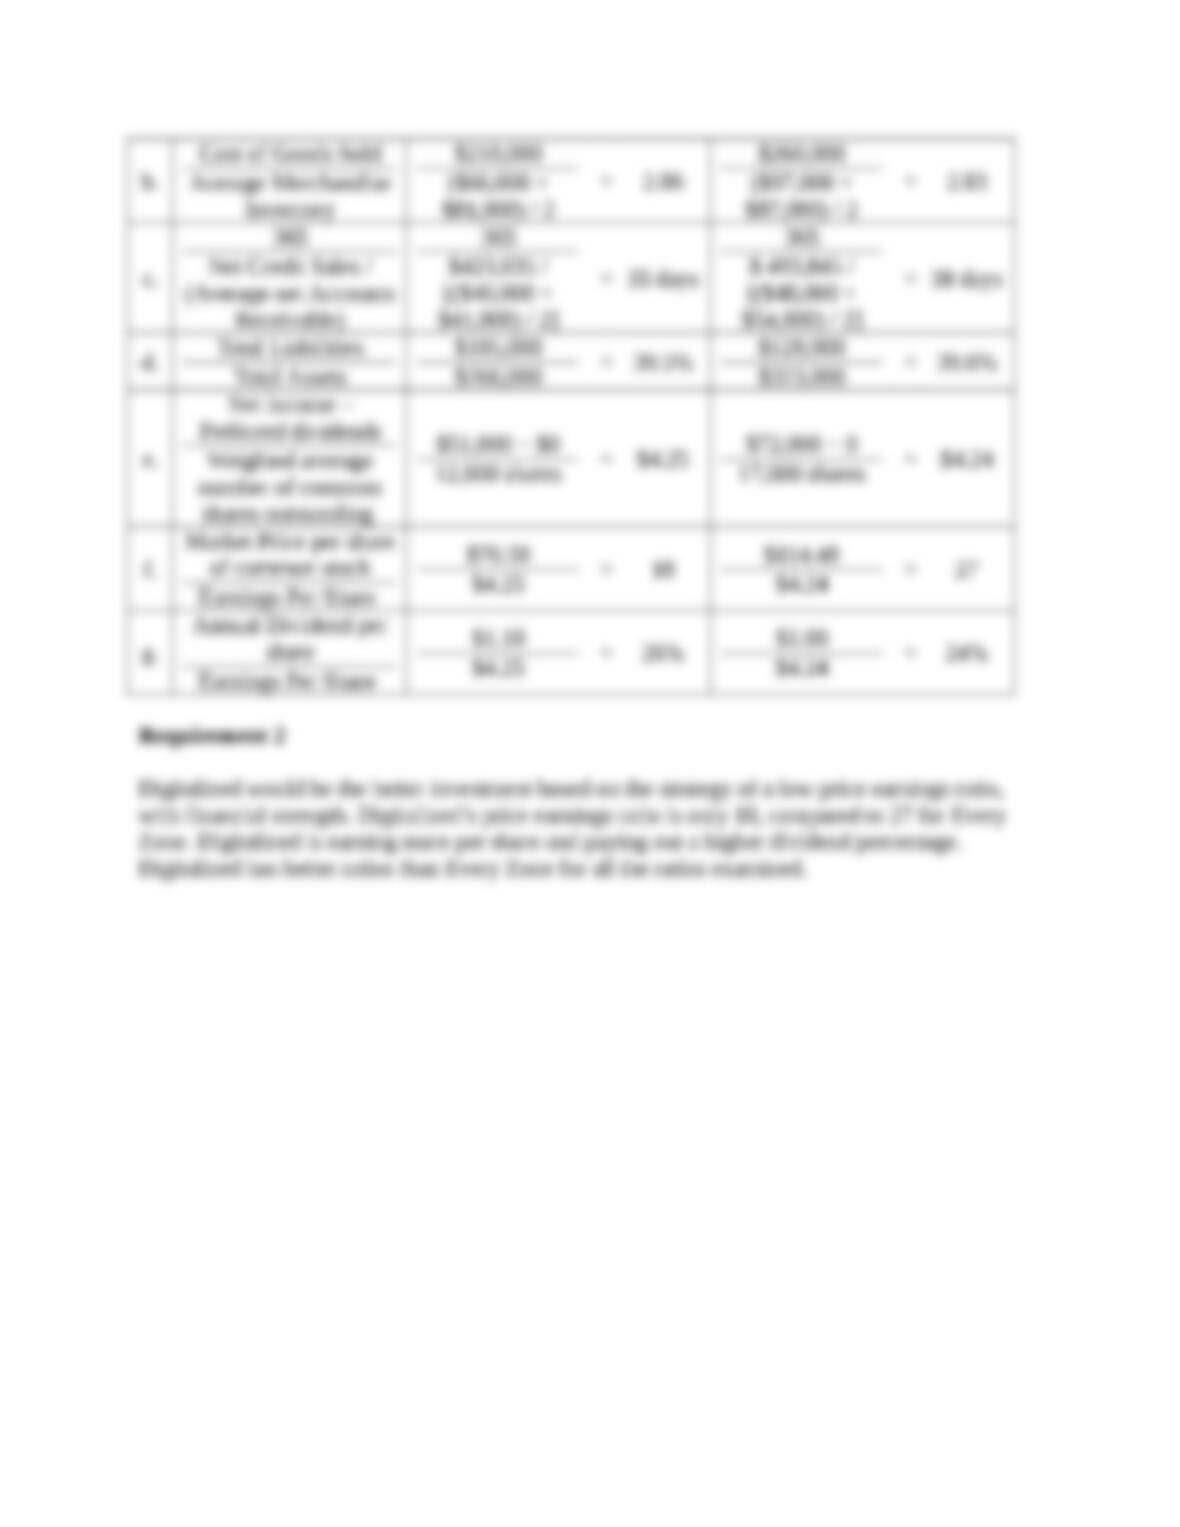
1. Digitalized e. $4.25
Assume that you are purchasing an investment and have decided to invest in a company in the
digital phone business. You have narrowed the choice to Digitalized Corp. and Every Zone, Inc.
and have assembled the following data.
Selected income statement data for the current year:
Digitalized Every Zone
Net Sales Revenue (all on credit) $ 423,035 $ 493,845
Cost of Goods Sold 210,000 260,000
Interest Expense 0 19,000
Net Income 51,000 72,000
Selected balance sheet and market price data at the end of the current year:
Digitalized Every Zone
Current Assets:
Cash $ 24,000 $ 17,000
Short-term Investments 40,000 14,000
Accounts Receivable, Net 40,000 48,000
Merchandise Inventory 66,000 97,000
Prepaid Expenses 23,000 12,000
Total Current Assets $ 193,000 $ 188,000
Total Assets $ 266,000 $ 323,000
Total Current Liabilities 105,000 96,000
Total Liabilities 105,000 128,000
Common Stock:
$1 par (12,000 shares) 12,000
$1 par (17,000 shares) 17,000
Total Stockholders’ Equity 161,000 195,000
Market Price per Share of Common Stock 76.50 114.48
Dividends Paid per Common Share 1.10 1.00
Selected balance sheet data at the beginning of the current year:
P15-28A, cont.
Digitalized Every Zone
Balance Sheet:
Accounts Receivable, net $ 41,000 $ 54,000
Merchandise Inventory 81,000 87,000
Total Assets 261,000 272,000
Common Stock:
$1 par (12,000 shares) 12,000
$1 par (17,000 shares) 17,000
Your strategy is to invest in companies that have low price/earnings ratios but appear to be in
good shape financially. Assume that you have analyzed all other factors and that your decision
depends on the results of ratio analysis.
Requirements
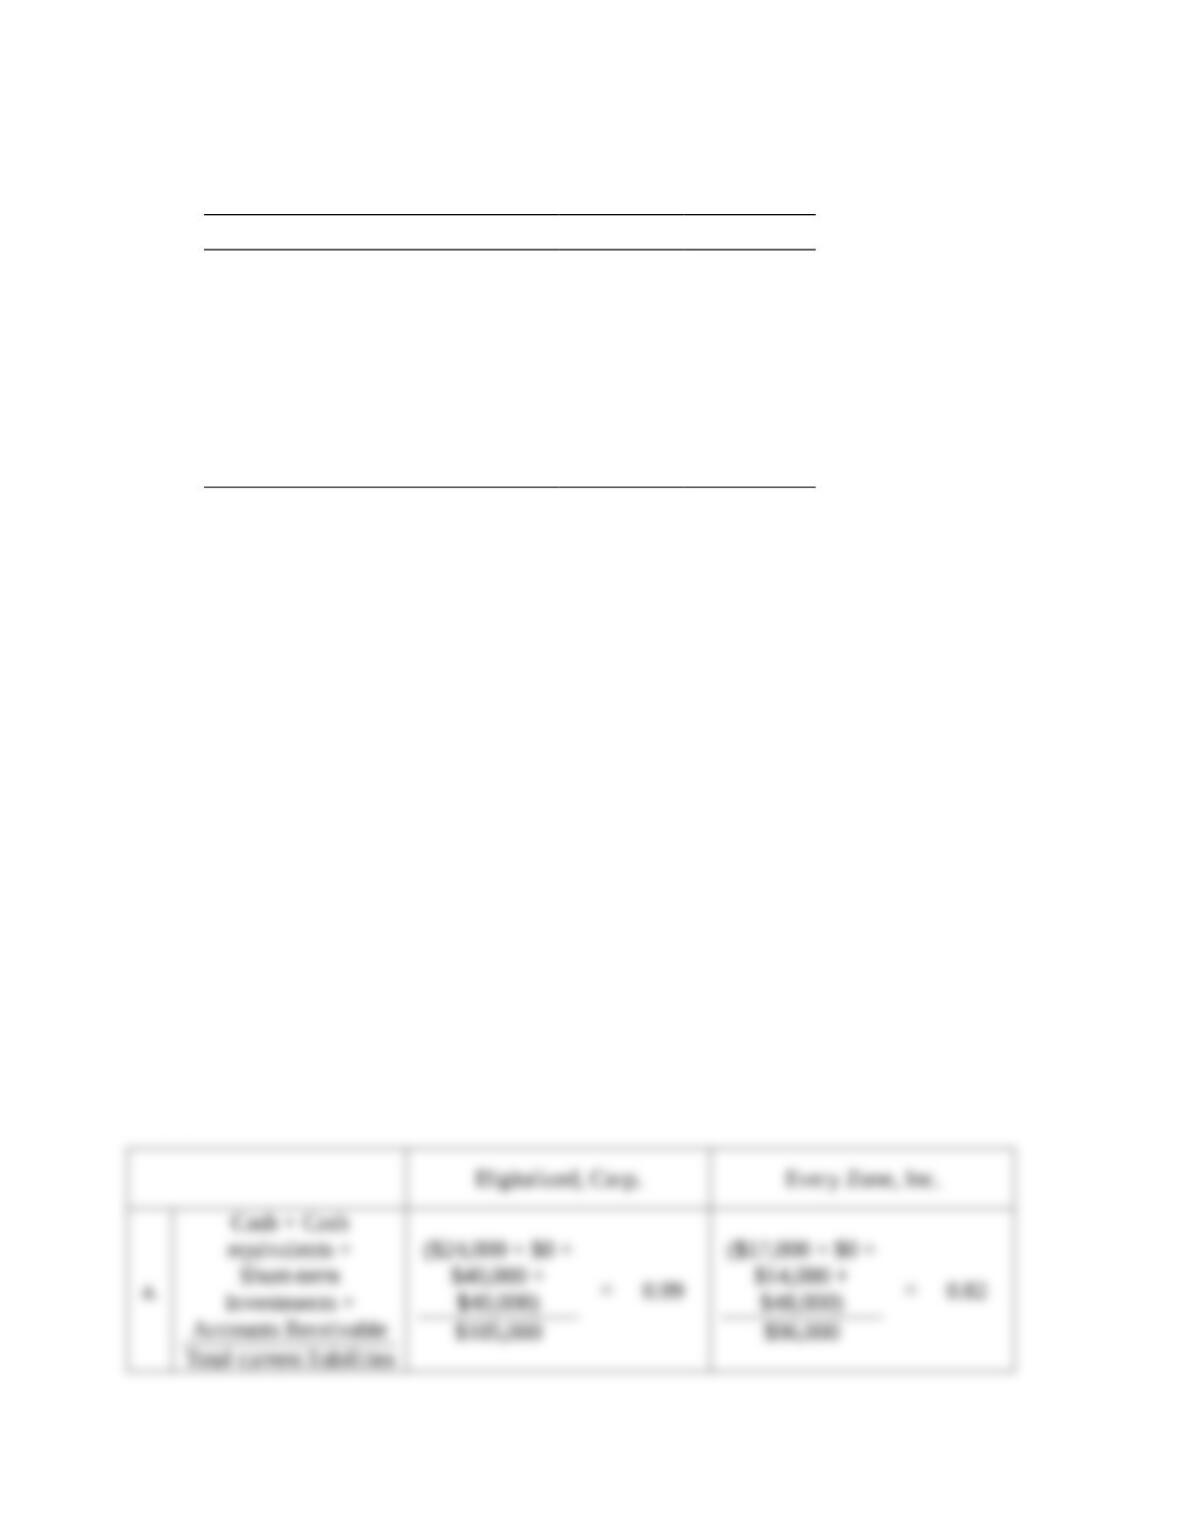
1. Compute the following ratios for both companies for the current year:
a. Acid-test ratio
b. Inventory turnover
c. Days’ sales in receivables
d. Debt ratio
e. Earnings per share of common stock
f. Price/earnings ratio
g. Dividend payout
2. Decide which company’s stock better fits your investment strategy.
P15-28A, cont.
SOLUTION
Requirement 1