Part 4
Risk and the Required Rate of Return
Chapters in this Part
Chapter 8 Risk and Return
Chapter 9 The Cost of Capital
Integrative Case 4: Eco Plastics Company

Chapter 8
Risk and Return
Instructor’s Resources
Chapter Overview
This chapter focuses on the fundamentals of risk and return—beginning with simple definitions of total and
expected return, risk neutral, risk averse, and risk seeking. The discussion then moves to risk measurement by
focusing on a single asset and measuring risk with statistics associated with a probability distribution—
namely, mean, standard deviation, and coefficient of variation. To demonstrate that insights about risk for a
single asset do not necessarily carry through to a collection of assets, the discussion broadens to risk and
return for a portfolio. Diversification is introduced through examination of risk for a portfolio of positively
correlated, negatively correlated, and uncorrelated assets. The key takeaway is that the volatility (risk) of a
portfolio will be less than a weighted average of the volatilities of the assets in the portfolio as long as the
correlation is less than 1.0. The potential for risk-reduction through international diversification is offered as an
intuitive example. These ideas are used to motivate the Capital Asset Pricing Model (CAPM). Diversifiable
and nondiversifiable risk are distinguished, with the key idea that the market only rewards bearing
nondiversifiable risk because firm-specific risk can so easily be eliminated through diversification. Then, the
CAPM equation and its pictorial representation (Security Market Line or SML) are introduced to show the
link between return and nondiversifiable risk. The chapter concludes by illustrating the impact of changes in
inflation expectations and investor risk aversion on the SML.
Suggested Answer to Opener-in-Review
You learned Bill Miller’s investment performance ranged from the very bottom to the very top of his
profession, thereby suggesting his fund took more risk than other mutual funds. The table below shows the
2009 to 2012 annual returns for Miller’s Opportunity fund and the S&P 500 index.
Year Opportunity Fund S&P 500
2009 76.0% 26.5%
2010 16.6% 15.1%
2011 –34.9% 2.11%
2012 39.6% 16.0%
Calculate average annual return for the Opportunity fund and S&P 500. Which performed better over this
period? If you had invested $1,000 in each fund January 1, 2009, how much money would you have had at
the end of 2012? Calculate the standard deviations of returns for the two funds. Which was more volatile?
Average annual return on Opportunity = (76.0% + 16.6% − 34.9% + 39.6%) 4 = 97.30% 4 = 24.33%.
Average annual return on S & P 500 = (26.5% + 15.1% + 2.11% + 16.0%) 4 = 59.71% 4 = 14.93%.
The Opportunity Fund performed better. A $1,000 investment in Opportunity January 1, 2009 would have
, where rj is return in year j (running to year n) and is average return over n years.

For the Opportunity Fund:
higher the standard deviation of S&P 500 returns.
Answers to Review Questions
8-1. Risk refers to the uncertainty about the return an investment will earn.
8-2 Total return (gain or loss) on an investment over a given time period is the change in value over that
Specifically:
8-3 a. Risk-averse investors dislike risk and, therefore, expect higher returns on riskier
investments.
Most financial managers are risk averse—they expect compensation for bearing additional risk. Risk
tolerance refers an investor’s degree of risk aversion, that is the specific compensation she requires for
8-4. Scenario analysis assesses asset risk using more than one possible set of returns to gauge the variability
of outcomes. Range—a measure of variability—is found by subtracting the pessimistic outcome from
8-5 Decision makers can estimate risk with a plot of the probability distribution—which relates probabilities
to potential returns by showing the dispersion in returns. The wider the distribution of potential returns,
8-6. The standard deviation of a distribution of asset returns is an absolute measure of dispersion of risk
around the mean or expected value. A higher standard deviation more variable returns.
8-7 The coefficient of variation (CV)—another risk indicator—is the standard deviation on an asset’s
8-8 An efficient portfolio offers the maximum return for a given risk level. Portfolio return is just the
weighted average of returns on individual assets in the portfolio. Specifically:

portfolio
The standard deviation of a portfolio is not the weighted average of the standard deviations of
component assets. Rather, it is calculated with the standard-deviation formula, using portfolio returns
8-9 The correlation between asset returns is key to evaluating the effect of a new asset on portfolio risk.
Returns on different assets that move in the same direction are positively correlated, while those
moving in opposite directions are negatively correlated. Unless the returns on assets in a portfolio are
8-10 Adding foreign assets to a domestic portfolio can reduce risk for the same reason a portfolio of two
domestic assets can have less risk than one asset: returns on foreign investments are not perfectly
declines, thereby producing lower dollar returns. If the appreciation is traceable to a strong U.S.
economy, foreign-currency-denominated portfolios will generally have lower returns in local currency
8-11 The total risk of a security is measured by the standard deviation of returns; it has two components –
nondiversifiable risk and diversifiable risk. Diversifiable risk refers to the portion of risk attributable to
is the only relevant risk because diversifiable risk can be easily eliminated by forming a portfolio of
8-12 Beta measures the nondiversifiable risk of a specific asset or portfolio; it is an index of the co-
movement of an asset’s return with the market return. The beta coefficient for an asset can be found by
plotting the asset’s historical returns relative to the returns for the market and using statistical
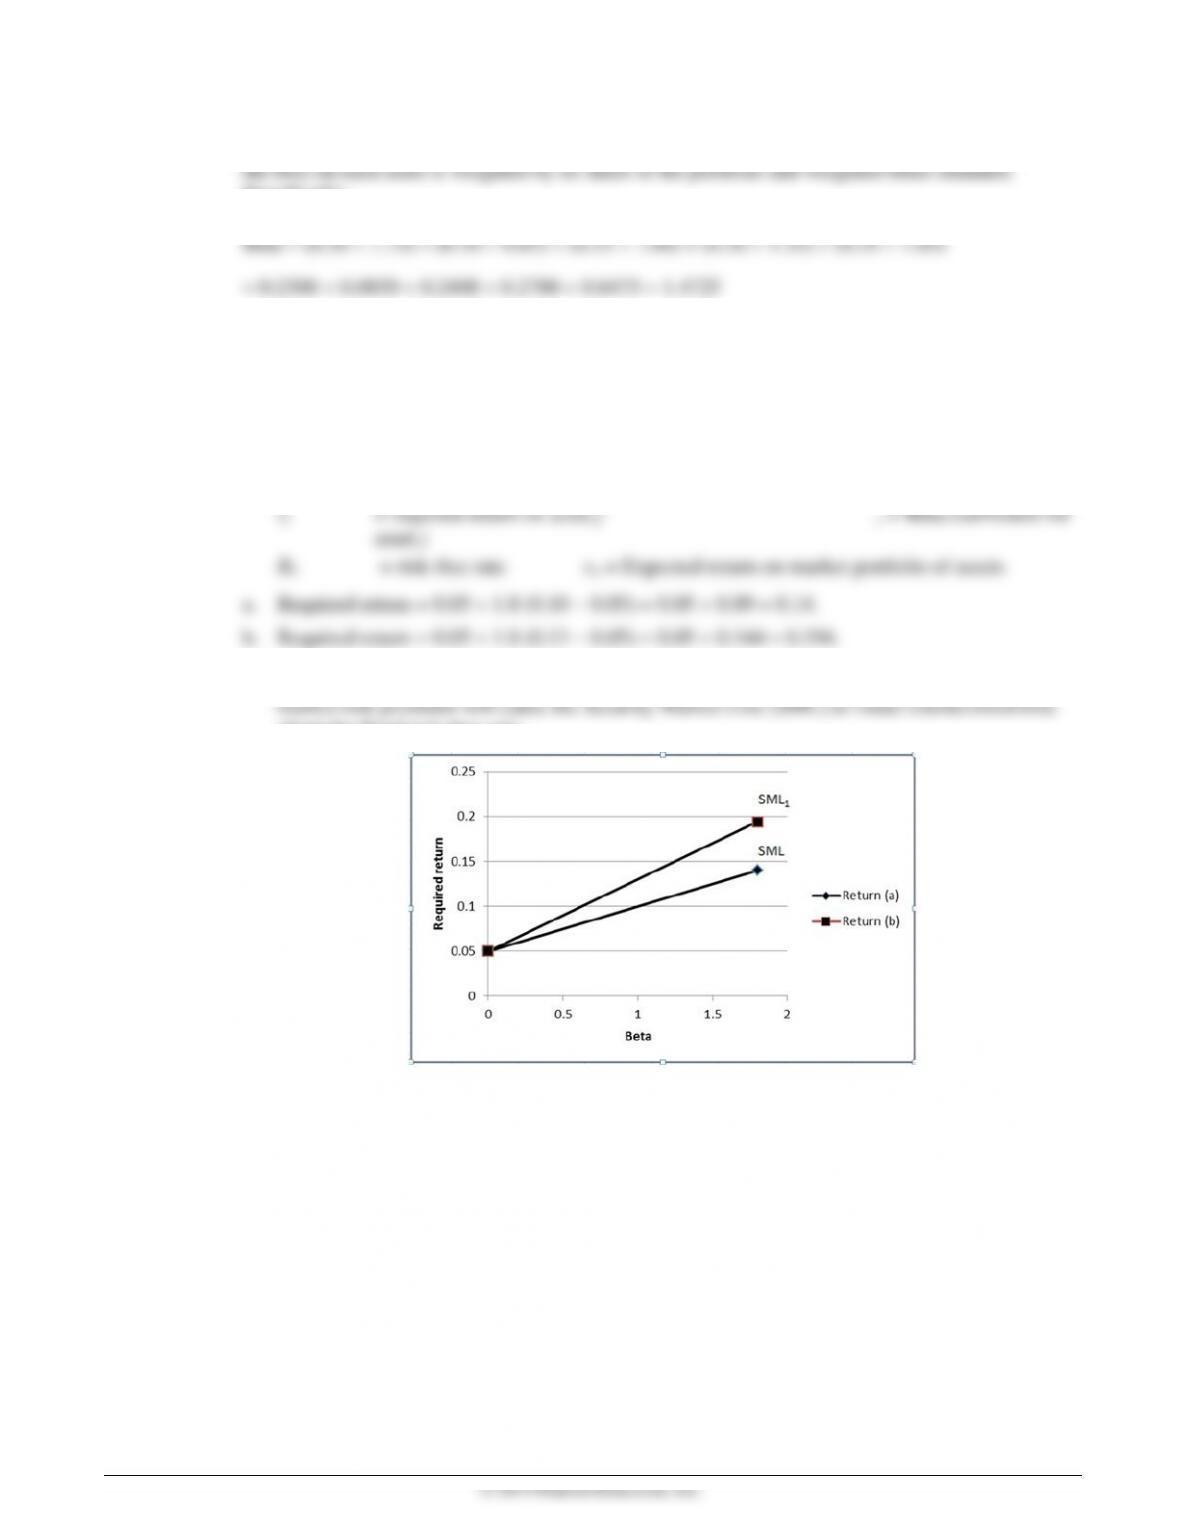
8-13 The capital asset pricing model (CAPM) is given by:
rj RF [βj(rm RF)]
where:

while required return is on the vertical axis.
8-14 a. An increase in inflationary expectations shifts the SML upwards by an amount equal to
b. If investors become less risk averse, the slope of the SML (beta coefficient) will decline—that is
required for each level of risk.
Suggested Answer to Global Focus Box:
“An International Flavor to Risk Reduction”
International mutual funds do not include any domestic assets, whereas global mutual funds include both
foreign and domestic assets. How might this difference affect their correlation with U.S. equity mutual funds?
Global funds differ from international funds by investing in stocks and bonds around the world, including
U.S. securities. International funds, in contrast, invest in stocks and bonds around the world but not U.S
Suggested Answer to Focus on Ethics Box:
“If It Sounds Too Good to Be True, It Probably Is”
What are warning signs an investment advisor’s activities may be suspect? Both Ponzi and Madoff claimed
later they knew what they were doing was wrong, but they expected to earn enough eventually to deliver on
their promises. Do you believe them?
Academic research on the investment performance of actively managed funds has produced two consistent
findings: (i) after adjusting for differences in fees, active funds do not—on average—outperform passive
consistently over a long stretch, particularly if the explanation offered is a new, proprietary strategy. As for
believing Ponzi and Madoff, of course, it is impossible to know what was in their hearts. But successful scam
Answers to Warm-Up Exercises
E8-1 Total annual return (LG 1)
Answer: Total return is given by: where:
rt = actual rate of return during period t Pt = price (value) of
asset at time t
is irrelevant to the problem.
E8-2 Expected return (LG 2)
Answer: Expected return on Flourine Chemical stock is the weighted-average return, meaning each
analyst’s prediction is weighted by the probability assigned; then weighted values are summed.
Specifically:
Analyst Probability Return Weighted
Value
1 0.35 5% 1.75%
2 0.05 5% 0.25%
E8-3 Comparing the risk of two investments (LG 2)
Answer: The coefficient of variation is given by: where:
σ = standard deviation of returns on the investment = average return on
the investment.
Based on standard deviations and coefficients of variation, Investment 2 has lower risk if held in
isolation. That said, neither standard deviation nor coefficient of variation decomposes measured
E8-4 Computing the expected return of a portfolio (LG 3)
Answer: Expected return on the portfolio is the weighted-average of the expected returns on portfolio
components. Put another way, expected return on each asset is weighted by its percentage of the
portfolio and then weighted values are summed. Specifically:
E8-5 Calculating a portfolio beta (LG 5)
Answer: Portfolio beta is just the weighted average of betas of individual portfolio components, meaning
Specifically:
E8-6 Calculating the required rate of return (LG 6)
Answer: The CAPM equation can be used to find required return, given an asset’s beta, the risk-free rate,
and market return. Specifically:
where:
c. The risk-free rate does not change, but market return increases. The resulting rise in the
about the fixed risk-free rate..