Solutions to Problems
P4-1 Depreciation (LG 2; Basic)
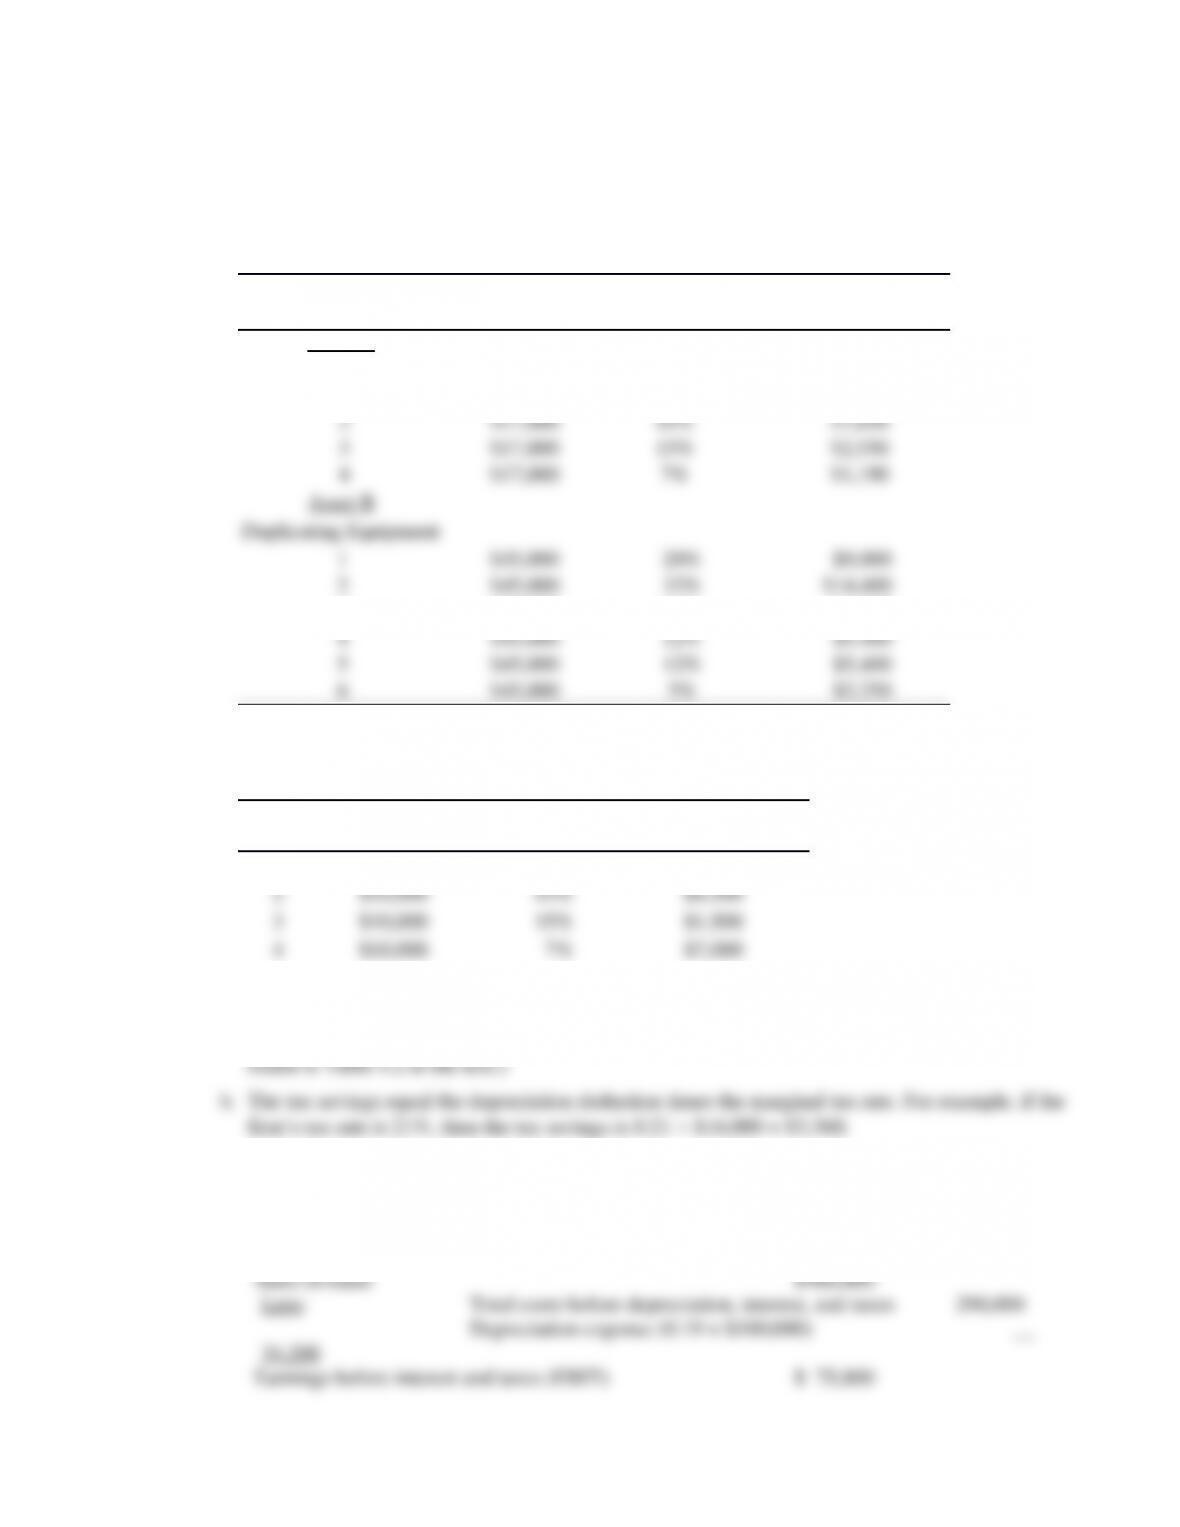
Depreciation Schedule
Year Cost (1) Percentages
from Table 4.2 (2) Depreciation
(3) = [(1) (2)]
Asset A
Research Equipment
1 $17,000 33% $5,610
3 $45,000 19% $8,550
P4-2. Depreciation (LG 2; Basic)
Depreciation Schedule – Cork stopper machine
Year (1) Cost (2) Table 4.2
Percentages Depreciation
(3) = (1) (2)
1 $10,000 33% $3,300
P4-3. MACRS depreciation expense, taxes, and cash flow (LG 2 and LG 3; Challenge)
a. Depreciation expense $80,000 0.20 $16,000 (MACRS depreciation percentages can be
P4-4 Depreciation and cash flow (LG 2 and LG 3; Intermediate)
a. Operating cash flow (OCF) = [Earnings before interest and taxes Tax rate)]
Depreciation
Alternatively, using a tax rate of 40%, which does not reflect the changes enacted in the Tax
Cuts and Jobs Act, the OCF would be $79,680.
b. Depreciation expense is an accounting entry to smooth the cost of an asset over time; there is
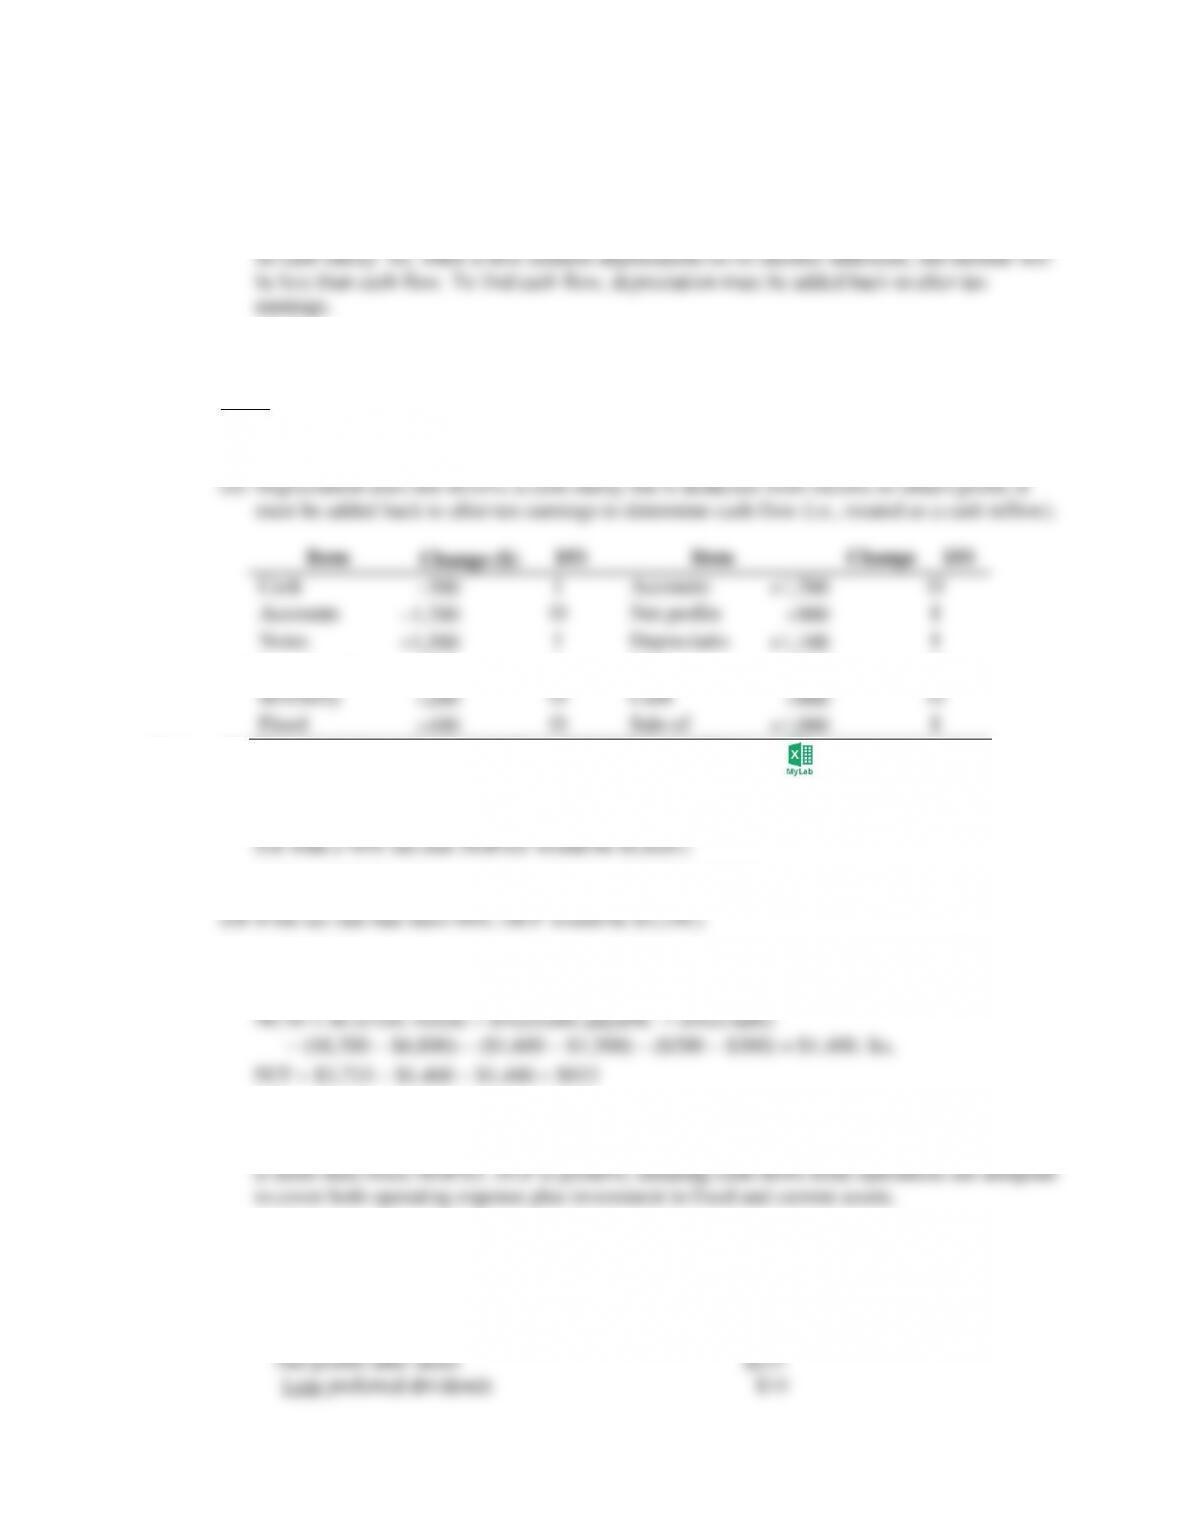
P4-5 Classifying cash inflows and outflows (LG 3; Basic)
Notes:
(i) Any reduction in an asset is a cash inflow because that cash has been released for another
purpose. Hence, the $300 decline in cash below is an inflow.
payable
n
Long-term
dividends
1,000 I
Repurchase
900 O
assets
stock
P4-6. Finding operating and free cash flows (LG 2; Intermediate)
a. Net operating profit after taxes (NOPAT)
Earnings before interest and taxes (EBIT) [1 Tax rate (T)] $2,700 (1 0.21) $2,133.
b. OCF NOPAT Depreciation $2,133 $1,600 $3,733
c. FCF OCF Net fixed asset investment (NFAI) Net current asset investment (NCAI)
NFAI = ∆Net fixed assets Depreciation = ($14,800 $15,000) $1,600 = $1,400
(Or again, if the tax rate is 40%, FCF becomes $420.)
d. Keith Corporation has positive cash flows from operating activities. Operating cash flow (OCF)
P4-7. Statement of cash flows (LG 3; Intermediate)
a. The change in stockholders equity of $157 on the balance sheet is entirely traceable to a $157
increase in retained earnings. No other equity accounts changed in 2019. From Tables 4.4, 4.5
and 4.6, the increase in retained earnings may be broken down as follows:
On the cash-flow statement, the entry for net profits after taxes appears as a positive $237 (cash
inflow) under “cash flow from operations.” The entry common/preferred dividends paid
Note: In the first-run printing of this book, the change in retained earnings was $100, not $157.
b. Other values are possible. For, example, the company could sell new stock for cash payment.
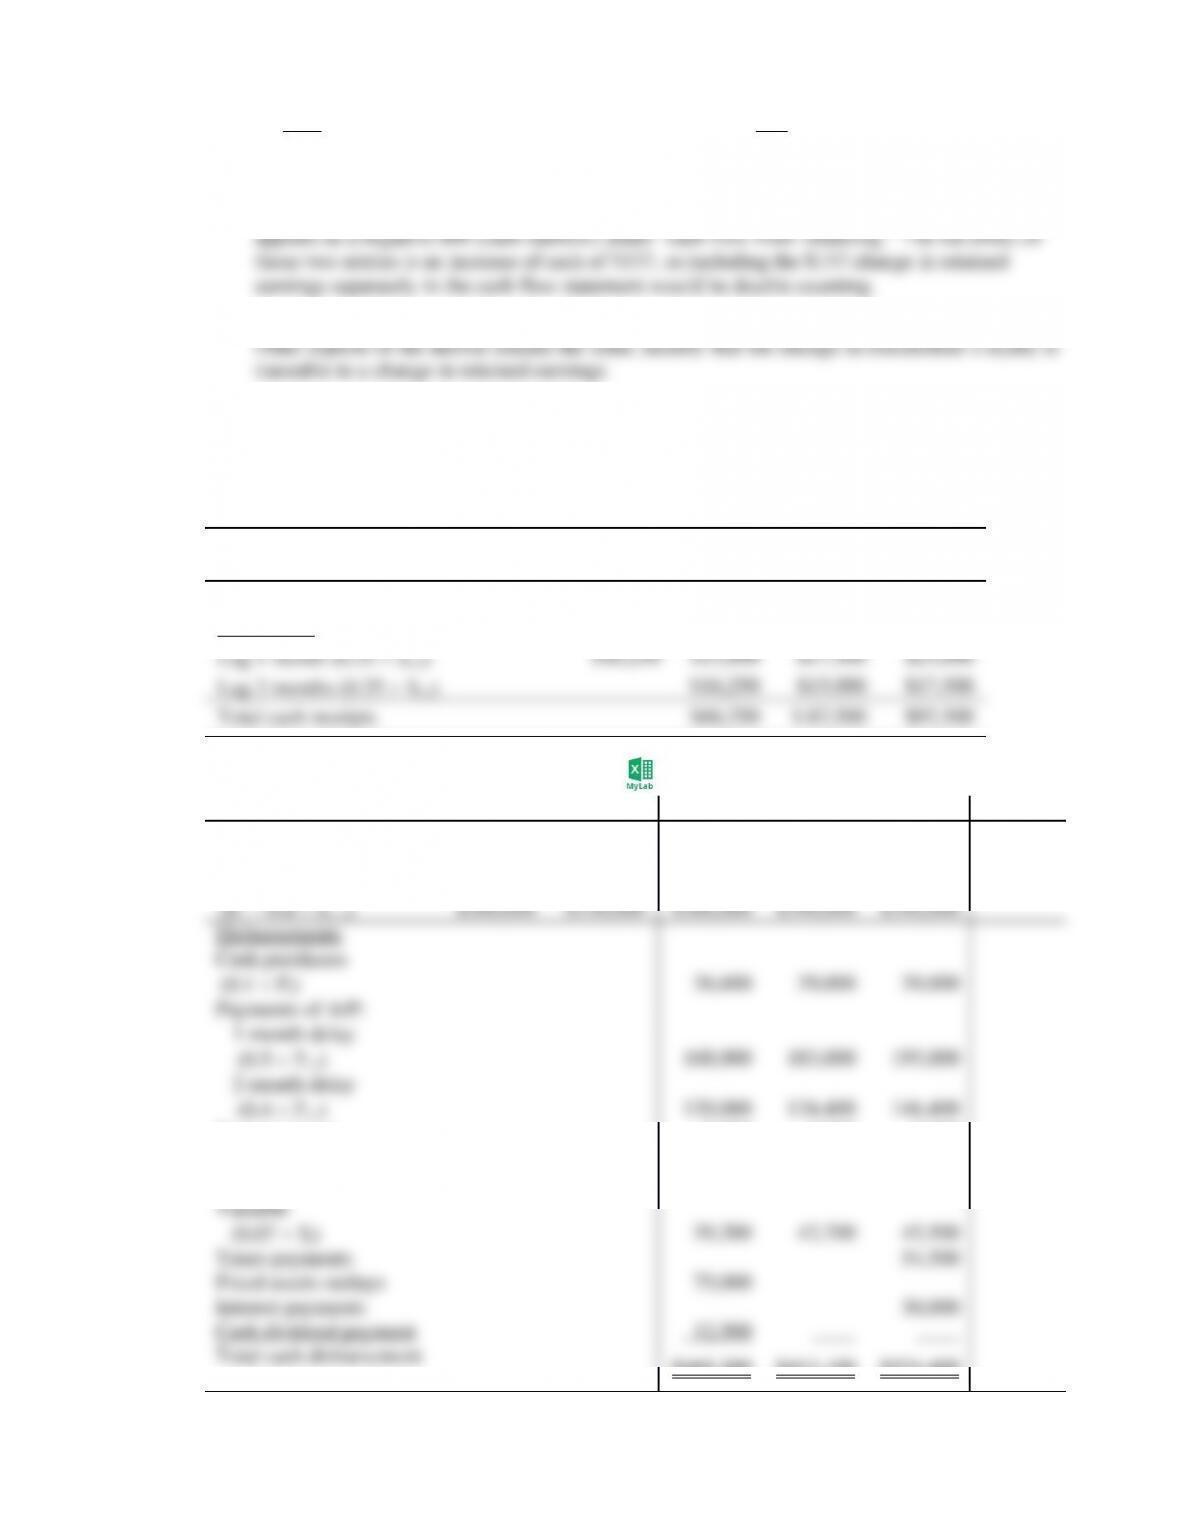
P4-8 Cash receipts (LG 4; Basic)
April May June July August
Sales (St) $65,000 $60,000 $70,000 $100,000 $100,00
0
Cash sales (0.50 St)$32,500 $30,000 $35,000 $50,000 $50,000
Collections:
P4-9. Cash disbursement schedule (LG4; Basic)
February March April May June July
Sales (St) $500,000 $500,000 $560,000 $610,000 $650,000 $650,00
0
Purchases
Rent payments 8,000 8,000 8,000
Wages & salary
Fixed 6,000 6,000 6,000
P4-10. Cash budget (LG 4; Basic)
March April May June July
Sales $50,000 $60,000 $70,000 $80,000 $100,000
Cash sales (0.2 St)) $10,000 $12,000 $14,000 $16,000 $20,000
Lag 1 month (0.6 St-1)36,000 42,000 48,000
Rent 3,000 3,000 3,000
March April May June July
Total cash receipts $62,000 $72,000 $84,000
Total cash disbursements 59,000 93,000 97,000
Net cash flow $ 3,000 ($21,000) ($13,000)
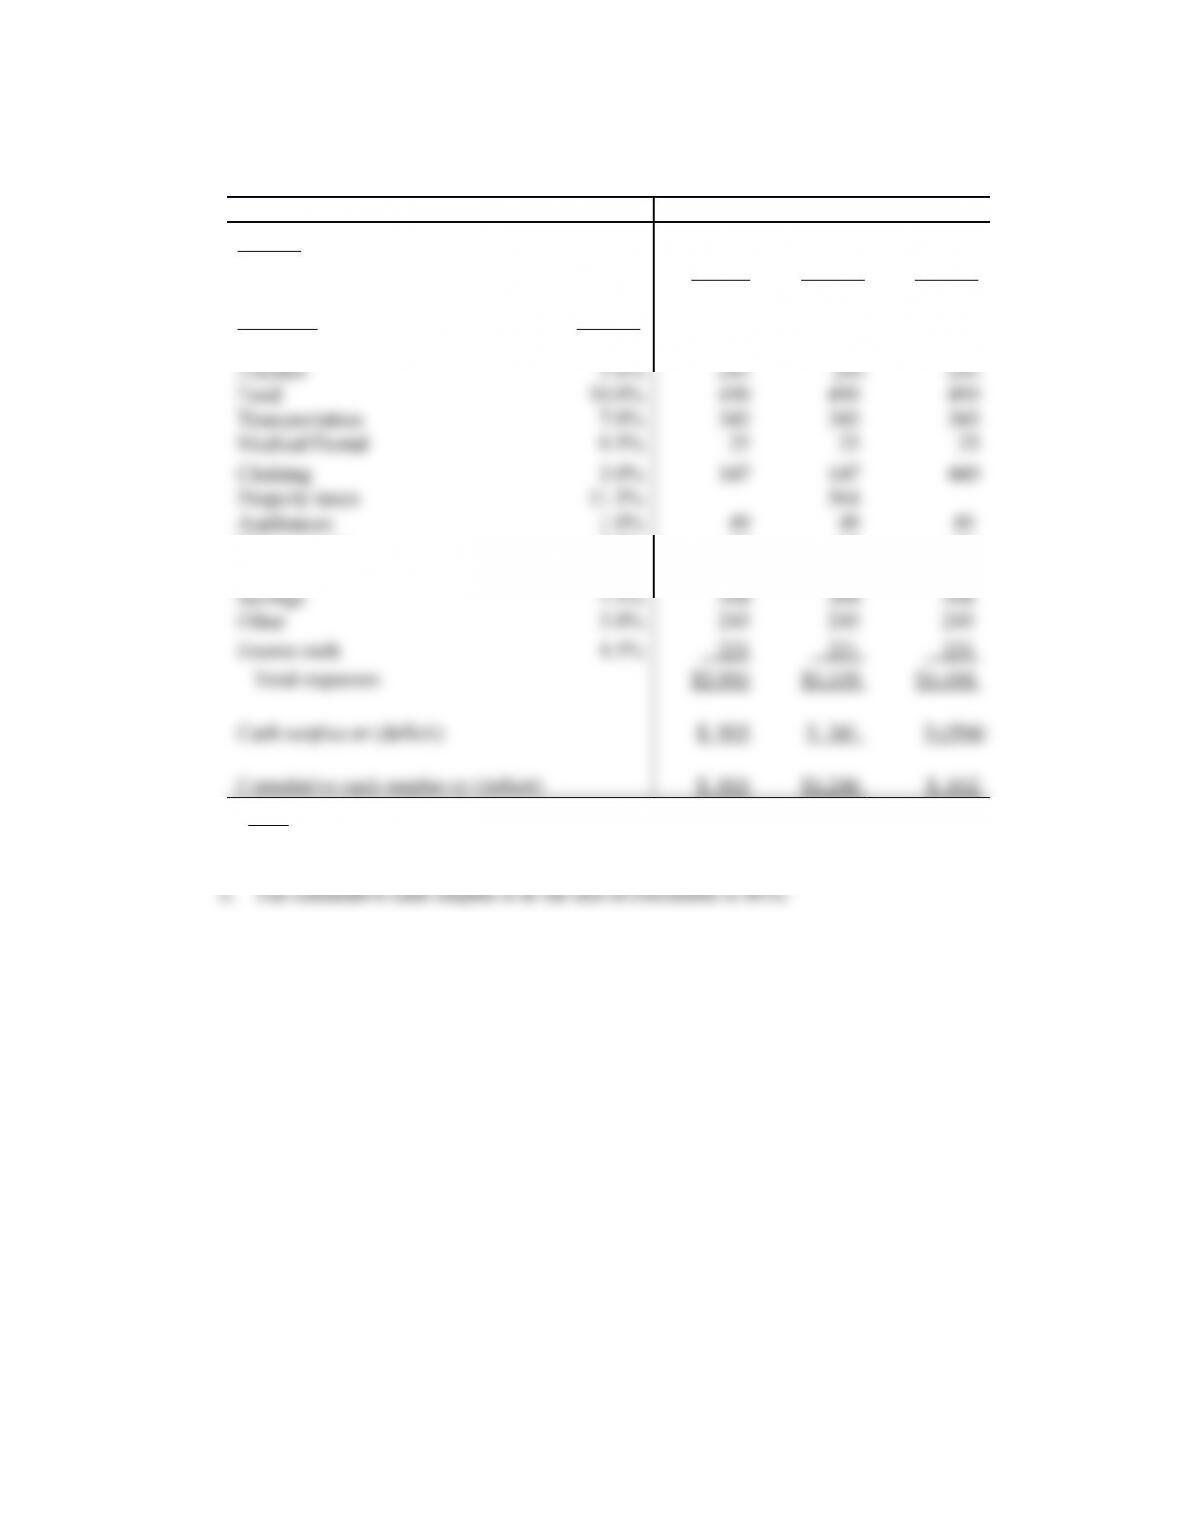
P4-11. Personal finance: Preparation of cash budget (LG 4; Basic)
a. Sam and Suzy Sizeman—Personal Budget
October – December 2020
October November December
Income
Take-home pay $4,900 $4,900 $4,900
Expenses Percent
Housing 30.0% $1,470 $1,470 $1,470
Personal care 2.0% 98 98 98
Entertainment 6.0% 294 294 1,500
Note: Amounts are rounded.
b. December is a deficit month.
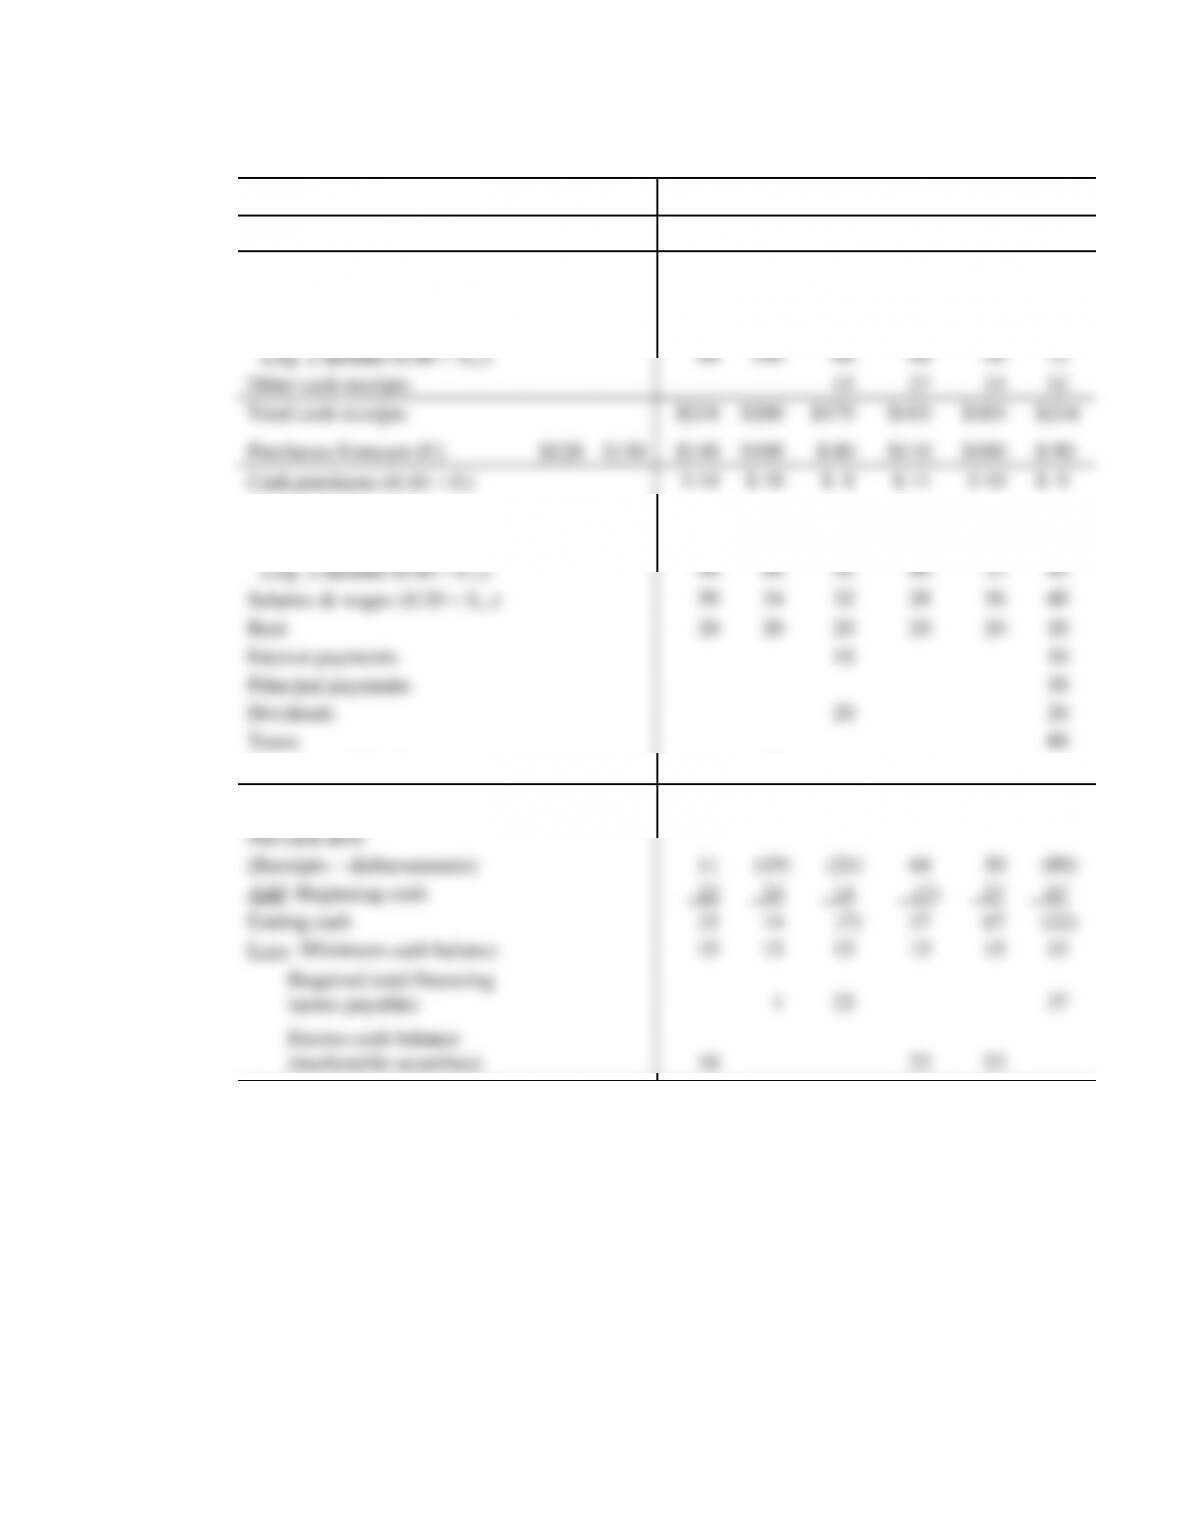
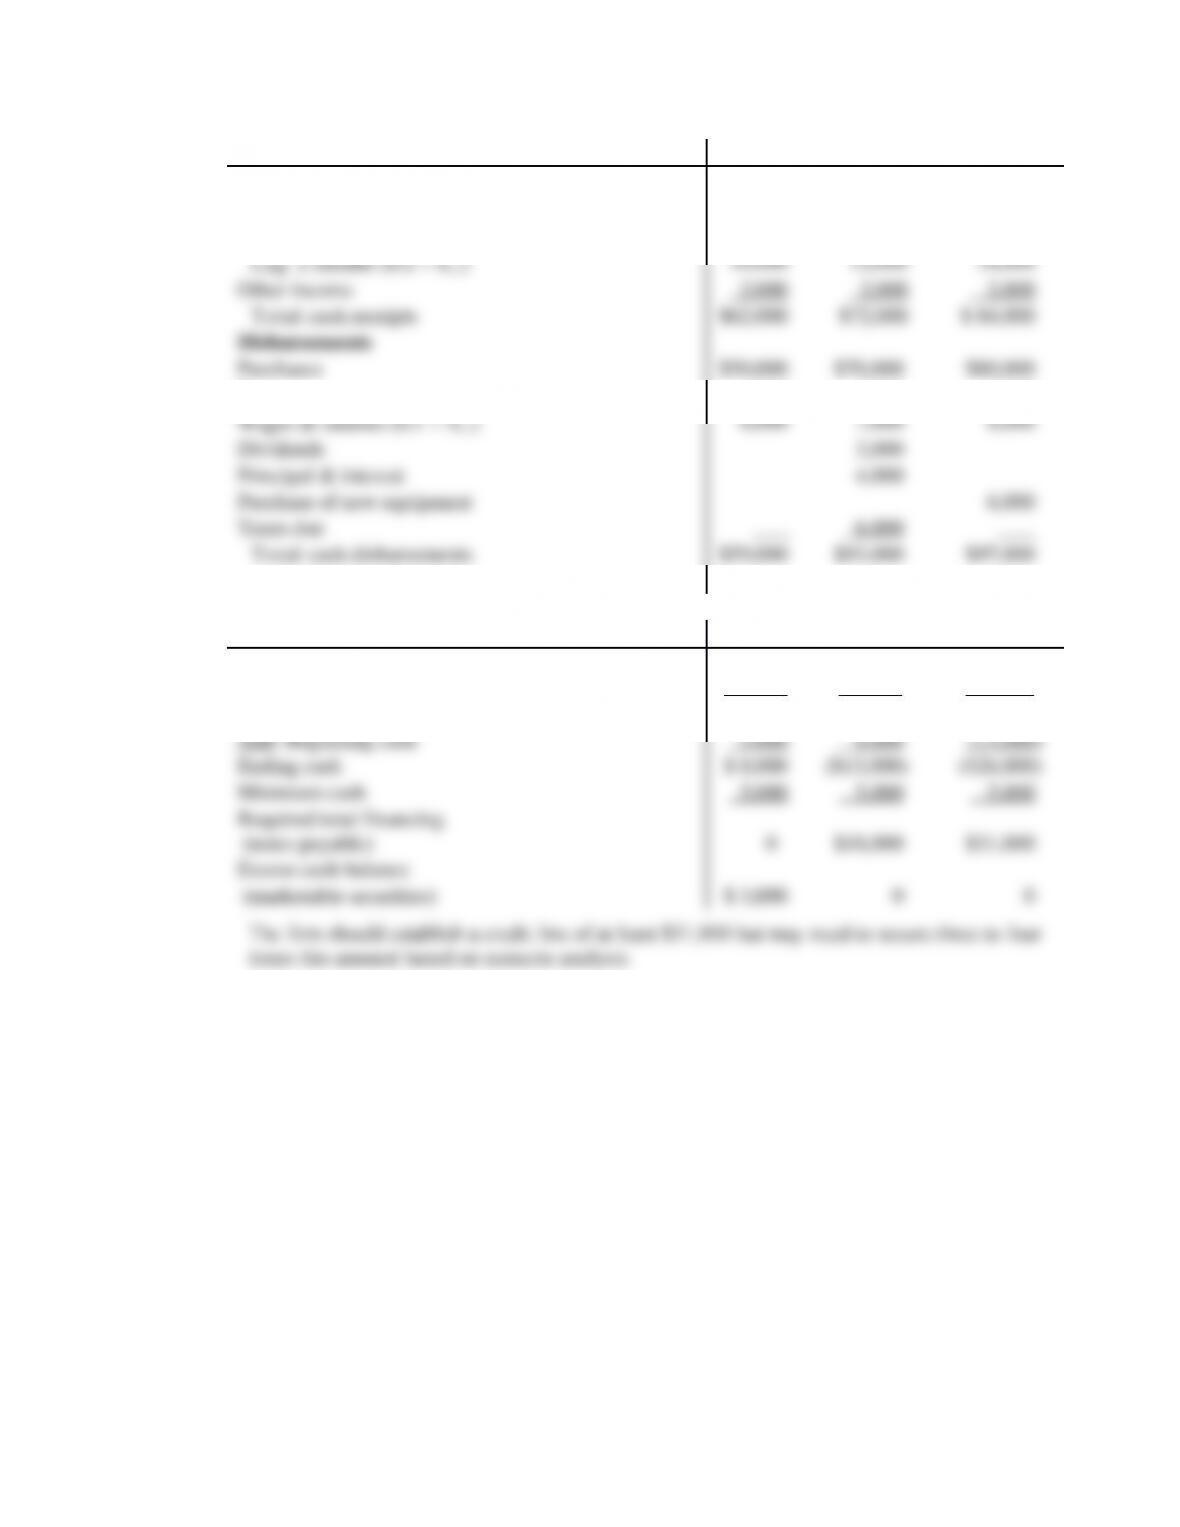
P4-12. Cash budgeting: Advanced (LG 4; Challenge)
a. and b. Xenocore, Inc.($000)
Sept. Oct. Nov. Dec. Jan. Feb. Mar. Apr.
Forecast of Sales St)$210 $250 $170 $160 $140 $180 $200 $250
Cash sales (0.20 St)$ 34 $ 32 $ 28 $ 36 $ 40 $ 50
Collections
Lag 1 month (0.40 St-1)100 68 64 56 72 80
Payments
Lag 1 month (0.50 Pt-1) 75 70 50 40 55 50
Purchases of fixed assets 25
Total cash disbursements $207 $219 $196 $139 $153 $303
b. The line of credit should be at least $37,000 to cover the maximum borrowing needs (for
April).
P4-13. Cash flow concepts (LG 4; Basic)
Note to instructor: There are a variety of possible answers to this problem, depending on student
assumptions. The question is designed to provoke discussion of differences among cash flows,
income, and assets.
Transaction Cash
Budget Pro Forma
Income Statement Pro Forma
Balance Sheet
Cash sale X X X
Credit sale X X X
Accounts receivable are collected X X
Asset with a five-year life is purchased X X
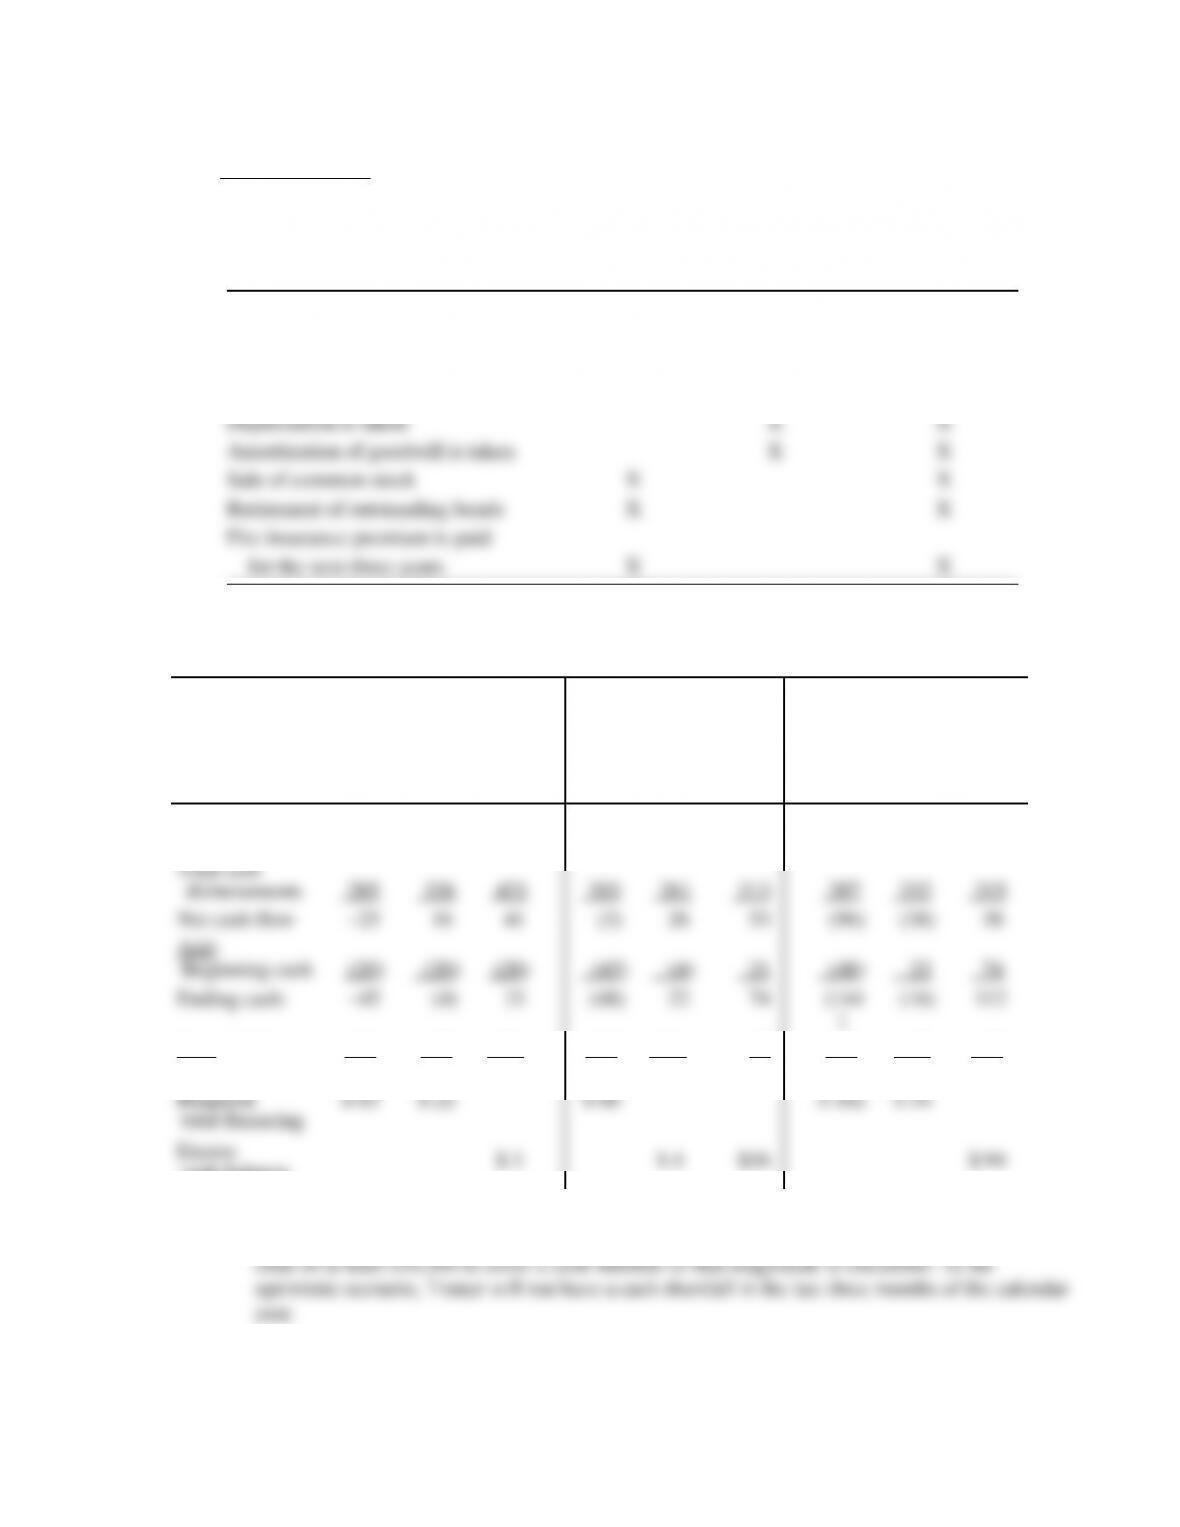
P4-14 Cash budget: Scenario analysis (LG 4; Intermediate)
a. Trotter Enterprises, Inc.—Multiple Cash Budgets ($000)
OCTOBER NOVEMBER DECEMBER
Pessi-
mistic Most
Likely Opti-
mistic Pessi
–
mistic
Mos
t
Likel
y
Opti-
mistic Pessi
–
misti
c
Most
Likel
y
Opti-
mistic
Total
cash receipts $260 $342 $462 $200 $287 $366 $191 $294 $353
Less minimum
cash balance 18 18 18 18 18 18 18 18 18
cash balance
b. Under the pessimistic scenario, Trotter will need a credit line of at least $162,000 to cover a
cash shortfall of that amount in December. In the most likely scenario, Trotter will need a credit
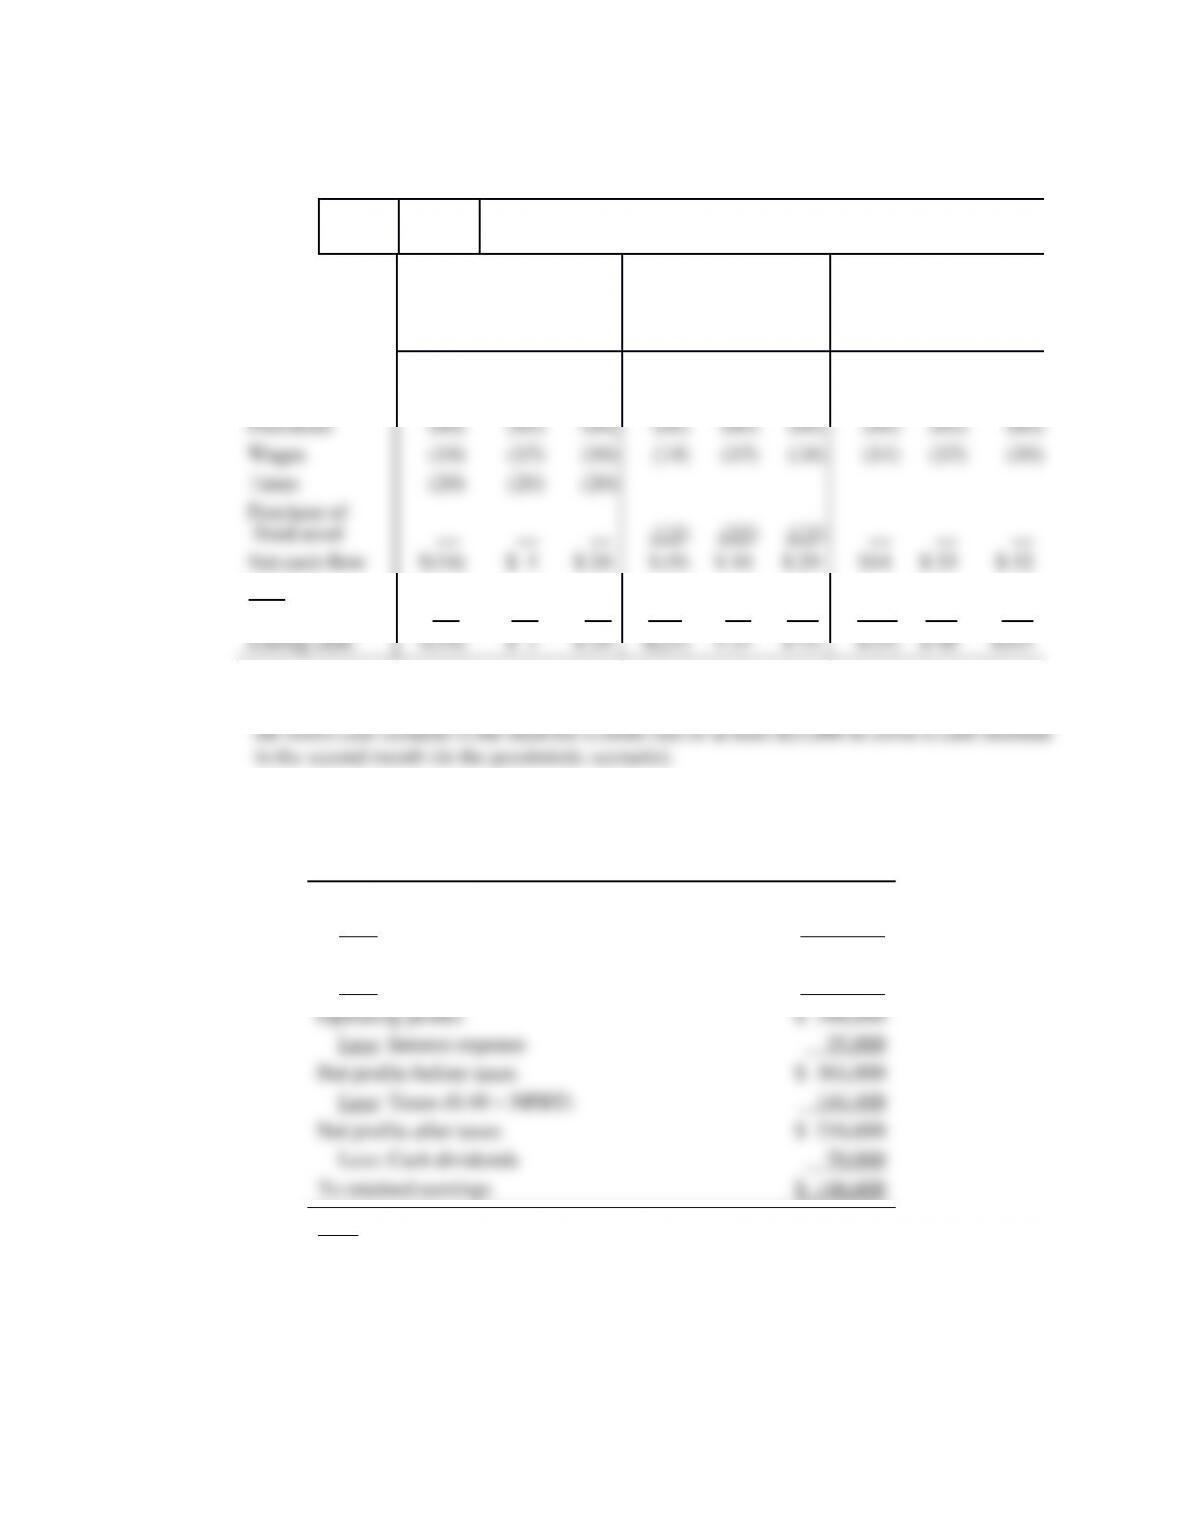
P4-15 Multiple cash budgets: Scenario analysis (LG 5; Intermediate)
a. and b. Brownstein, Inc. Multiple Cash Budgets ($000)
1st
Month
2nd
Month
3rd Month
Pessi-
mistic
Most
Likely
Opti-
mistic
Pessi-
misti
c
Most
Likel
y
Opti-
misti
c
Pessi
–
misti
c
Most
Likel
y
Opti-
mistic
Sales $ 80 $100 $120 $ 80 $100 $120 $80 $100 $120
Asset sale 8 8 8
Add:
Beginning cash 0 0 0 (14) 5 24 (23) 15 53
c. Considering the extreme values reflected in the pessimistic and optimistic outcomes allows
Brownstein to plan borrowing or short-term investments carefully. For example, the firm knows
P4-16 Pro forma income statement (LG 5; Intermediate)
a. Pro Forma Income Statement—Metroline Manufacturing, Inc.
Year Ending December 31, 2020 (Percent-of-Sales Method)
Sales $1,500,000
Less: Cost of goods sold (0.65 sales) 975,000
Gross profits $ 525,000
Less: Operating expenses (0.086 sales) 129,000
Note: Operating expense percentage was found by dividing 2019
operating expenses ($) by sales ($), and rounding to third
decimal place.
c. Pro Forma Income Statement – Metroline Manufacturing, Inc
Year Ending December 31, 2020 (Fixed and Variable Data)
Sales
$1,500,000
Less: Cost of goods sold – fixed
210,000
Cost of goods sold – variable (0.5 sales)
750,000
Gross profits
$ 540,000
Less: Fixed expense
36,000
Variable expense (0.06 sales)
90,000
Operating profits
$ 414,000
Less: Interest expense
35,000
Net profits before taxes (NPBT)
$ 379,000
Less: Taxes (0.40 NPBT)
151,600
Net profits after taxes
$ 227,400
Less: Cash dividends
70,000
To retained earnings
$ 157,400
Note: Variable cost and expense percentages were found by dividing 2019
c. When sales are projected to rise, and the firm has fixed costs, pro forma income statements
based on percentages of sales will overstate costs and understate profits. Both conditions are