Solutions to Problems
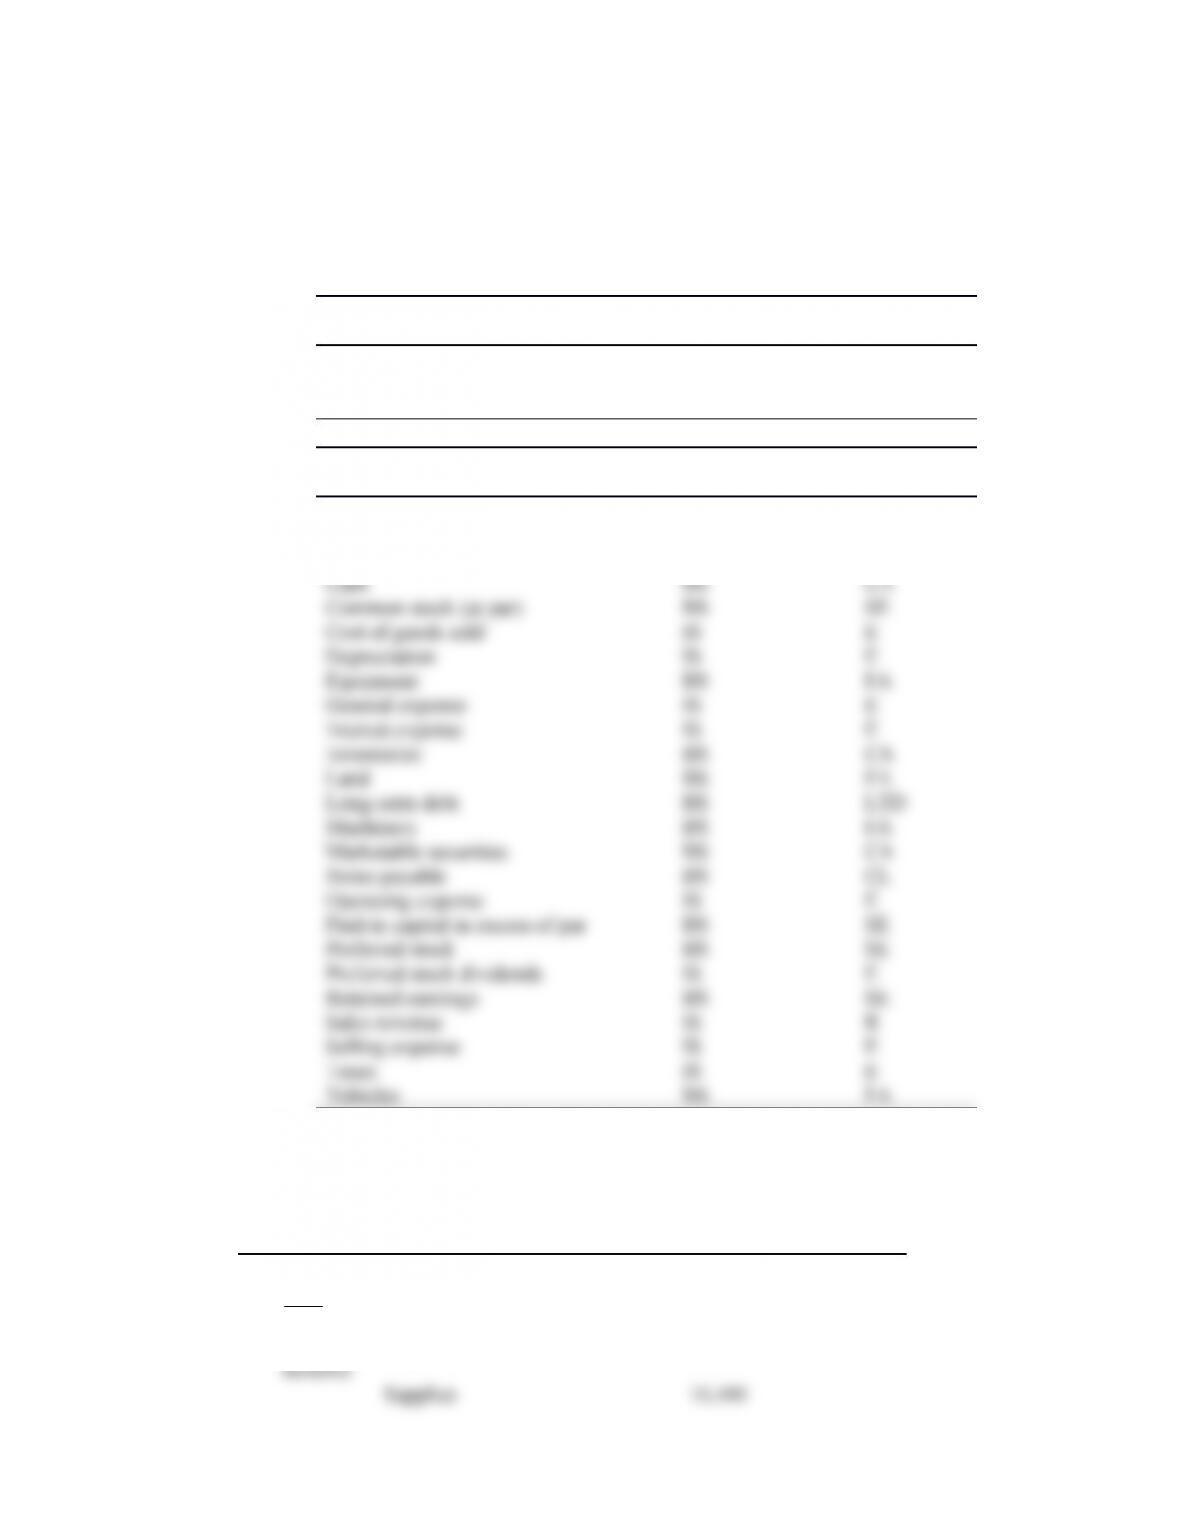
P3-1 Financial-statement account identification (LG 1; Basic)
a., b.
Column 1 for (a) Column 2 for (b)
Account Name Statement Type of Account
Accounts payable BS CL
Accounts receivable BS CA
Accruals BS CL
Column 1 for (a) Column 2 for (b)
Account Name Statement Type of Account
Accumulated depreciation BS FA*
Administrative expense IS E
Buildings BS FA
*Not a fixed asset, but a charge against a fixed asset (and better known as a contra-asset).
P3-2 Income-statement preparation (LG 1; Intermediate)
a. Cathy Chen, CPA – Income Statement
Year Ending December 31, 2019
Sales revenue $360,000
Less: Operating expenses
Salaries $180,000
Employment taxes and
34,600
b. In her first year of business, Ms. Chen covered operating expenses and earned a net profit of
$38,500 (net profit margin of $38.500/$360,000 or 10.7%). Assuming the salary she paid herself
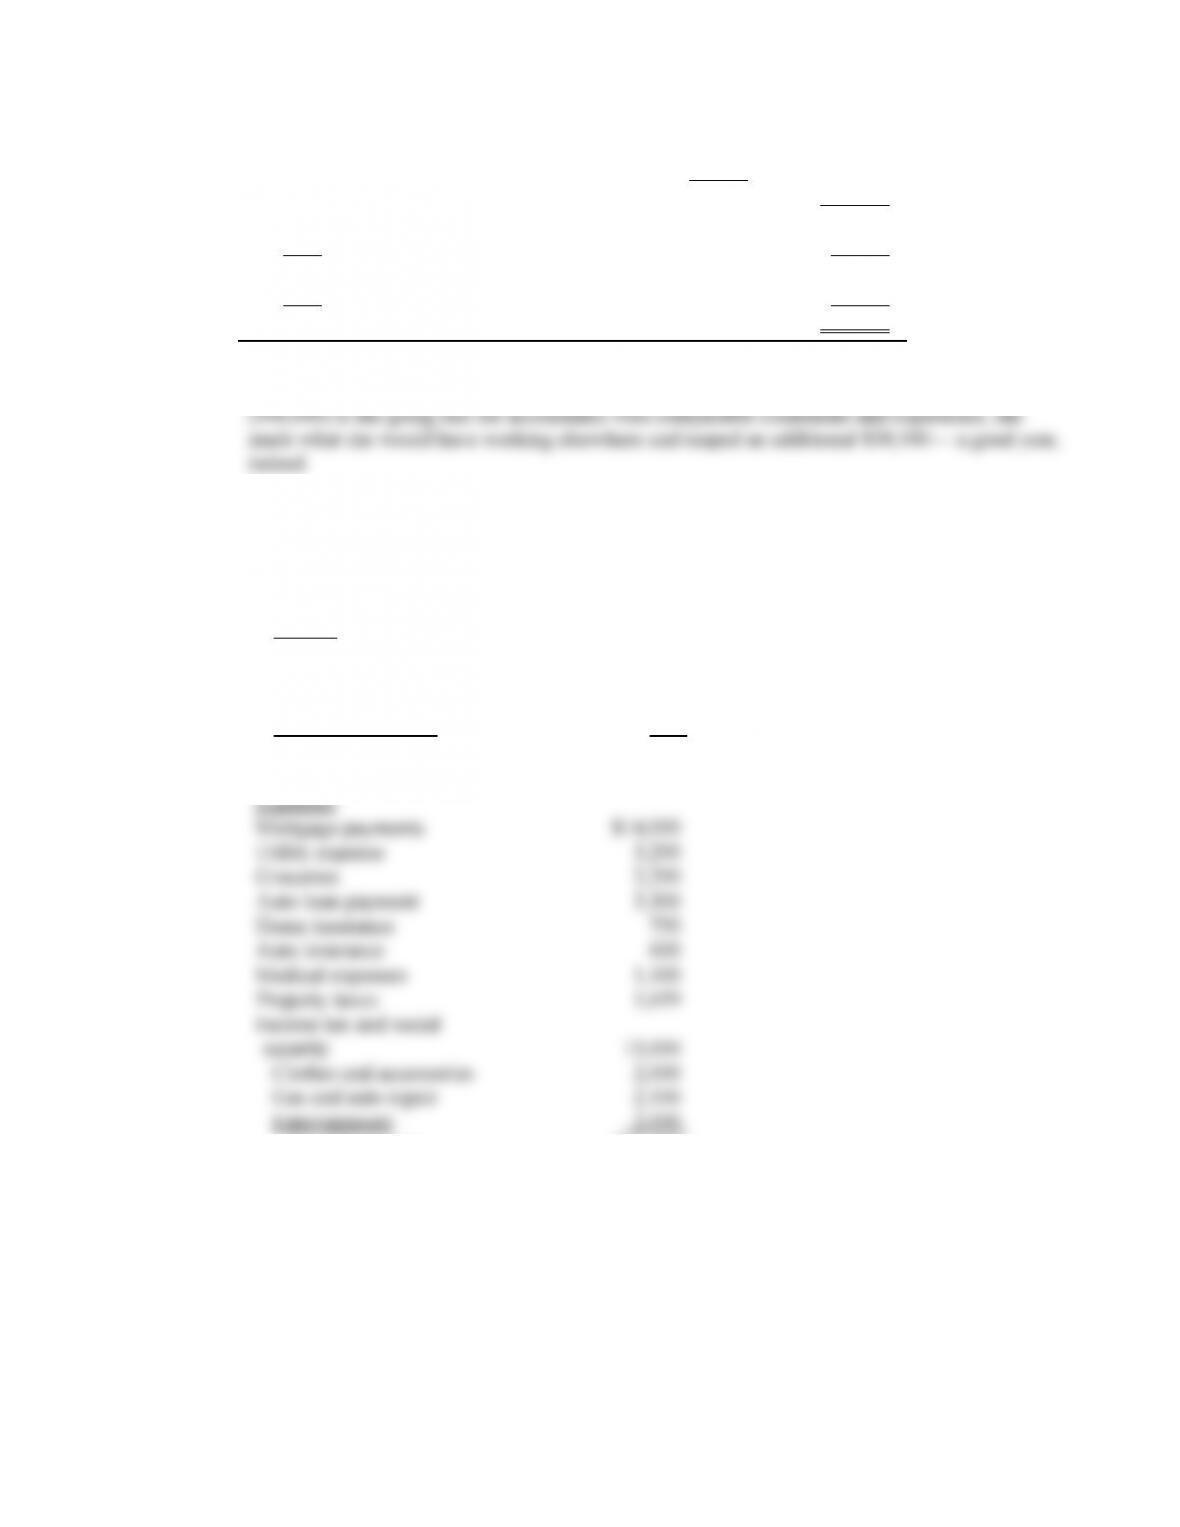
P3-3 Personal Finance Problem: Income-statement preparation (LG 1; Intermediate)
a. 2019 Personal Income and Expense Statement—Adam and Arin Adams
Income
Adam’s salary $45,000
Arin’s salary 30,000
Interest received 500
Dividends received 150
Total Income $75,650
Total Expenses $46,309
2019 Cash Surplus (Deficit) $29,341
b. Income exceeds expenses, so the Adams have a cash surplus.
c. The cash surplus can be used for a variety of purposes. In the short term, the Adams could
replace their car, buy better furniture, or reduce their mortgage debt. Alternatively, they could
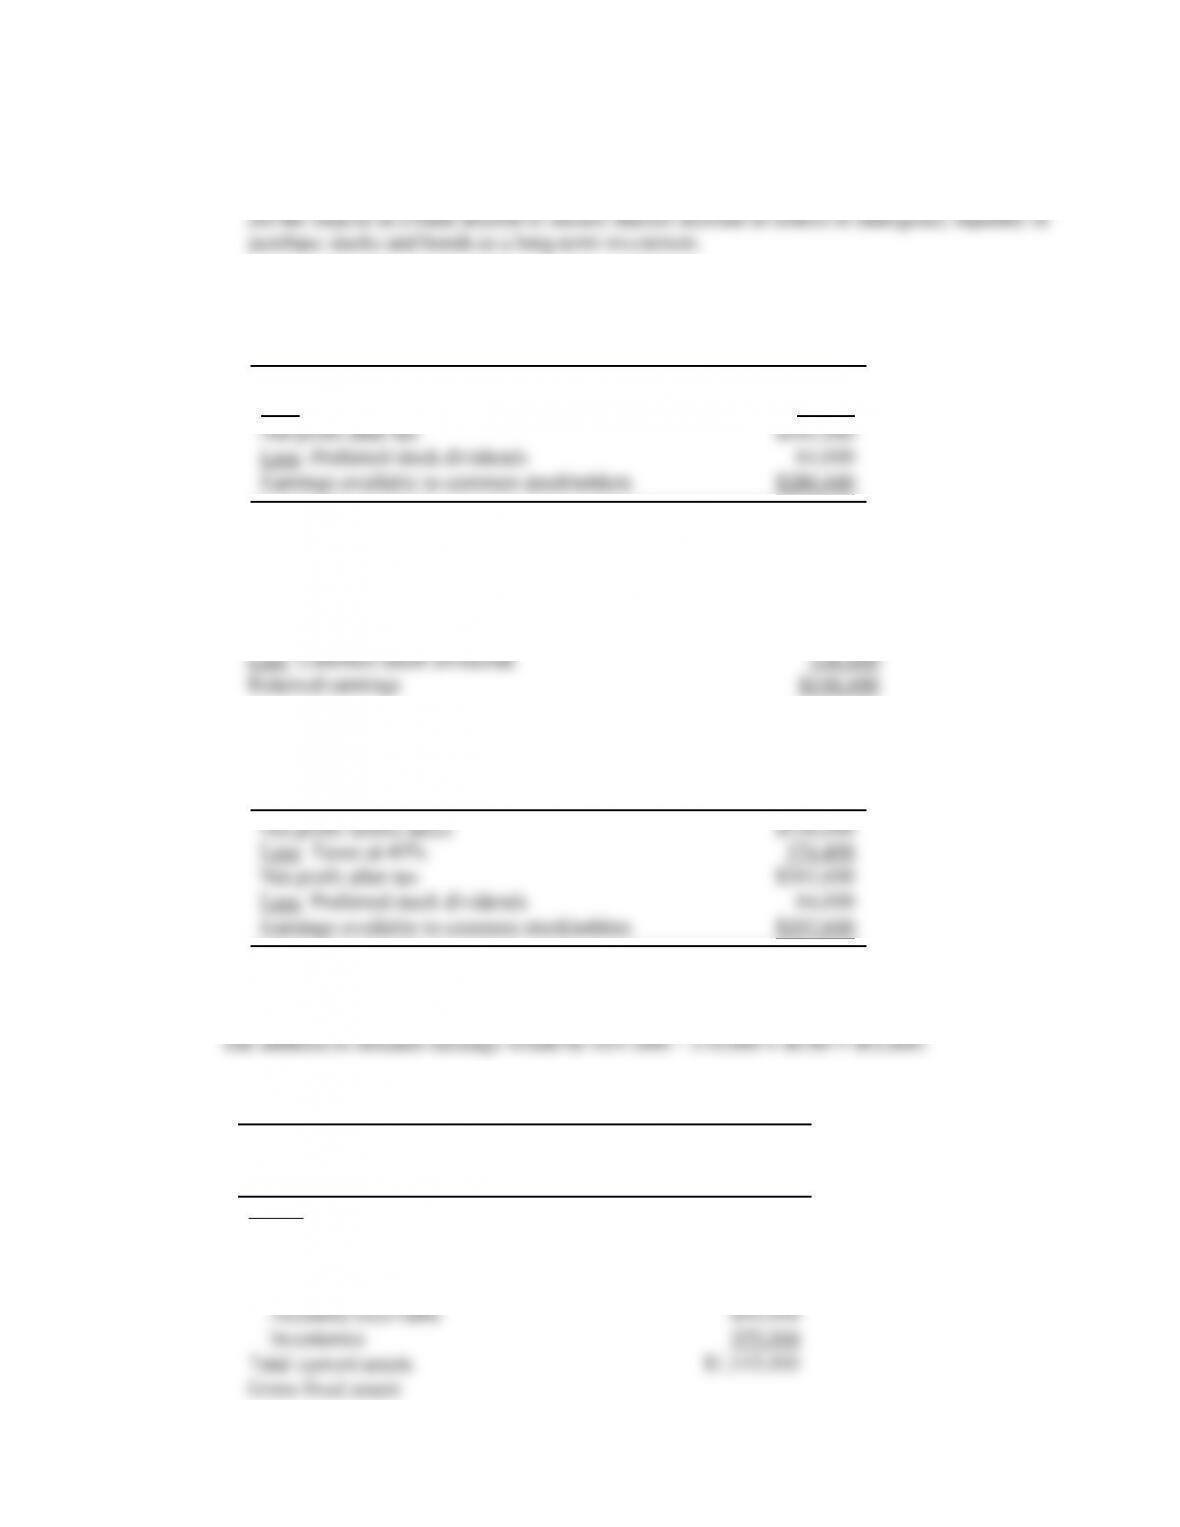
P3-4 Calculation of EPS and retained earnings (LG 1; Intermediate)
a. Earnings per share:
Net profit before taxes $436,000
Less: Taxes at 21% 91,560
b. Addition to retained earnings:
170,000 shares $0.80 = $136,000 common stock dividends
Earnings available to common shareholders $280,440
This problem originally asked students to use a tax rate of 40% rather than the 21% enacted under
new tax law. With a 40% tax rate in place, we would have the following:
Earnings per share:
EPS = $197,600 ÷ 170,000 = $1.16
P3-5 Balance-sheet preparation (LG 1; Basic)
Mellark’s Baked Goods
Balance Sheet
December 31, 2019
Assets
Current assets
Cash $215,000
Marketable securities 75,000
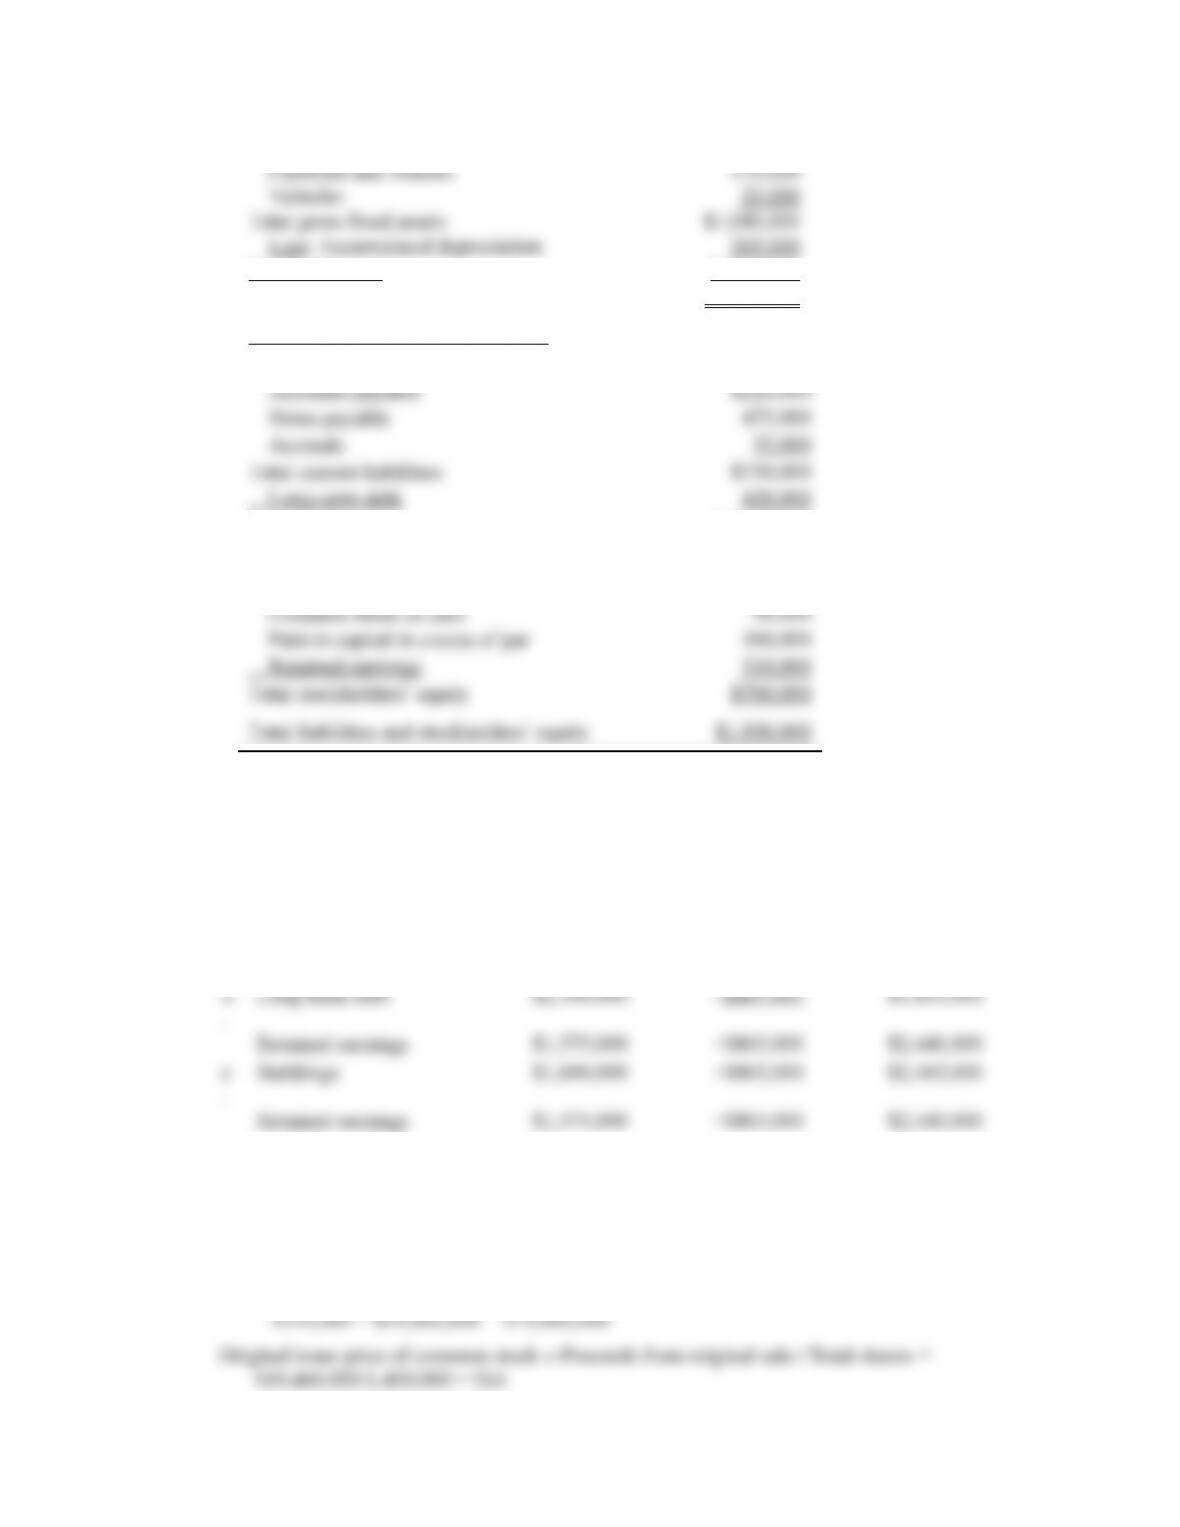
Land and buildings $325,000
Machinery and equipment 560,000
Net fixed assets $ 815,000
Total assets $1,930,000
Liabilities and stockholders’ equity
Current liabilities
Total liabilities $1,170,000
Stockholders’ equity
Preferred stock $100,000
P3-6 Effect of net income on a firm’s balance sheet (LG 1; Basic)
Account Beginning Value Change
Ending Value
a
.
Marketable securities $35,000 +$1,365,000 $1,400,000
Retained earnings $1,575,000 +$1,365,000 $2,940,000
d
.
No net change in any accounts
P3-7 Initial sale price of common stock (LG 1; Basic)
Total proceeds from original sale of common stock
= Par value of common stock + Paid-in capital in excess of par on common stock
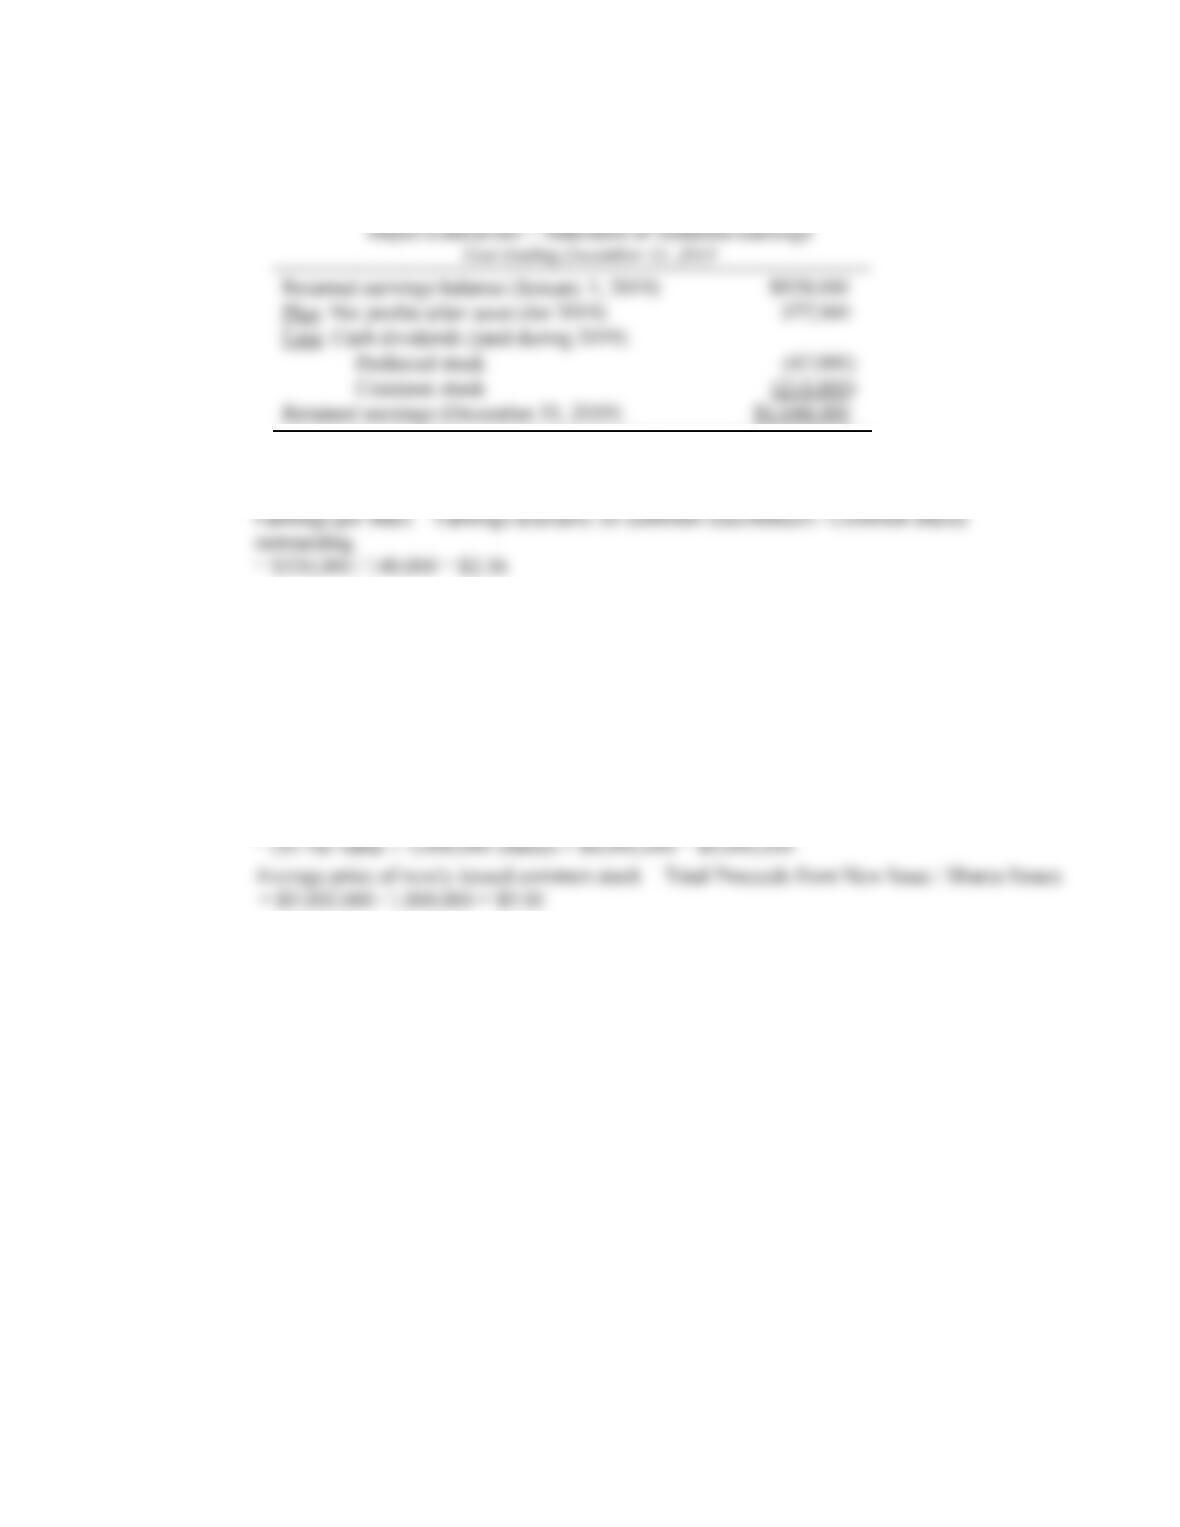
P3-8 Statement of retained earnings (LG 1; Basic)
a. Common stock dividends = Net profits after taxes – Preferred dividends – ∆ Retained earnings
= $377,000 – $47,000 – ($1,048,000 – $928,000) = $210,000
b. Earnings available for common stockholders = Net profits after taxes – Preferred stock
dividends = $377,000 – $47,000 = $330,000
c. Cash dividend per share of common stock = Total cash dividends / common shares outstanding
= $210,000 (from part a) / 140,000 = $1.50
P3-9 Changes in stockholders’ equity (LG 1; Intermediate)
a. 2019 Net income = ∆ Retained earnings − Dividends paid = $500,000 − $200,000 = $700,000
b. New shares issued = Outstanding shares in 2015 – Outstanding shares in 2014 = 1,000,000
c. Total proceeds from new issue
= Par value of newly issued stock + Paid-in capital in excess of par on newly issued stock
d. Original issue price
P3-10 Ratio comparisons (LG 2, LG 3, LG 4, and LG 5; Basic)
a. The companies operate in dissimilar industries, with wide-ranging differences in the nature of
and degree of government regulation. So ratio comparisons will be apples to oranges.
b. The electric utility and fast-food restaurant operate with lower liquidity ratios than the other
firms, implying the two firms probably need less liquidity. Utilities tend to be relatively large,
c. Firms can operate with high levels of debt if cash flows are large, steady, and
predictable. Demand for power does vary by season, but it fairly predictable ways. Moreover,
d. Although the software industry offers potentially high profits and returns, it also carries
significant risk. As noted, rapidly changing technology, intense competition, and consumer
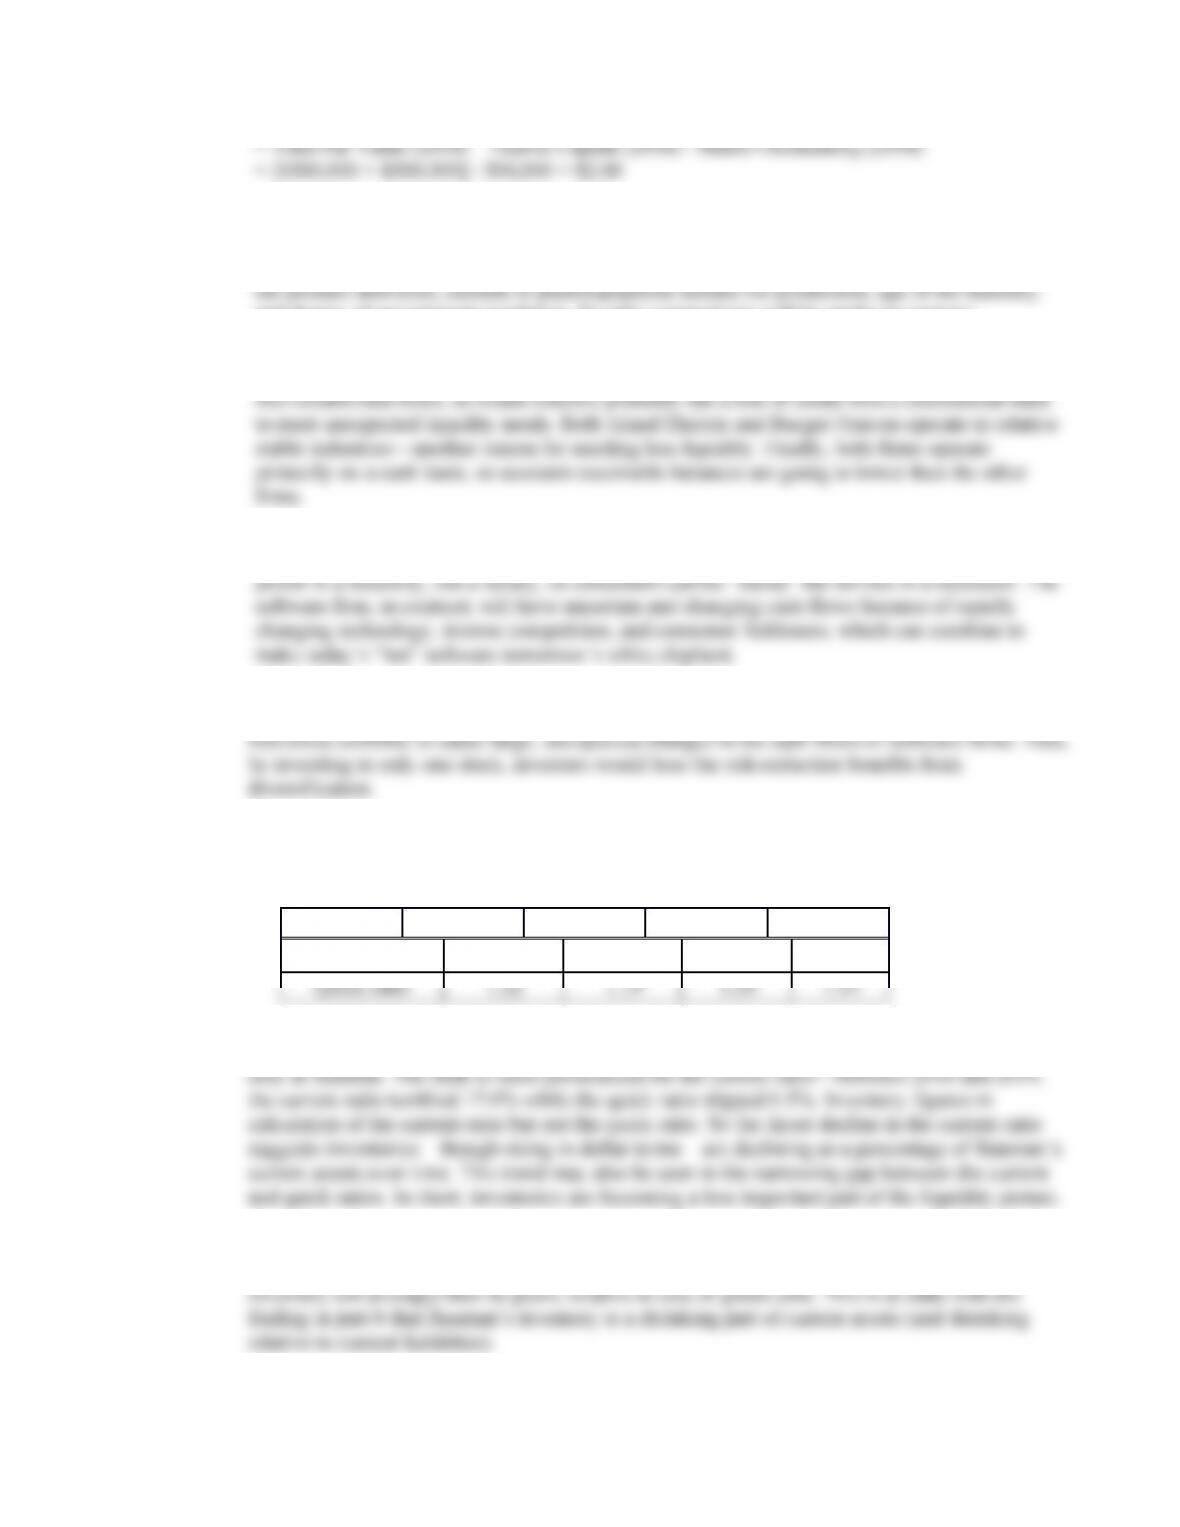
P3-11. Liquidity management (LG 3; Challenging)
a. Both Bauman’s liquidity ratios are falling over time as shown below.
Ratio 2016 2017 2018 2019
Current ratio 1.88 1.74 1.79 1.55
b. Both ratios fall over the four-year period, indicating deterioration in Bauman’s liquidity
position. Because peer data are not given, it is not clear if this deterioration is industry-wide or
c. Bauman’s inventory turnover ratio is only about 60% of the industry average, suggesting the
firm does a relatively poor job managing inventory. Put another way, Bauman carries more
P3-12. Personal finance: Liquidity ratio (LG 3; Basic)
a. Liquidity ratio = Total liquid assets / Total current debts
b. Josh’s liquidity ratio exceeds 1.8, so he has more liquidity than his benchmark friends.
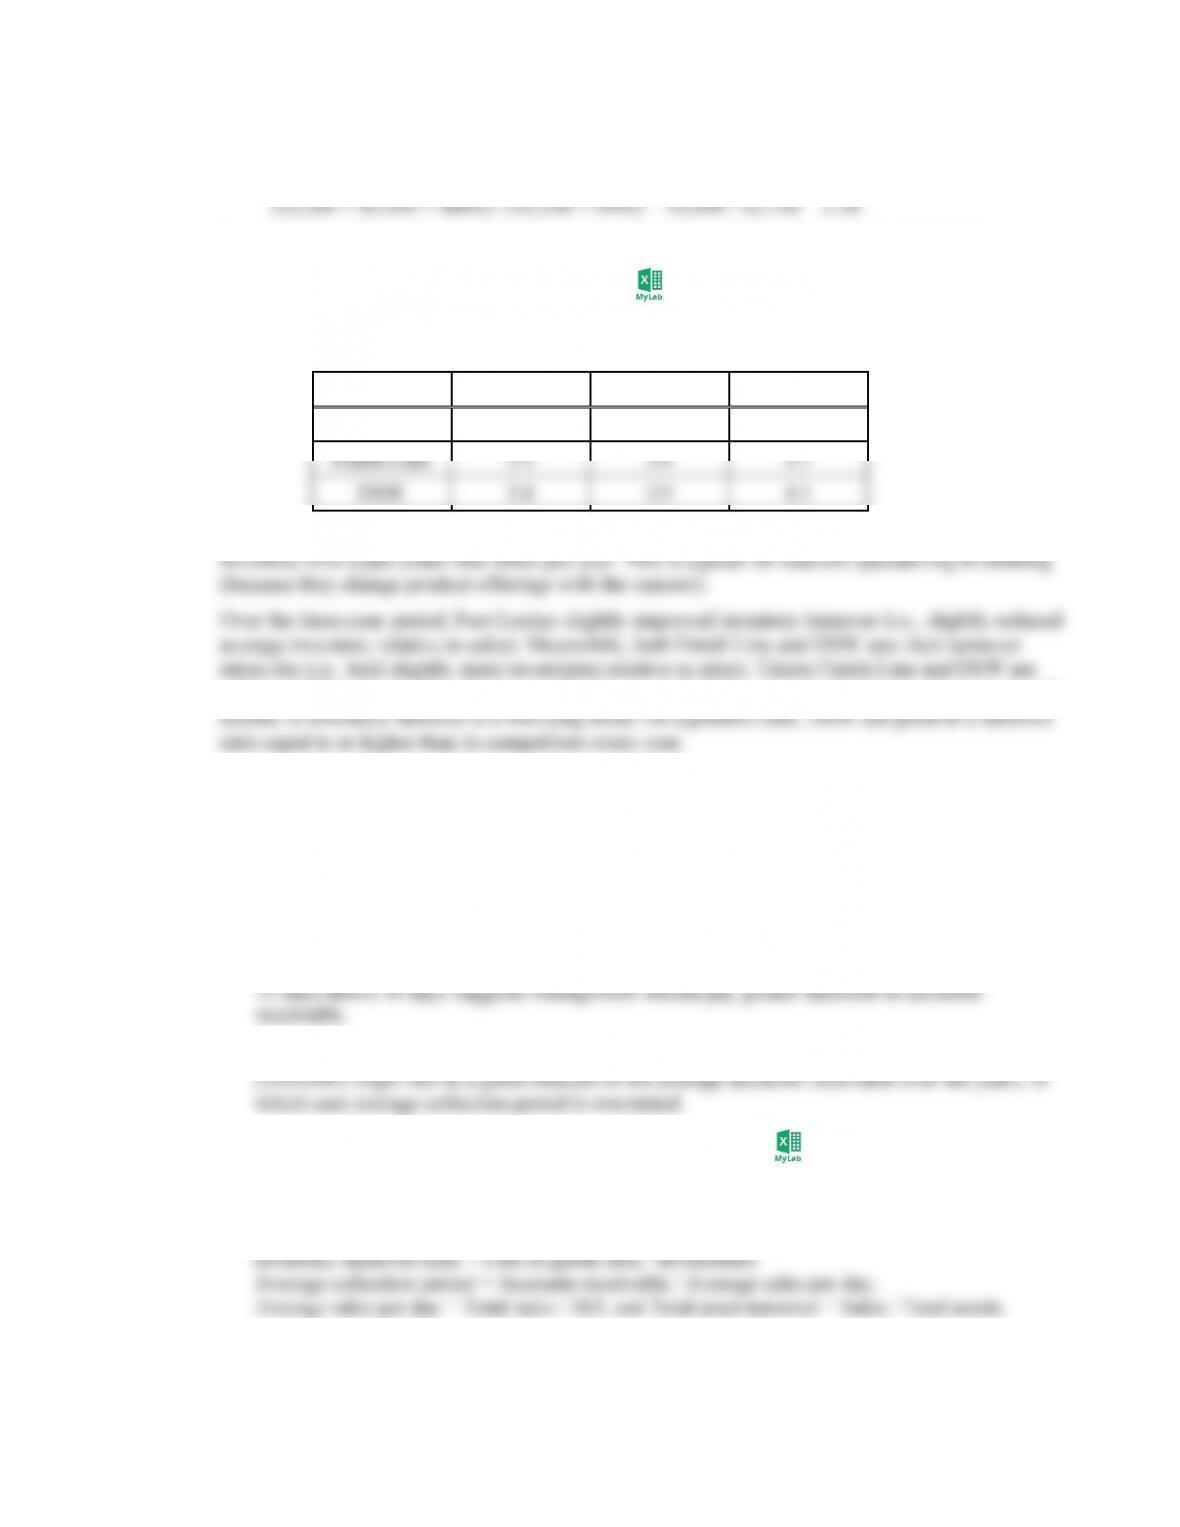
P3-13 Inventory management (LG 3; Intermediate)
Inventory-turnover ratio = Cost of goods sold / Inventories. So:
Firm 2016 2015 2014
Foot Locker 3.8 3.8 3.6
The first thing to notice is the three companies have similar turnover ratios— that is, all three turn
selling a different mix of products, specifically one with higher margins but lower sales volume, the
P3-14. Accounts-receivable management (LG 3; Basic)
a. A good ratio for evaluating a firm’s collection system is average collection period
(= Accounts receivable Average sales per day).
Blair Supply normally extends 30-day credit to customers, so an average collection period over
b. Seasonality could explain the high average collection period. End-of-year accounts receivable
P3-15. Interpreting liquidity and activity ratios (LG 3; Intermediate)
a. Current ratio = Current assets / Current liabilities;
Quick ratio = [Current assets – Inventory] / Current liabilities;
So,
Firm
Current
Ratio
Quick
Ratio
Inventory
Turnover
Average
Collection
Period
Total
Asset
Turnover
Proctor & Gamble 0.89 0.72 6.89 26.46 0.56
b. Colgate-Palmolive boasts the highest current and quick ratios, so they have the most liquidity.
Clorox’s relatively low liquidity ratios are surprising because it is considerably smaller than
P&G and Colgate. Usually smaller companies have greater liquidity on their balance sheets
c. All three firms collect on sales in about 30 days, with the differences in average collection
periods between the shortest (P&G) and longest (Colgate) collection periods only seven days.
d. Procter & Gamble turned inventory over a bit faster than the other firms but assets much
slower. This is surprising because both ratios measure asset efficiency—how could P&G excel
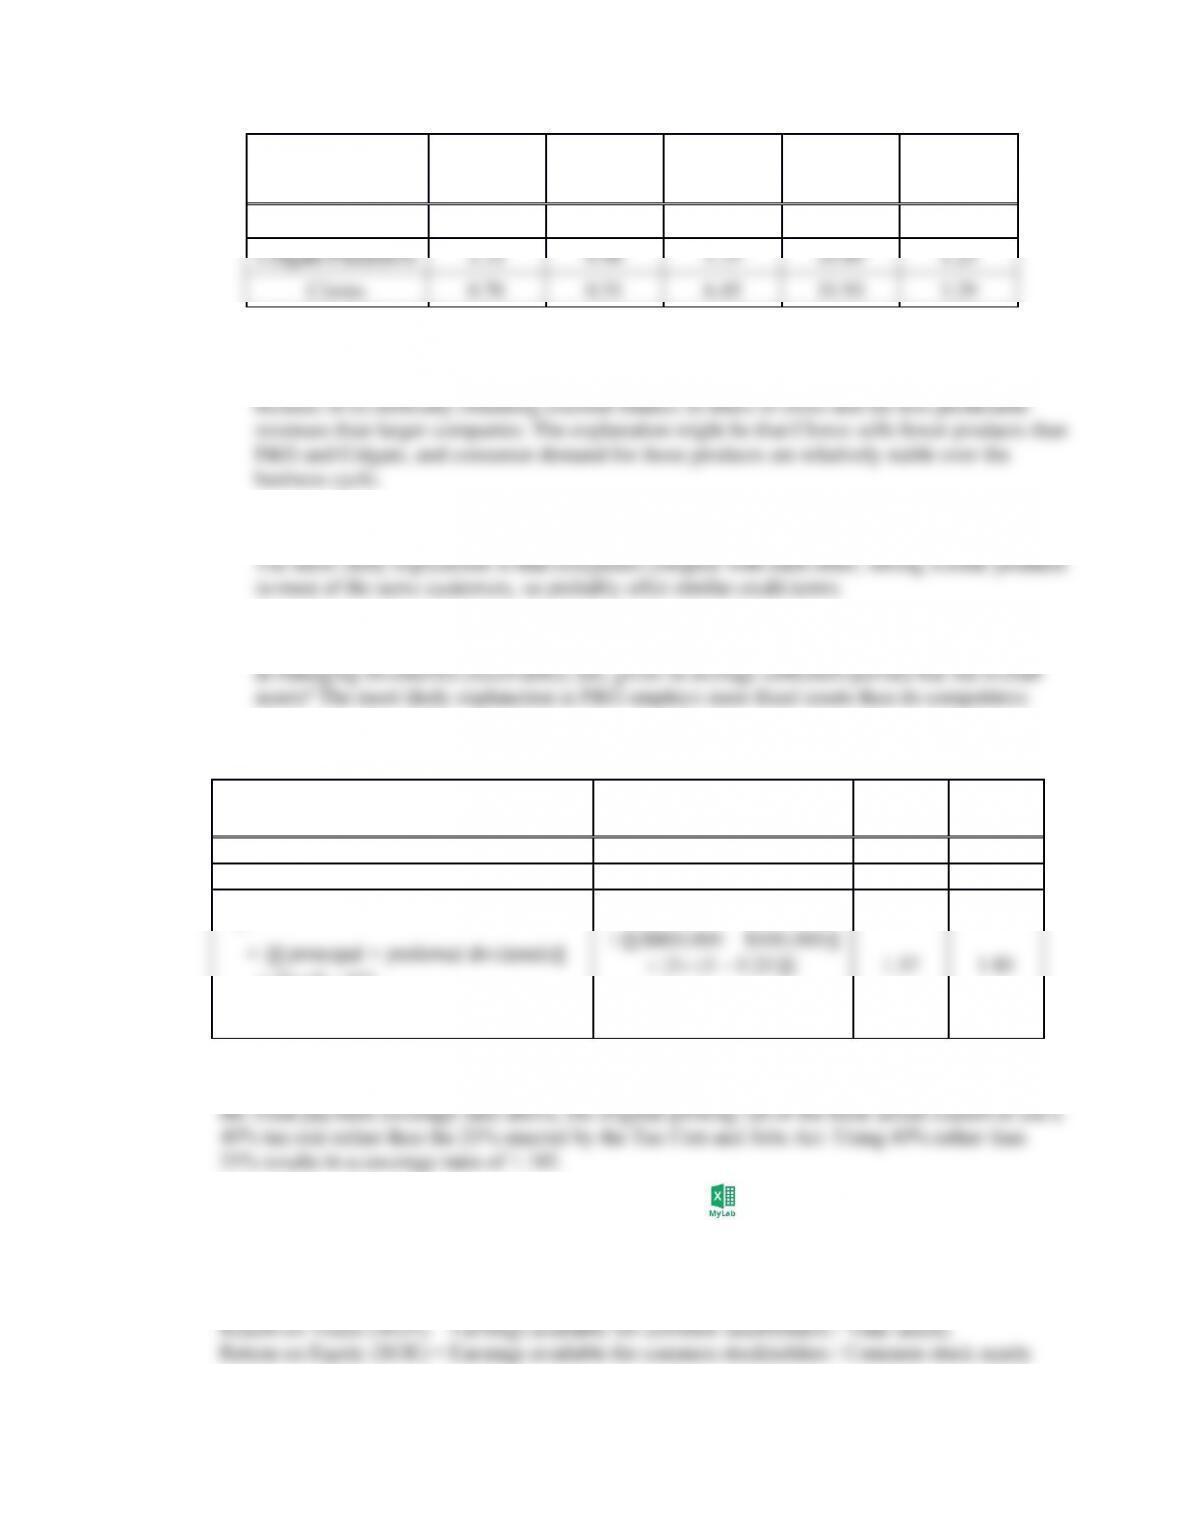
P3-16 Debt analysis (LG 4; Basic)
Ratio Calculation Creek Industr
y
Debt = 0.73 0.51
Times-interest-earned = 3.00 7.30
Fixed-payment coverage
[1 (1 – t)]}
Creek Enterprises finances a much larger percentage of assets with debt and has less ability to
service additional debt than the average firm in the industry, so the loan should be rejected. Note in
P3-17 Profitability analysis (LG 4 and LG 5; Intermediate)
Gross profit margin = [Sales – Cost of goods sold] / Sales;
Net profit margin = Earnings available for common stockholders / Sales;
So,
Firm
Gross Profit
Margin
Net Profit
Margin ROA ROE
Coca-Cola 60.7% 15.6% 7.5% 28.3%
It is difficult to say which company is most profitable because the four measures provide
b. ROE exceeds ROA because—while both ratios have the same numerator (earnings)—ROE has
a smaller denominator for all firms with some debt. (If a firm has no debt, assets equal equity,
P3-18 Ratio analysis (LG 2, LG 3, and LG 4; Challenging)
From 2018 to 2019, Bartlett’s liquidity position weakened in that the current ratio deteriorated and
average collection period lengthened. One bright spot is that inventories, which can be relatively
illiquid, became a smaller percentage of current assets. Activity ratios unequivocally improved as
P3-19. Common-size statement analysis (LG 5)
Creek Enterprises
Common-Size Income Statement
Years Ending December 31, 2018 and 2019
2018 2019
Sales revenue 100.0% 100.0%
Less: Cost
of goods
sold
Gross profits
Lease
expense
Depreciati
on
3.6% 23.2% 3.3% 20 .0%
before taxes
Less:
Taxes
2.0% 1 .4%
after taxes
In dollar terms, sales declined from $35 to $30 million. Meanwhile, as a percentage of sales, cost of
goods sold increased, probably reflecting a loss of productive efficiency. Operating expenses (as a
percentage of sales) fell— a favorable development unless the decline contributed to drop in sales (say