P13-25 Integrative: Optimal capital structures (LG 3, 4, 6; Challenge)
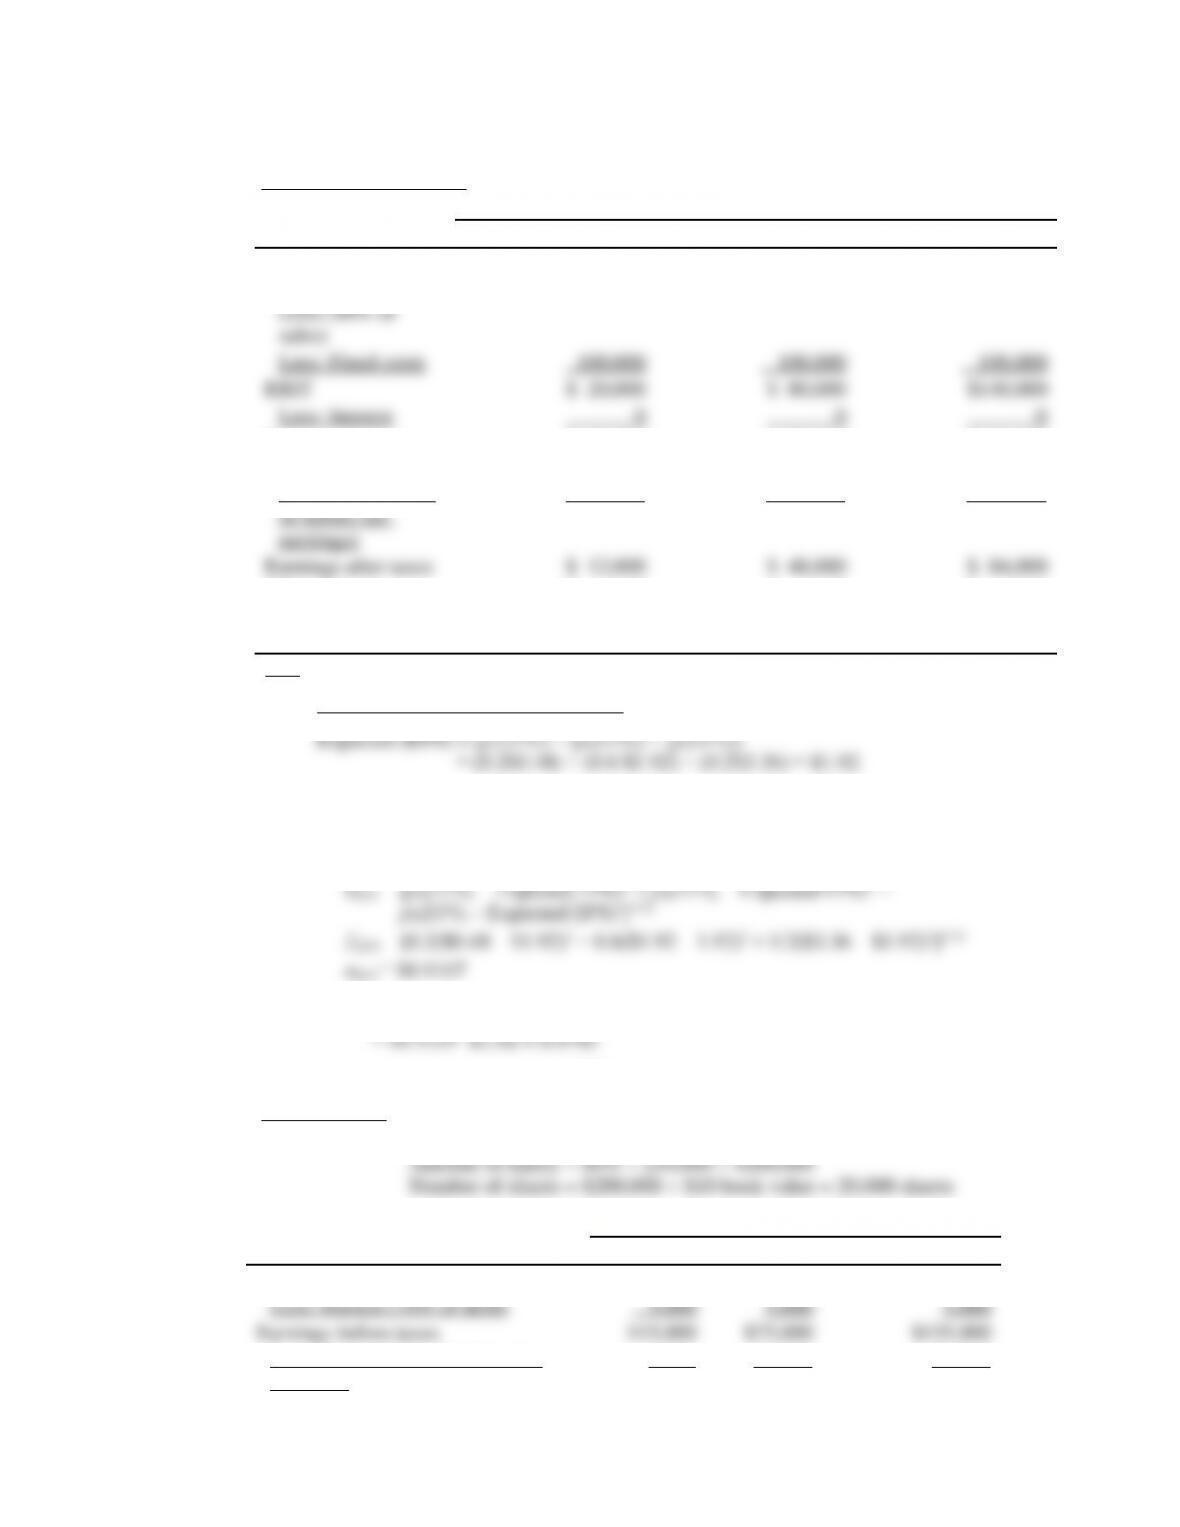
a. 0% debt ratio – baseline: Probability (p)
p1 = 0.20 p2 = 0.60 P3 =0.20
Sales $200,000 $300,000 $400,000
Less: Variable
80,000 120,000 160,000
Earnings before
taxes $ 20,000 $ 80,000 $140,000
Less: Taxes (40%
8,000 32,000 56,000
EPS (After-tax
earnings 25,000
shares)
$ 0.48 $ 1.92 $ 3.36
Note: Total capital with 100% equity = $250,000 (25,000 shares
$10 book value)
Summary statistics – EPS (0% debt):
Standard deviation:
Because all outcomes and probabilities are known, standard deviation (EPS) is given
by:
Coefficient of variation (EPS) = Standard deviation (EPS) Expected EPS
***
20% debt ratio: Amount of debt 20% $250,000 $50,000
Probability (p)
p1 = 0.20 p2 = 0.60 P3 =0.20
EBIT $20,000 $80,000 $140,000
Less: Taxes (40% of before-tax
earnings) 6,000 30,000 54,000
Summary statistics – EPS (20% debt):
Expected (EPS) = $2.25
Number of shares $150,000 equity $10 book value 15,000 shares
Probability (p)
p1 = 0.20 p2 = 0.60 p3 =0.20
EBIT $20,000 $80,000 $140,000
Less: Interest (12% of debt) 12,000 12,000 12,000
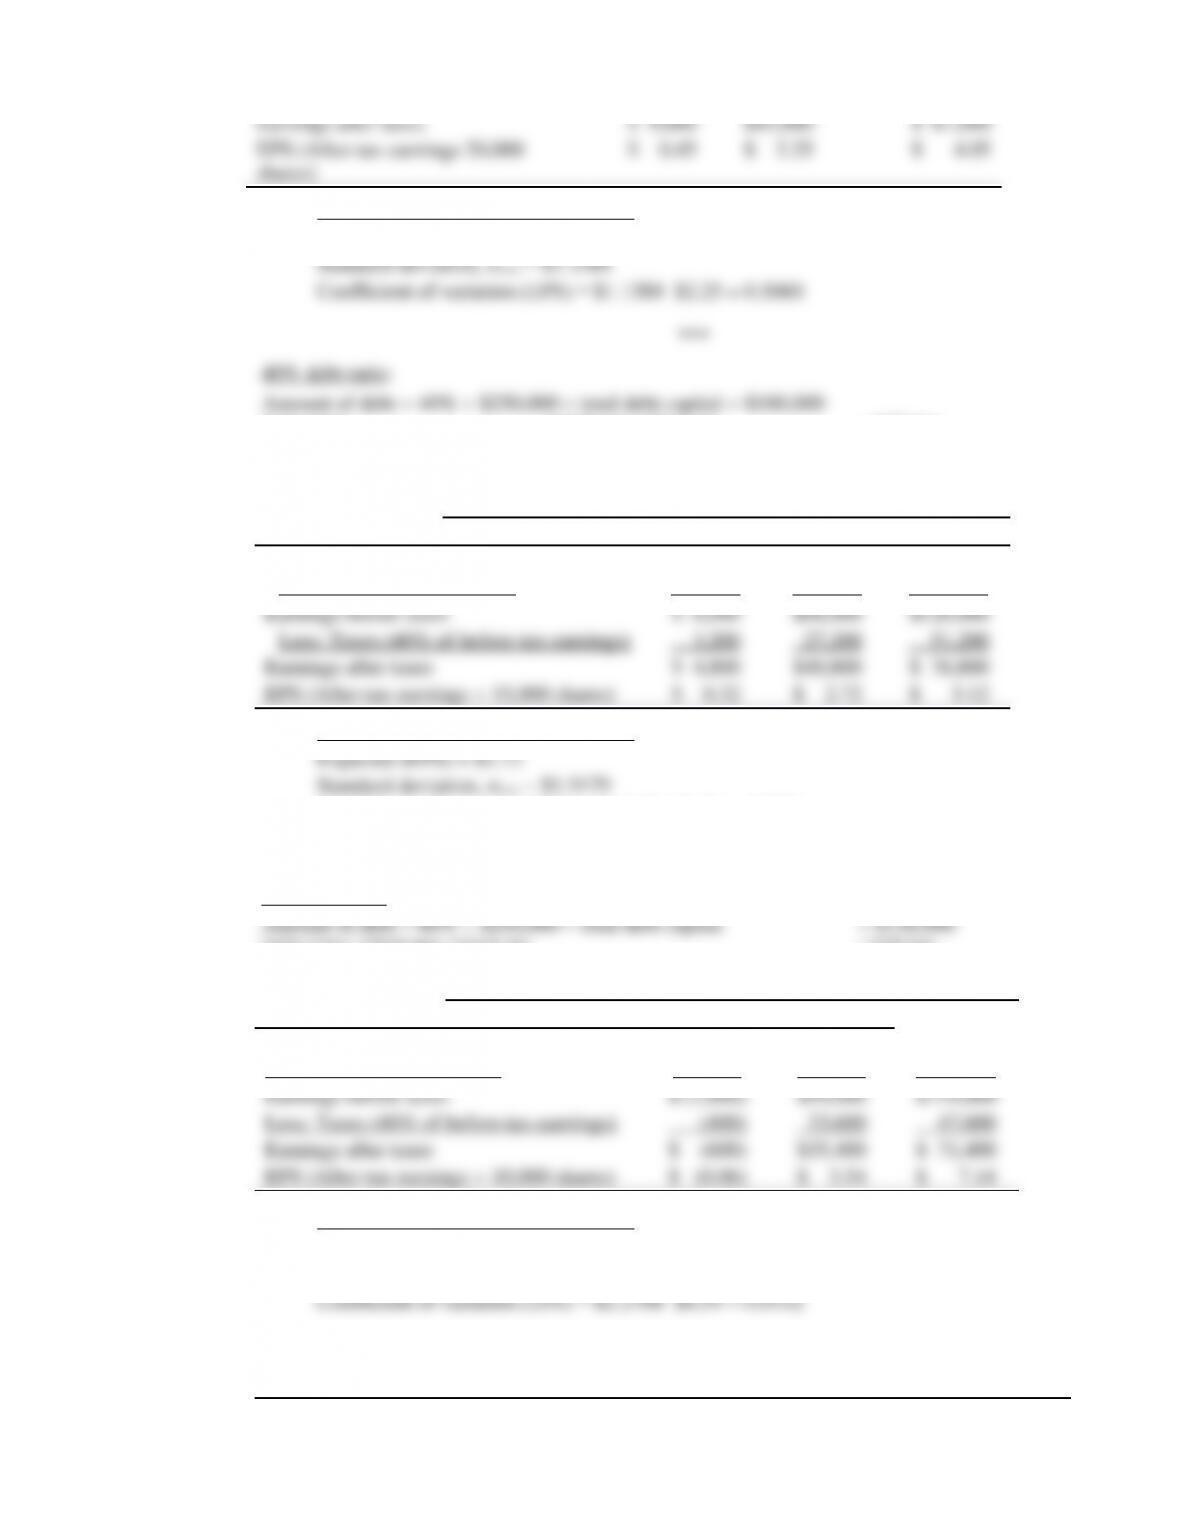
Summary statistics – EPS (40% debt):
Coefficient of variation (EPS) = $1.5179 $2.72 = 0.5580
***
60% debt ratio:
Number of shares $100,000 equity $10 book value 10,000 shares
Probability (p)
p1 = 0.20 p2 = 0.60 p3 =0.20
EBIT $20,000 $80,000 $140,000
Less: Interest (14% of debt) 21,000 21,000 21,000
Summary statistics – EPS (60% debt):
Expected (EPS) = $6.54
Standard deviation, σEPS = $2.2768
***
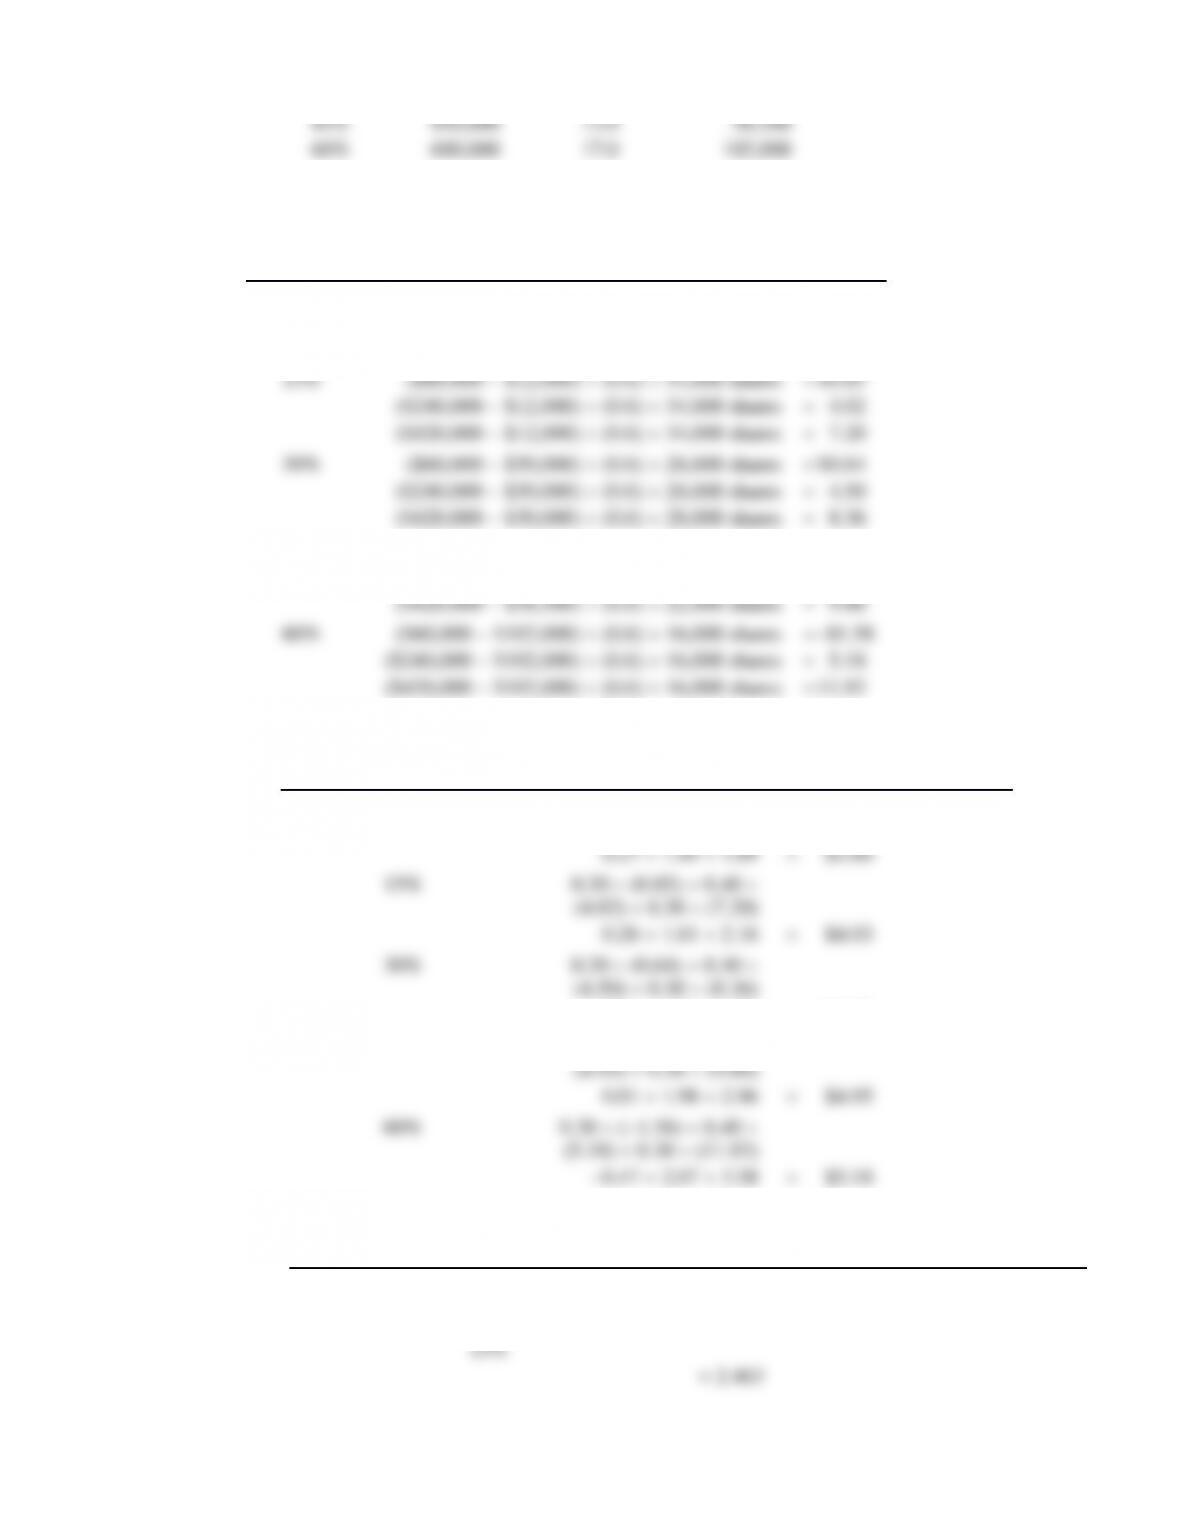
Share

Debt
Ratio Expected
(EPS)
EPS) CV(EPS)
Common
Shares Total
Debt ($) Price
*
=
Expect
ed
EPS
Requir
ed
Return
0% $1.92 0.9107 0.4743 25,000 0 $1.92÷0.16 $12.00
*Share price: E(EPS)
required return for CV for E(EPS), from table in problem.
b. (1) Optimal capital structure to maximize EPS: 60% debt, 40% equity
equity
c.
P13-26 Integrative: Optimal capital structure
(LG 3, 4, 5, 6; Challenge)
a. % Debt Total Assets $ Debt $ Equity No. of Shares @ $25
0 $40,000,000 $ 0 $40,000,000 1,600,000
10 40,000,000 4,000,000 36,000,000 1,440,000
b. % Debt $ Total Debt Before Tax Cost of
Debt, rd
$ Interest Expense
0 $ 0 0.0% $ 0
10 4,000,000 7.5 300,000
20 8,000,000 8.0 640,000
c. %
De
bt
$ Interest
Expense EBT Taxes
@40% Net
Income # of
Shares EPS
0 $ 0 $8,000,000 $3,200,000 $4,800,000 1,600,000 $3.00
10 300,000 7,700,000 3,080,000 4,620,000 1,440,000 3.21

40 1,760,000 6,240,000 2,496,000 3,744,000 960,000 3.90
Note: In the final column of the table above, EPS values with a 21% tax rate EPS are (from
d. and e.
% Debt EPS rSP0
0 $3.00 10.0% $30.00
10 3.21 10.3 31.17
20 3.45 10.9 31.65
The optimal capital structure is 30% debt and 70% equity. This mix will maximize the price per
share of the firm’s common stock and, thus, maximize shareholders’ wealth.
.Note: When the tax rate falls to 21%, stock prices for various debt levels change, but the
P13-27 Integrative: Optimal capital structure (LG 3, 4, 5, 6; Challenge)
a. Probability
0.30 0.40 0.30
Sales $600,000 $900,000 $1,200,000
Less: Variable costs (40%) 240,000 360,000 480,000
b.
Debt
Ratio
Amount
of Debt Amount
of Equity Shares of
Common Stock*
0% $ 0 $1,000,000 40,000
15% 150,000 850,000 34,000
* Dollar amount of equity
$25 per share
Number of shares of common stock.
c. Debt
Ratio Amount
of Debt Before-Tax
Cost of Debt Annual
Interest
0% $ 0 0.0% $ 0
15% 150,000 8.0 12,000
30% 300,000 10.0 30,000
d. EPS [(EBIT interest) (1 T)] number of common shares outstanding:
Debt
Ratio Calculation EPS
0% ($60,000 $0) (0.6) 40,000 shares $0.90
($240,000 $0) (0.6) 40,000 shares 3.60
($420,000 $0) (0.6) 40,000 shares 6.30
45% ($60,000 $58,500) (0.6) 22,000 shares $0.04
($240,000 $58,500) (0.6) 22,000 shares 4.95
e. (1) Expected (EPS) 0.30(EPS1) 0.40(EPS2) 0.30(EPS3):
Debt Ratio Calculation E(EPS)
0% 0.30 (0.90) 0.40
(3.60) 0.30 (6.30)
0.19 1.80 2.51 $4.50
45% 0.30 (0.04) 0.40
(2) Standard deviation of EPS,
EPS:
Debt Ratio Calculation
0% = 2.091
60% = 5.229
(3)
Debt
Ratio
EPS E(EPS) Coefficient of Variation
0% 2.091 3.60 0.581
15% 2.463 4.03 0.611
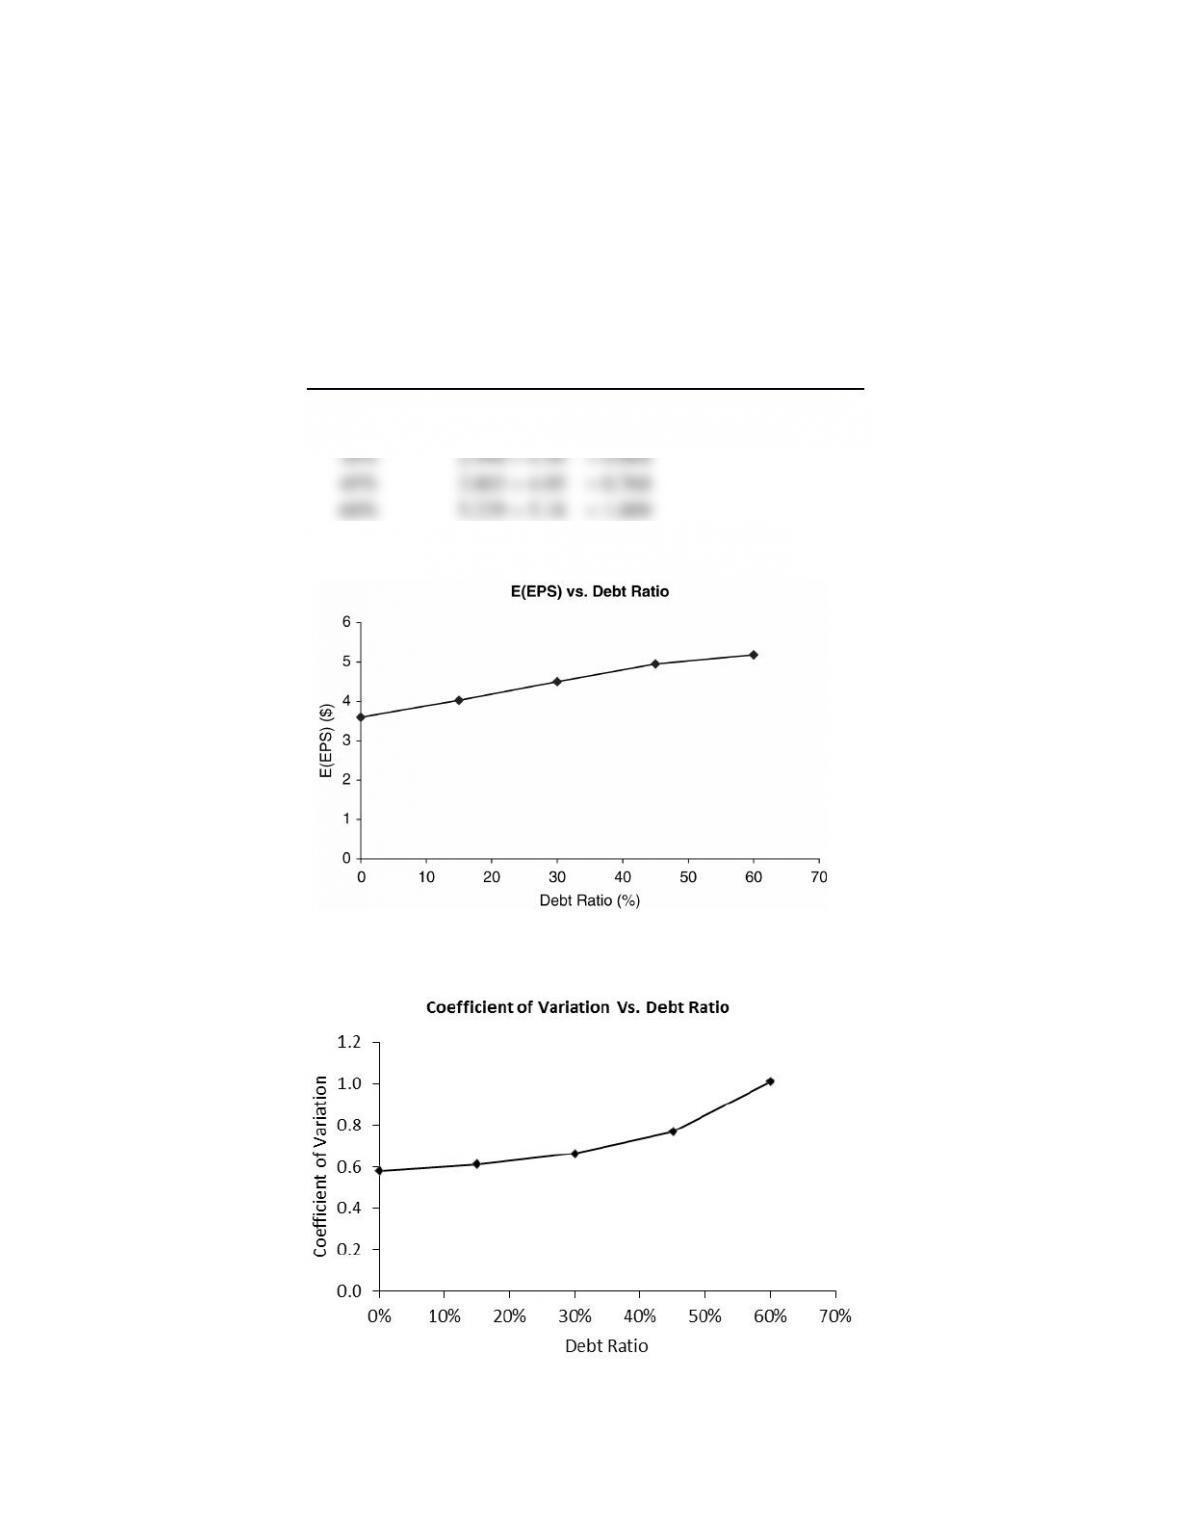
f. (1)
(2)
The return, as measured by the E(EPS), as shown in part d, continually increases as the debt

ratio increases, although at some point the rate of increase of the EPS begins to decline (the
increases but at a more rapid rate.
g.
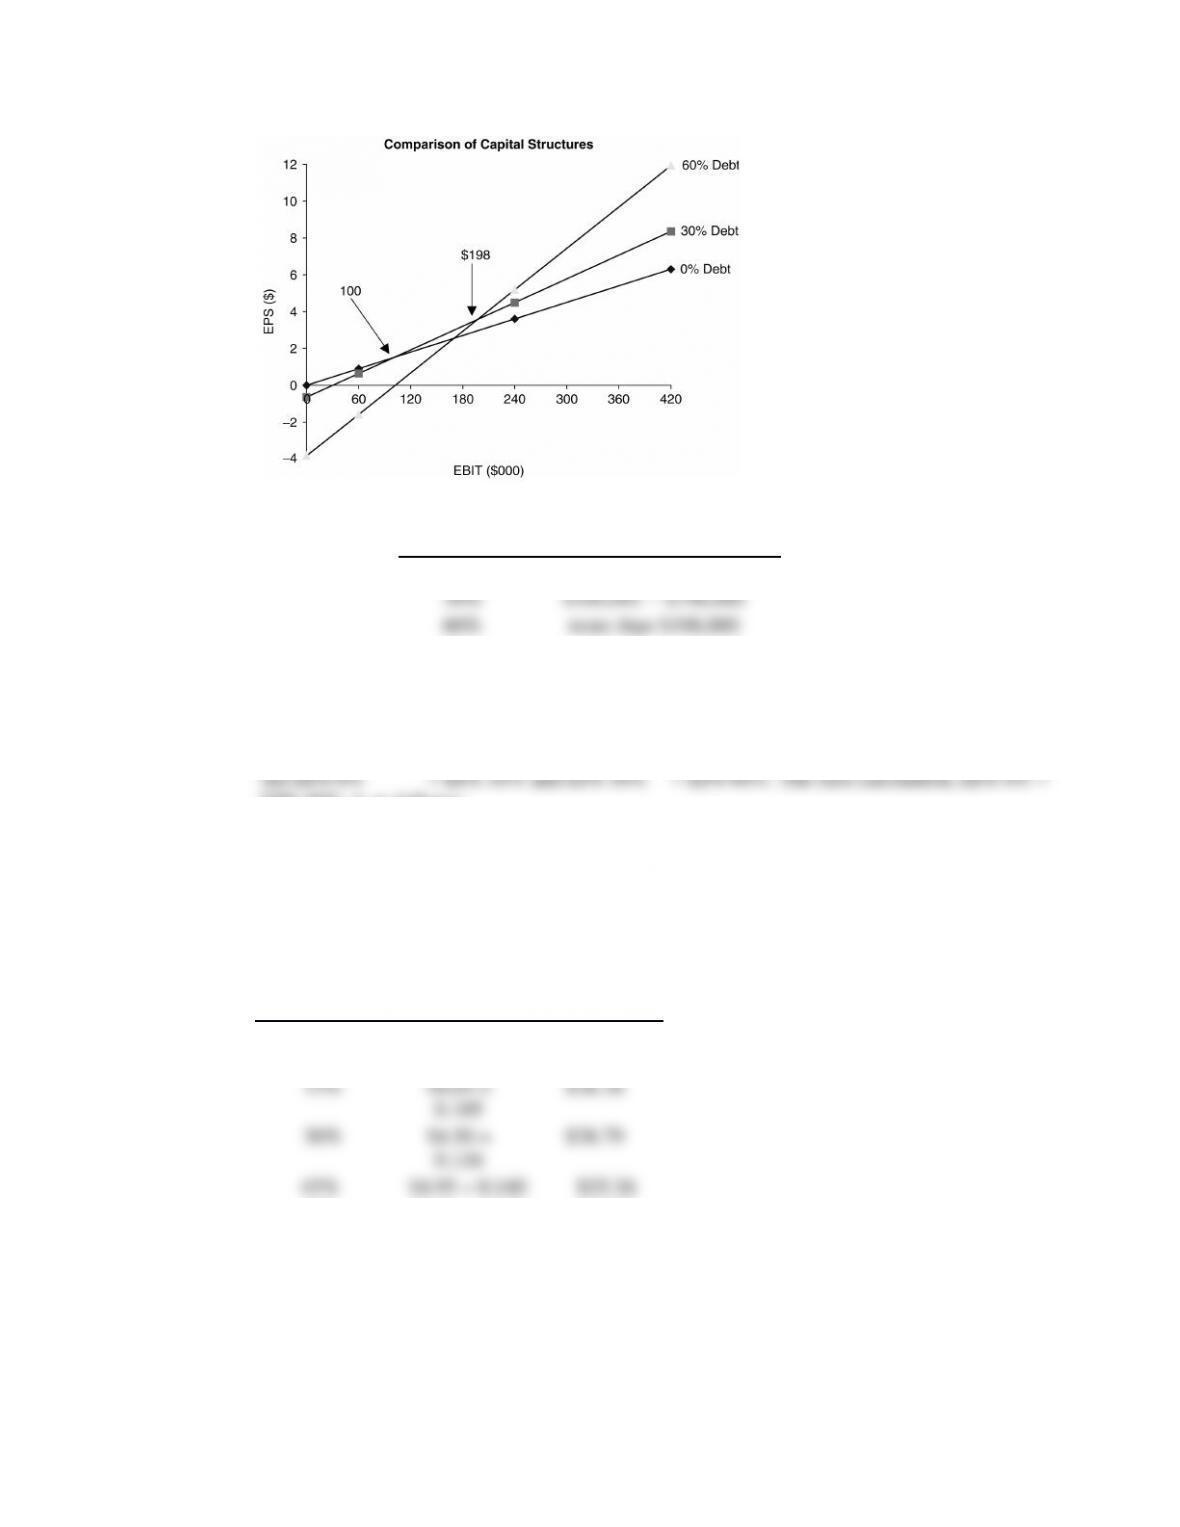
The EBIT ranges over which each capital structure is preferred are as follows:
Debt Ratio EBIT Range
0% $0 $100,000
To calculate the intersection points on the graphic representation of the EBIT-EPS approach to
capital structure, the EBIT level which equates EPS for each capital structure must be found,
using the formula in Footnote 18 of the text:
EPS 30%, is as follows:
The major problem with this approach is failure to focus on shareholder-wealth maximization.
h. Debt Ratio EPS rsShare Price
0% $3.60
0.100 $36.00
60% $5.18 0.200 $25.90
i. A 60% debt structure maximizes EPS, but a 30% debt structure maximizes share prices. A
capital structure with 30% debt is recommended because it maximizes shareholder wealth.