P13-13 Personal finance: Financial leverage (LG 2; Challenge)
a. Current DFL Initial Values Future Value % ∆
Available for making loan payment
Less: Loan payments
$3,000
$1,000
$3,300
$1,000
10.0%
0.0%
Proposed DFL Initial Values Future Value % ∆
Available for making loan payment
$3,000
$3,300
10.0%
b. and c.
The amount Max will have available after loan payments with his current debt changes by
1.5% for every 1% change in the amount he will have available to make the loan payment.
This is less responsive and, therefore, less risky than the 1.82% change in the amount available
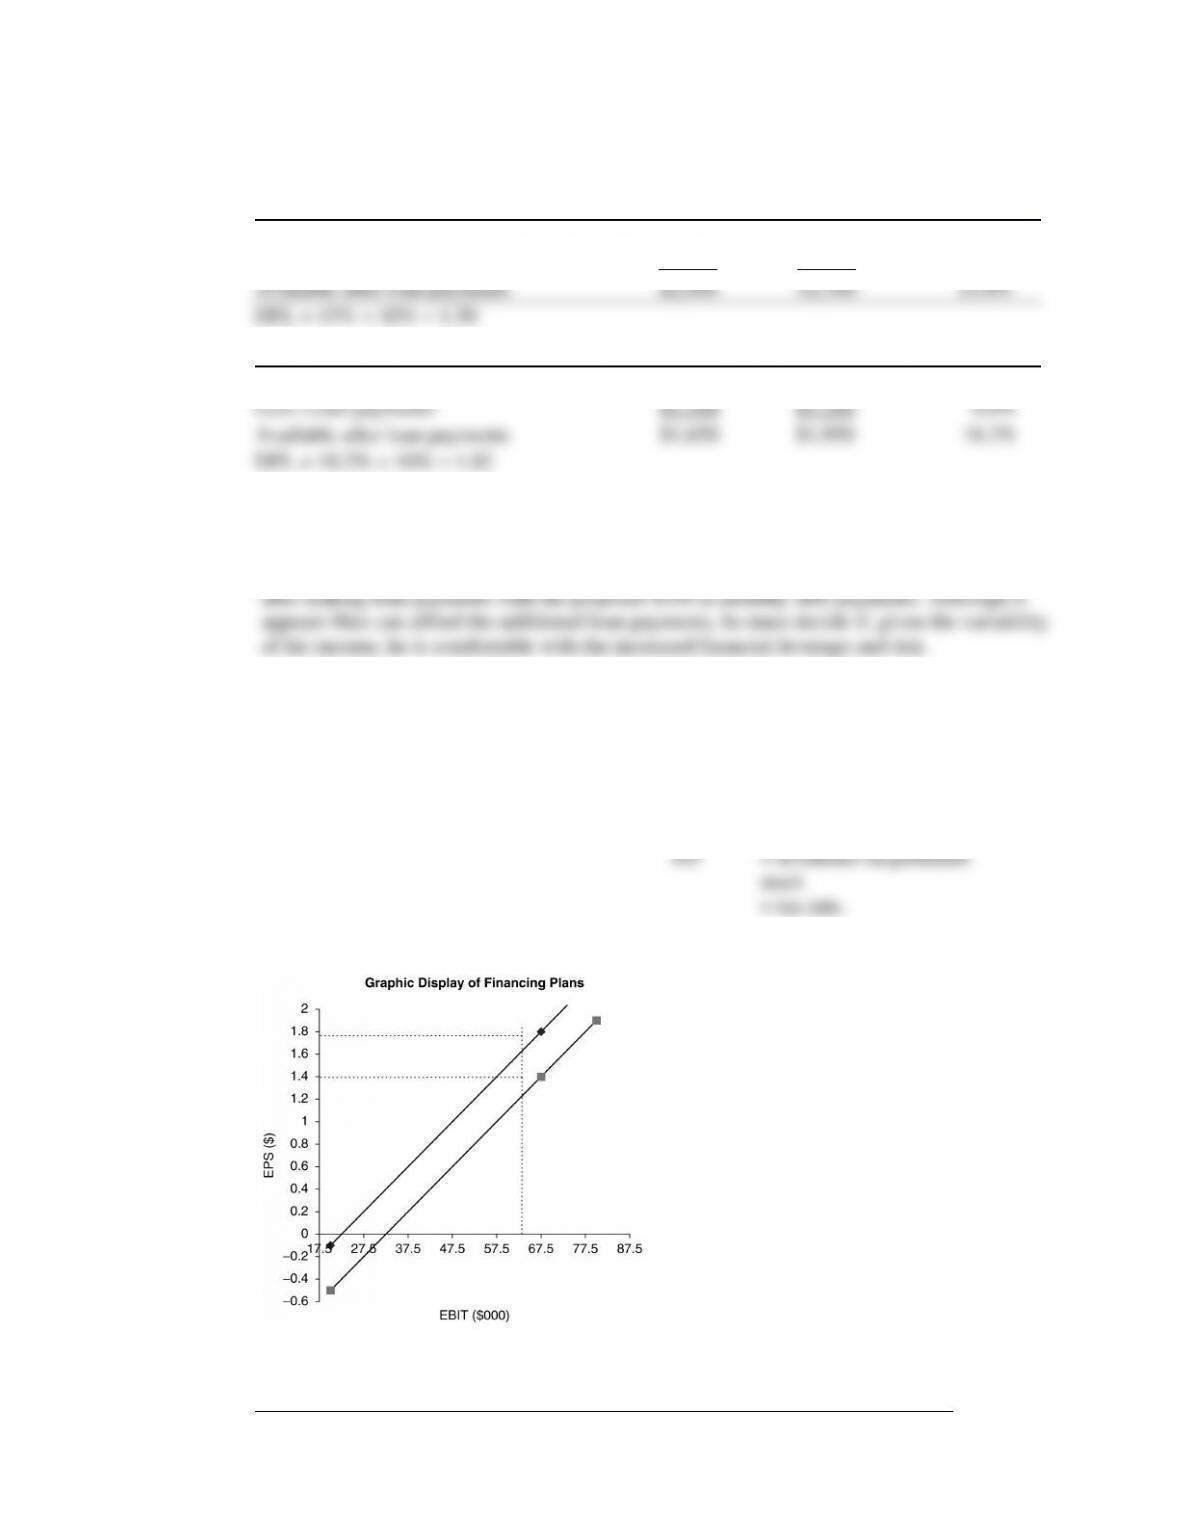
P13-14 DFL and graphic display of financing plans (LG 2, 5; Challenge)
a. Degree of financial leverage (DFL) is given by:
where:
EBIT = earnings before interest
and taxes
I = interest expense
b.
c.
d. See graph, which is based on the following equation and data points:
Financing EBIT EPS
Original
financing
$67,500
financing
plan
$17,500
e. The lines representing the two financing plans are parallel because the number of shares of
common stock outstanding is the same in each case. The financing plan, including the
preferred stock, leads to a higher financial breakeven point and lower EPS at any EBIT level.
P13-15 Integrative: Multiple leverage measures (LG 1, 2; Intermediate)
Let Q = unit sales, P = unit price, VC = variable costs, and FC = fixed costs.
b. Degree of operating leverage is given by:
c. Earnings before interest and taxes (EBIT) (P Q) FC (Q VC)
where:
I = interest expense
DFL is 1.31.
Note: With a 21% tax rate, DTL is 2.33.
P13-16 Integrative: Leverage and risk (LG 2; Intermediate)
a. Let Q = unit sales, P = unit price, VC = variable costs, and FC = fixed costs.
So,
Now,
where:
There are no preferred dividends, so:
b.
c. Firm R has less operating (business) risk but more financial risk than Firm W.
d. Two firms with differing operating and financial structures may be equally leveraged. Because
P13-17 Integrative—multiple leverage measures and prediction (LG 1, 2; Challenge)
a. Let Q = unit sales, P = unit price, VC = variable costs, and FC = fixed costs.
b. Sales ($6 30,000) $180,000
Less:
Fixed costs 50,000
Variable costs ($3.50 30,000) 105,000
Note: If the tax rate is 21% then net profits are $9,480, and earnings available for common
stockholders is $2,480.
c.
So,
d. Degree of financial leverage (DFL) is given by:
where:
I = interest expense
So,
where:
EBIT = earnings before interest and taxes PD = dividends on
f. DOL = %∆ EBIT % ∆ sales, so %∆ EBIT % ∆ sales DOL.
so New EBIT = $25,000 ($25,000 150%) $62,500.
Now, DTL = %∆ EPS %∆ in sales = %∆ common earnings %∆ in sales because outstanding
P13-18 Personal finance: Capital structures (LG 3; Intermediate)
Kirsten’s ratio is less than the bank maximum of 28%.
32.8%.
c. Kirsten’s ratios are below the bank maximums, so her loan application should be approved.
P13-19Various capital structures (LG 3; Basic)
Debt Ratio Debt Equity
10% $100,000 $900,000
20% $200,000 $800,000
Theoretically, the debt ratio cannot exceed 100%. Practically, few creditors would extend loans
P13-20 Debt and financial risk (LG 3; Challenge)
a. EBIT Calculation:
Probability 0.20 0.60 0.20
Sales $200,000 $300,000 $400,000
Less: Variable costs (70%) 140,000 210,000 280,000
Less: Fixed costs 75,000 75,000 75,000
b. EPS:
Earnings after taxes $(16,200) $ 1,800 $ 19,800
c. EBIT *$(15,000) $15,000 $45,000
Less: Interest 0 0 0
d. Summary statistics:
With Debt All Equity Including debt in Tower Interiors’ capital
structure produces a lower expected EPS, a higher
Expected
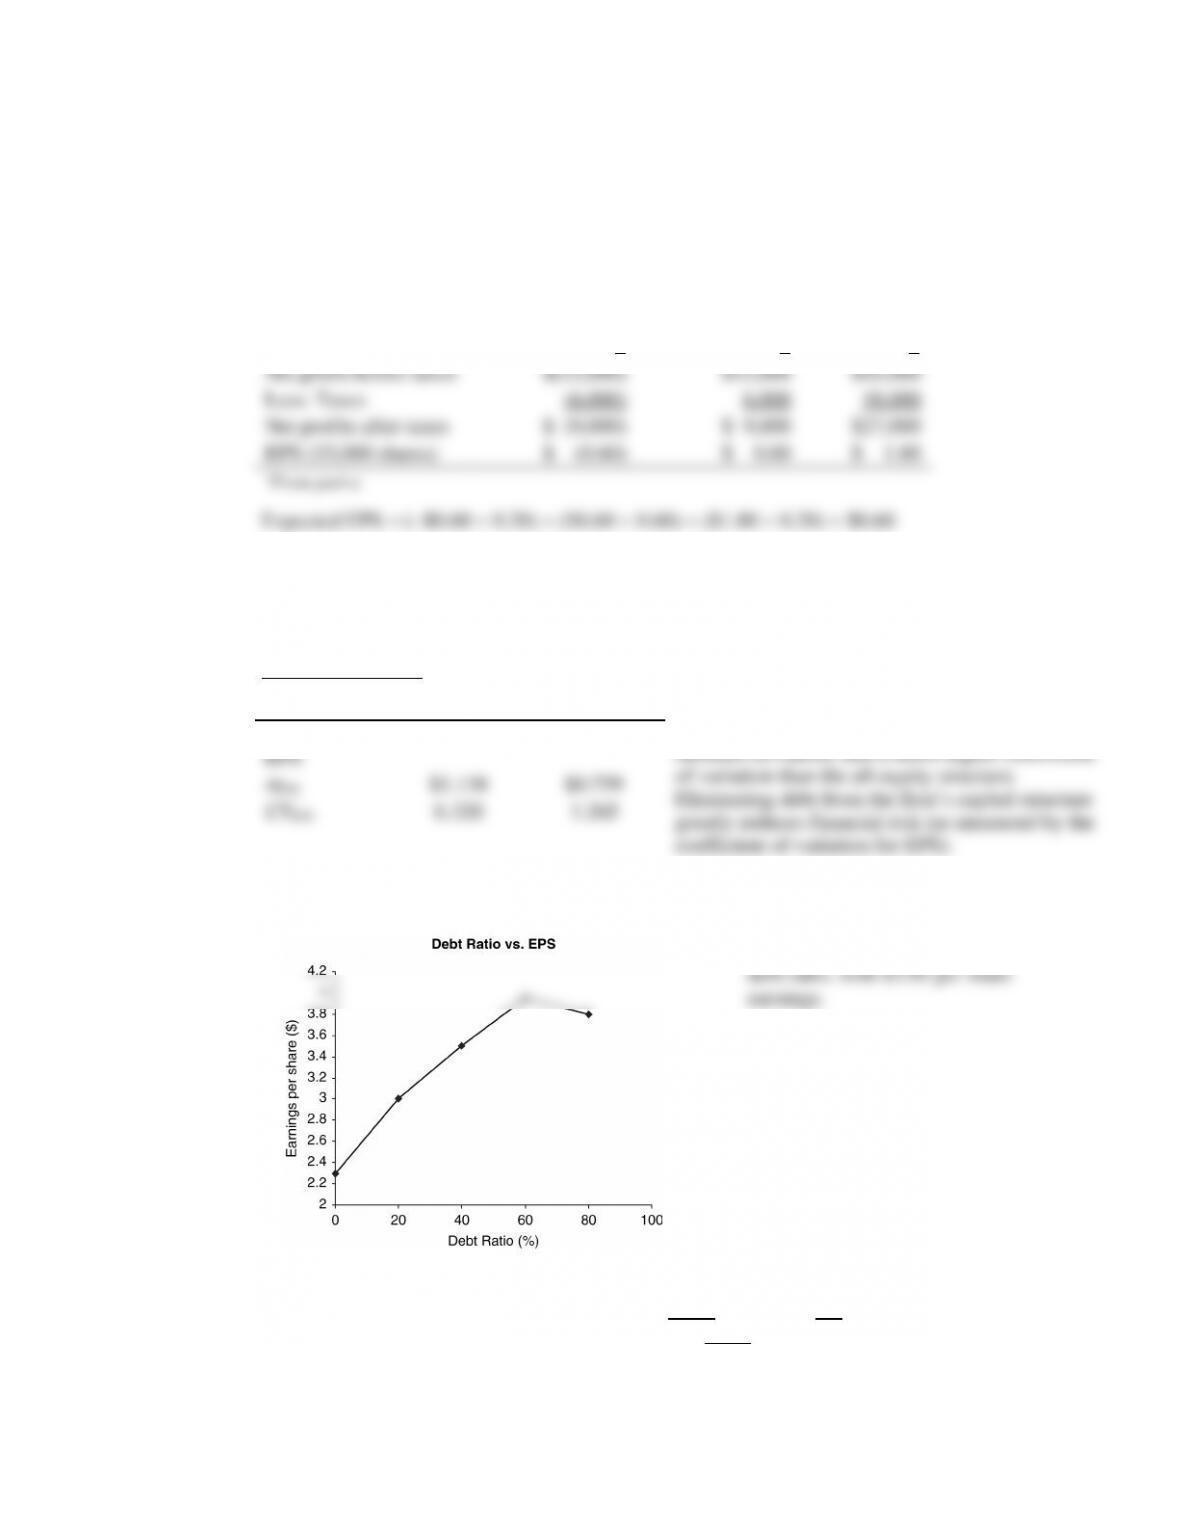
P13-21 EPS and optimal debt ratio (LG 4; Intermediate)
a. Maximum EPS appears to be at 60%
b. Debt
Ratio CV
0% 0.5
20 0.6
40 0.8
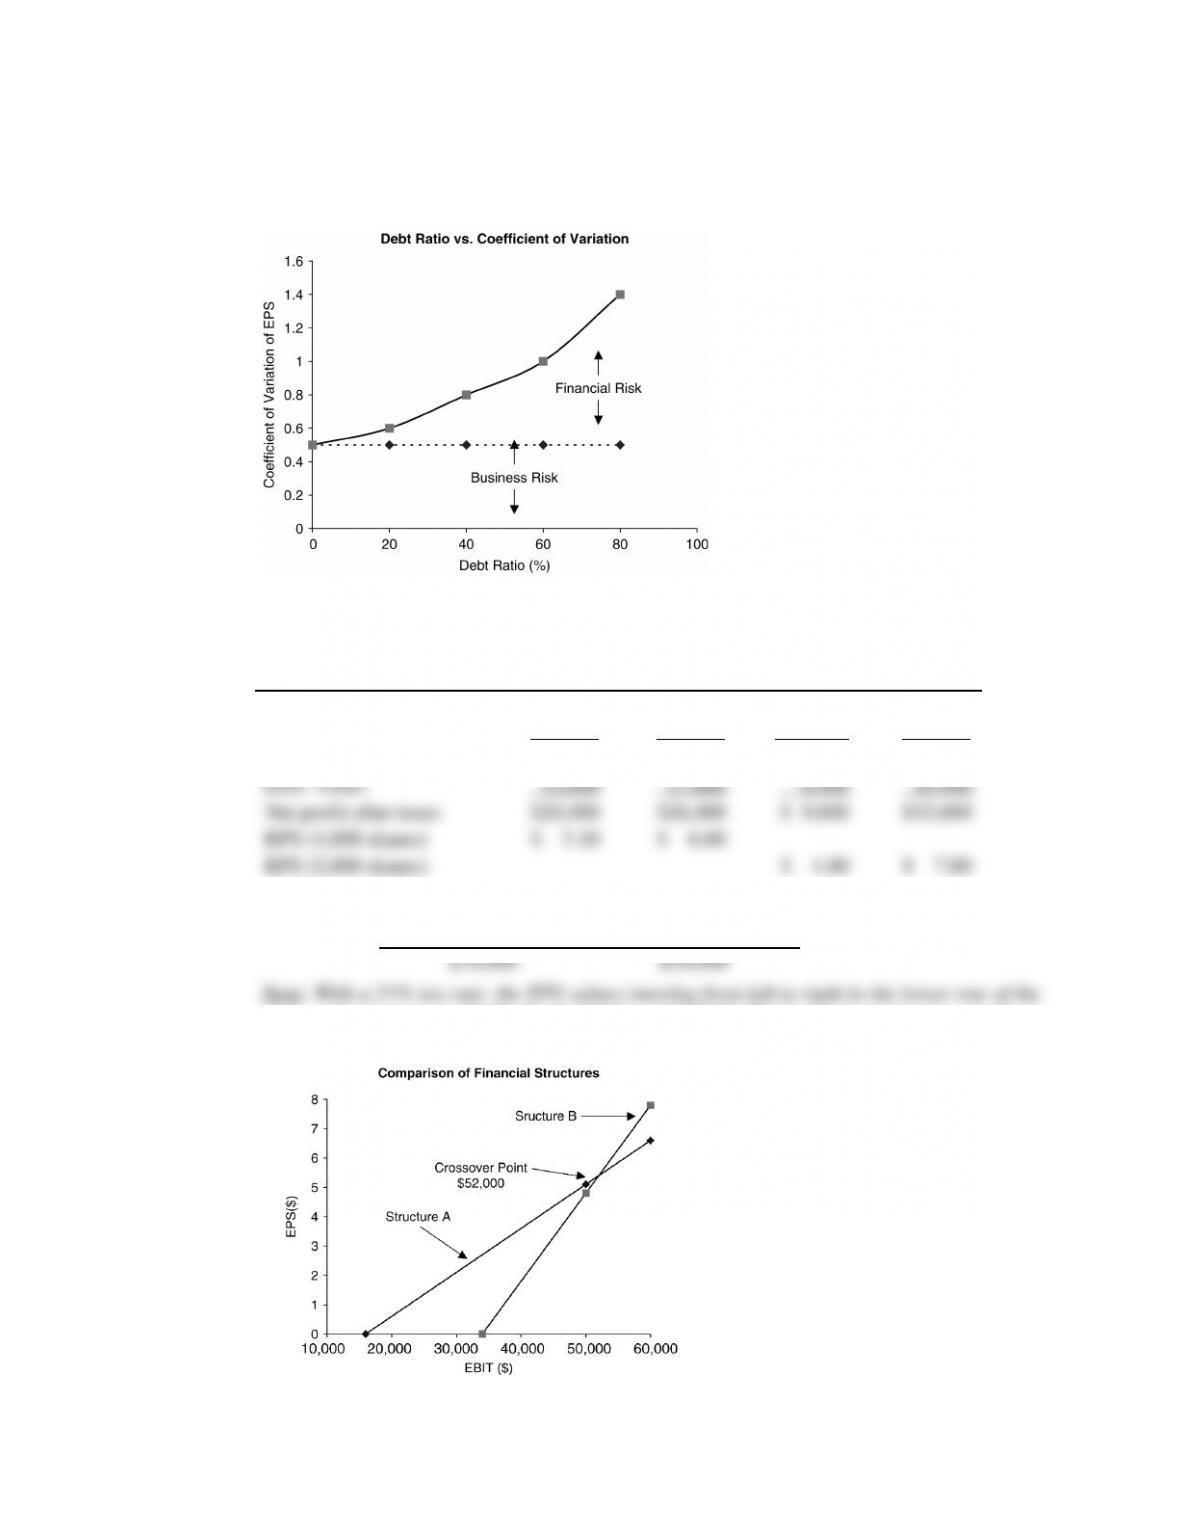
60 1.0
80 1.5
P13-22 EBIT-EPS and capital structure LG 5; Intermediate
a. Using $50,000 and $60,000 EBIT:
Structure A Structure B
EBIT $50,000 $60,000 $50,000 $60,000
Less: Interest 16,000 16,000 34,000 34,000
Net profits before taxes $34,000 $44,000 $16,000 $26,000
Financial breakeven points:
Structure A Structure B
table above) are $6.72, $8.69, $6.32, and $10.27. The breakeven points do not change.
b and c. If EBIT is expected to fall below
$52,000, Structure A is preferred and
if EBIT is expected to top $52,000,
Structure B is preferred.
Note: This holds true whether the tax rate is 40% or 21%. The graph corresponds to a 40%
EBIT (because taxes are lower), but they intersect at the same EBIT regardless of the tax rate.
d. Structure A offers less risk and lower returns as EBIT increases; structure B has more risk
because of its higher financial breakeven point. The steeper slope of the line for Structure B
e. If EBIT is greater than $75,000, Structure B should be recommended because changes in EPS
are much greater for given values of EBIT. Note: Again, this conclusion holds regardless of
the tax rate.
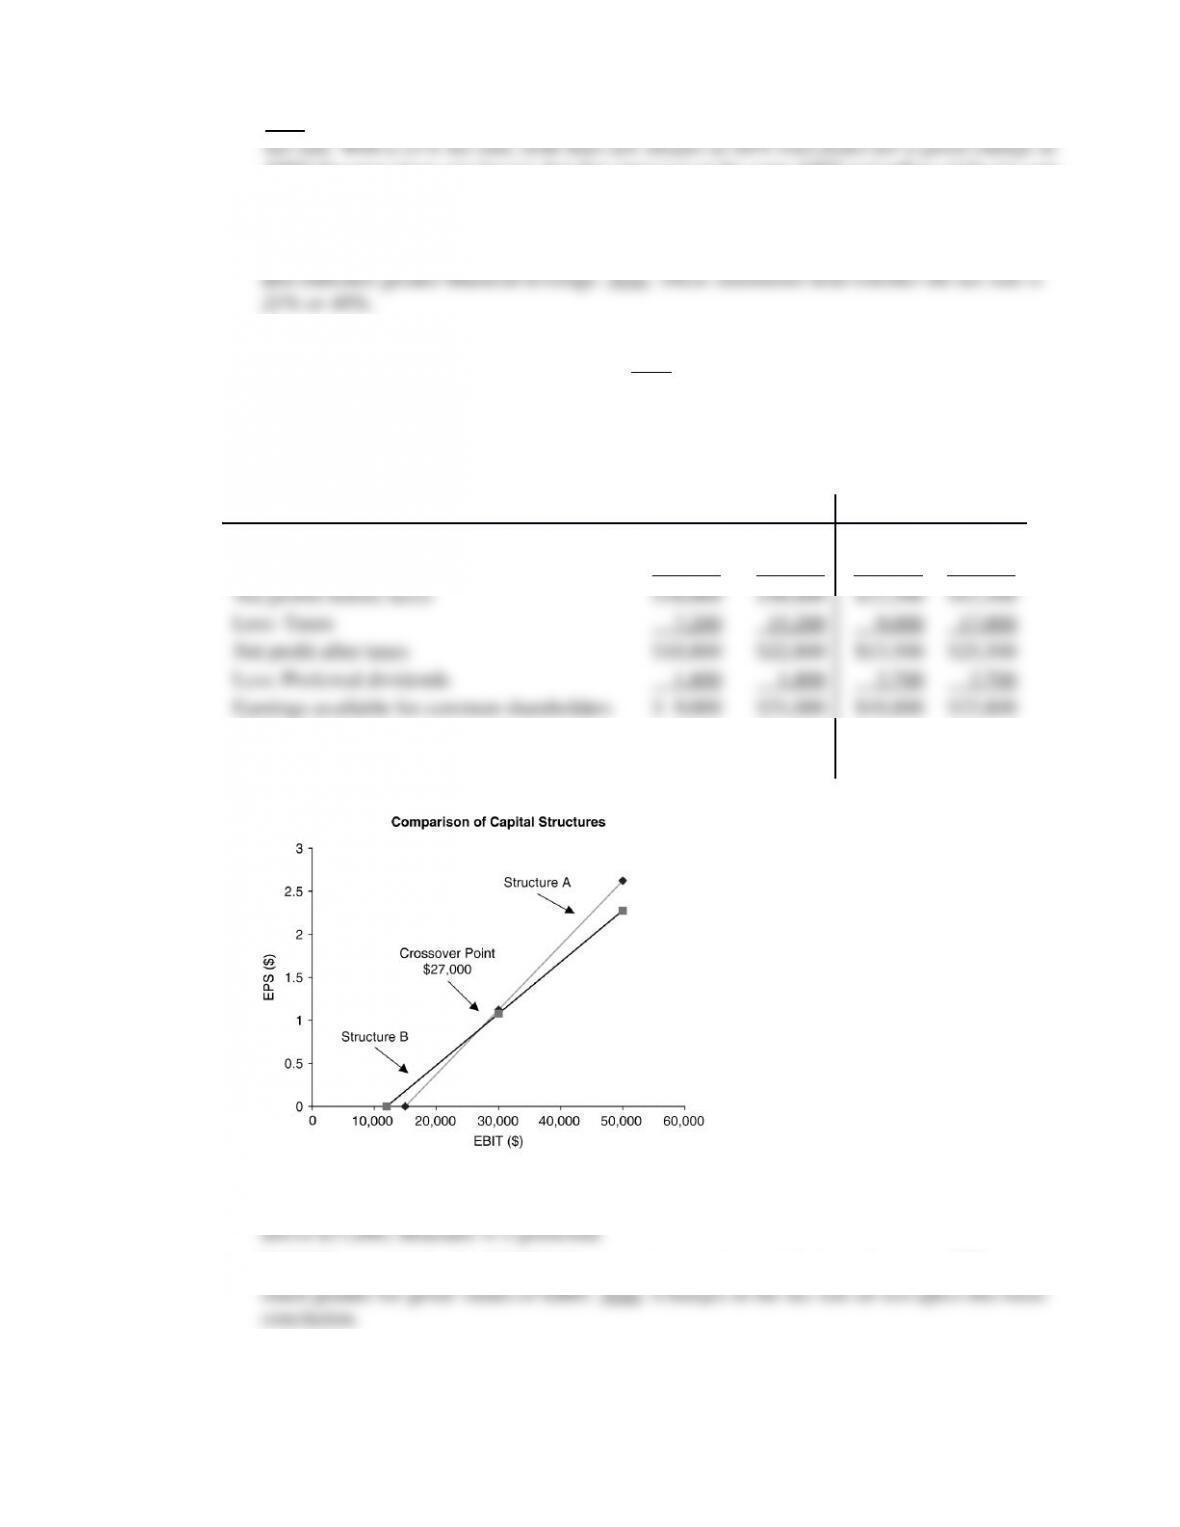
P13-23 EBIT-EPS and preferred stock (LG 5: Intermediate)
a. Structure A Structure B
EBIT $30,000 $50,000 $30,000 $50,000
Less: Interest 12,000 12,000 7,500 7,500
EPS (8,000 shares) $ 1.125 $ 2.625
EPS (10,000 shares) $ 1.08 $ 2.28
b.
c. Structure A has greater financial leverage, hence greater financial risk.
d. If EBIT is expected to be below $27,000, Structure B is preferred. If EBIT is expected to be
e. If EBIT is expected to be $35,000, Structure A is recommended since changes in EPS are
P13-24 Integrative: Optimal capital structure (LG 3, 4, 6; Intermediate)
a.
Debt Ratio 0% 15% 30% 45% 60%
EBIT $2,000,0
00 $2,000,0
00 $2,000,0
00 $2,000,0
00 $2,000,0
00
Less: Interest
0 120,0
00 270,0
00 540,0
00 900,0
00
Profits available to
common stock $1,000,0
00 $
928,000 $
838,000 $
676,000 $
460,000
b. Estimated share price (Po) = EPS required return on common stock (rs)
Debt: 0% Debt: 15% Debt: 60%
c. The optimal capital structure would be 30% debt and 70% equity because this debt/equity mix
maximizes the price of the common stock.