Part 6
Long-Term Financial Decisions
Chapters in This Part
Chapter 13 Leverage and Capital Structure
Chapter 14 Payout Policy
Integrative Case 6: O’Grady Apparel Company
Chapter 13
Leverage and Capital Structure
Instructor Resources
Chapter Overview
This chapter introduces students to operating and financial leverage and the associated business and financial
risks. As a prelude to operating leverage, breakeven analysis is explained (and its limitations noted) with help
from pictures and algebra. Next, the degree of operating, financial, and total leverage are introduced and
developed as tools for measuring the risk of the firm associated with differing operating and financial
structures. Finally, the notion of optimal capital structure— the mix of debt and equity that maximizes firm
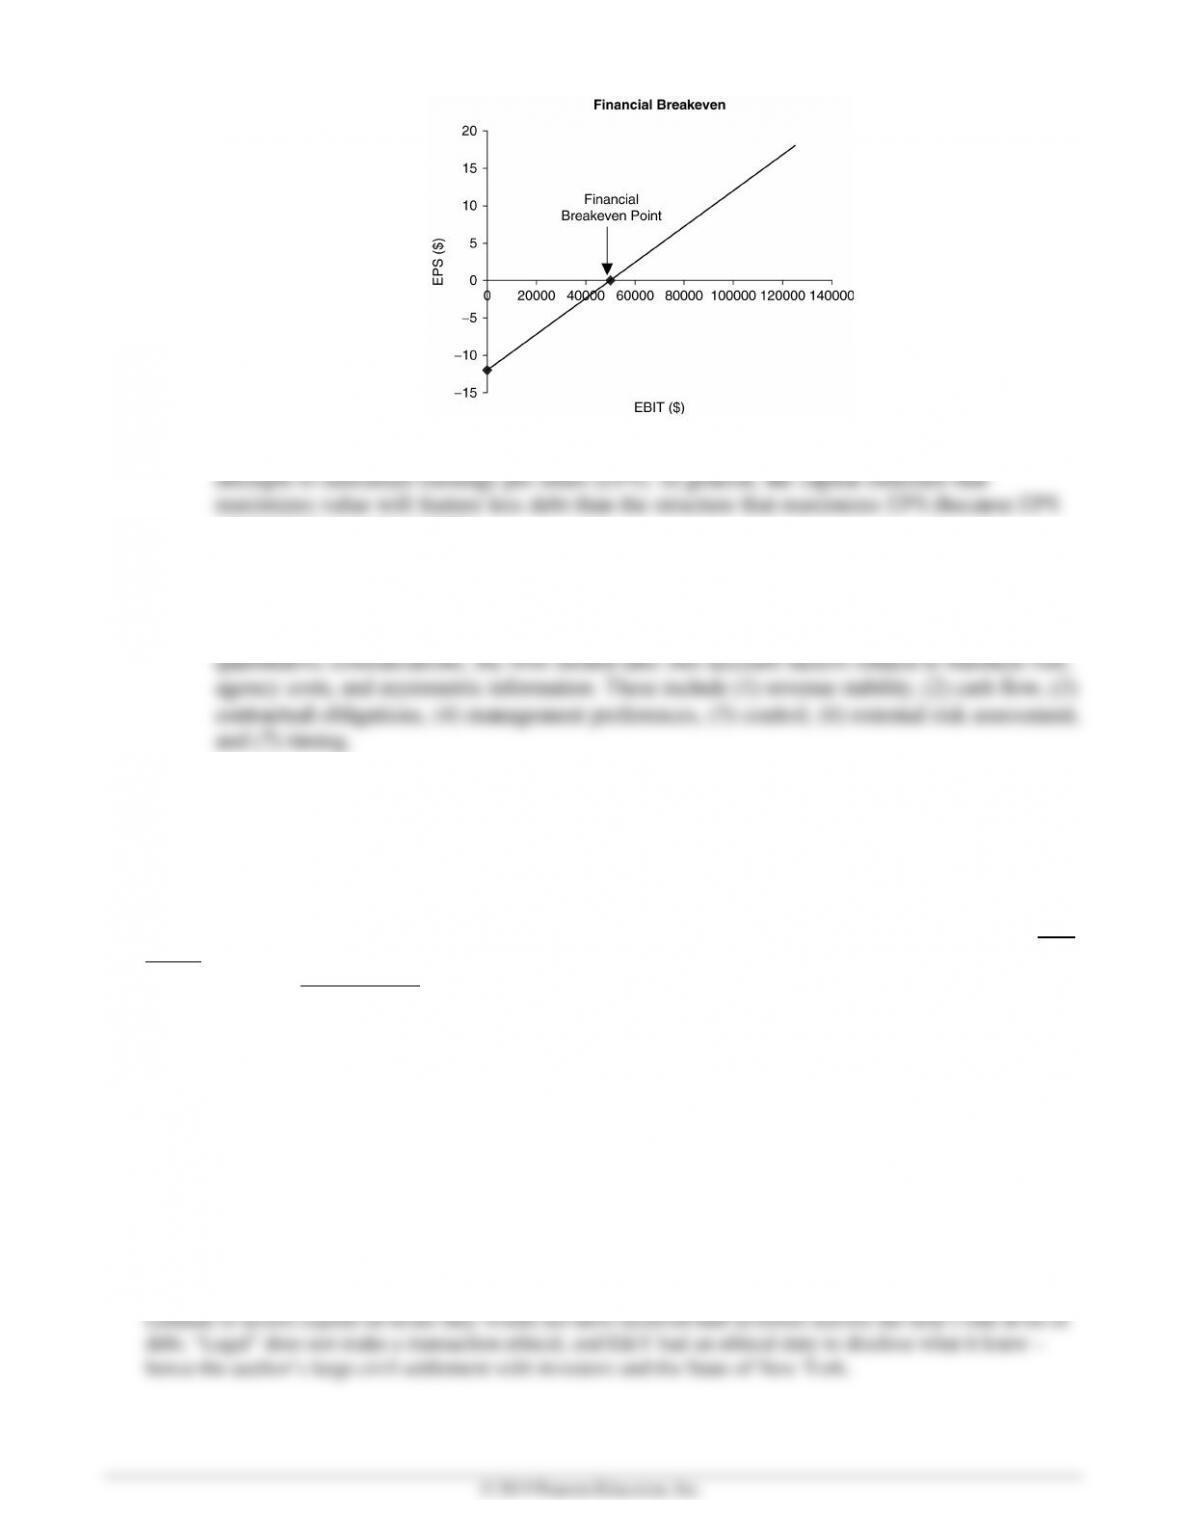
value—is introduced conceptually along with the EBIT-EPS and valuation model approaches to evaluating
capital structure. Chapter 13 concludes by showing how breakeven analysis, leverage, and risk arising from
borrowing will affect the personal as well as professional lives of students.
Note to instructors: After the first print run of this edition, Congress passed the Tax Cuts and Jobs Act, which
made sweeping changes to the corporate tax code. The original print run of this edition did not incorporate
any of the changes of that Act, but subsequent printings did. Some problems below have solutions for the
current 21% corporate tax rate (reflected in recent printings), as well as solutions for a tax rate (appearing in
the first print run) reflecting the older tax law.
Suggested Answer to Opener-in-Review
Use the following information about Apple’s revenues and earnings per share (EPS) to answer questions a–e:
a. Now that the company has decided to use the proceeds from a bond issue to repurchase shares, what
would you expect the effect of that decision to be on Apple’s degree of total leverage?
A company’s degree of total leverage is influenced both by its operating leverage and financial leverage.
In Apple’s case, operating leverage is unaffected by the decision to use the proceeds from the bond issue
b. Calculate the percentage change in revenues and in EPS from 2010 to 2011 and 2011 to 2012 (before
Apple altered its capital structure). What was Apple’s degree of total leverage (DTL) at this time?
From 2010 to 2011, the percentage change in revenues was 66.0%, and the percentage change in EPS
DTL2011-12 = 1.34.
c. Calculate the percentage changes in revenues and EPS from 2014 to 2015 and from 2015 to 2016 (after
Apple altered its capital structure). What was Apple’s degree of total leverage at this time?
From 2014 to 2015, the percentage changes in revenues was 27.9%, and the percentage change in EPS
d. Do your findings in questions b and c align with your expectations from question a?
Yes, intuition suggested an increase in total leverage. And on average, the degree of total leverage
e. What do you think happened to the beta of Apple’s common stock from 2010 to 2016?
One would expect an increase in Apple’s beta because an increase in total leverage makes the company’s
profits (and cash flows to shareholders) more sensitive to the ups and downs of the economy (and
market) than before the change in capital structure.
Answers to Review Questions
13-1 Leverage refers to the use of fixed expenses to magnify shareholder returns. Operating
leverage refers to the use of fixed operating costs to magnify the impact of changes in sales
revenue on earnings before interest and taxes (EBIT). Financial leverage refers to the use of
13-2 The firm’s operating breakeven point is the level of sales at which all fixed and variable
operating costs are covered, i.e., EBIT equals zero. An increase (decrease) in fixed operating
13-3 Operating leverage is the ability to use fixed operating costs to magnify the effects of
changes in sales on earnings before interest and taxes. Operating leverage results from the
where:
Q unit sales
13-4 Financial leverage refers to the use of fixed financial costs to magnify the effects of changes in
EBIT on earnings and earnings per share (EPS); it arises when a firm relies on funding sources
with fixed costs such as interest on debt and dividends on preferred stock. The degree of
EBIT earnings before interest and taxes PD dividends on preferred
stock
13-5 The total leverage of the firm is the combined effect of fixed costs (operating and financial)
on EPS; it reflects both operating and financial leverage. Increases in either type of leverage
will increase the total risk of the firm. Both types of leverage complement each other in the
13-6 A firm’s capital structure is the mix of long-term debt and equity it utilizes. The key
differences between debt and equity capital are summarized:
Characteristic Debt Equity
Voice in management*No Yes
Claims on income and assets Senior to equity Subordinate to debt
The degree of financial leverage in the firm’s capital structure can be measured directly with
the debt ratio and the debt-equity ratios or indirectly with the times interest earned and fixed-
13-7 In general, non-U.S. companies rely much more on debt than U.S. corporations. In large part,
this difference reflects the relative sophistication of U.S. capital markets, which offer a large
Apart from differences in leverage, the general tendencies in capital structure for U.S. firms
carry over to non-U.S. firms. For example, debt ratios within foreign-industry groupings
13-8 The tax deductibility of interest is the major benefit of debt finance. In effect, the government
subsidizes debt through the tax deduction— the deducting interest expense reduces the taxes
13-9 Business risk refers to fluctuations of the firm’s cash flows not traceable to fixed-cost
financing. Business risk reflects (i) fixed operating costs (operating leverage), revenue
other fixed-cost forms of financing. The more a firm relies on fixed-cost financing (debt,
leases, and preferred stock), the greater its financial leverage and financial risk.
13-10 An agency problem arises in borrowing because lenders provide funds based on their
expectations about firm risk. But firm managers can increase shareholder wealth by
increasing risk after loan terms have been set. Lenders protect themselves with a combination
enjoy lower interest expense and, perhaps, greater access to debt finance.
13-11 Asymmetric information results when a firm’s managers have more information about
operations and future prospects than investors. This information edge could cause financial
managers to raise funds using a pecking order (a hierarchy of financing beginning with
13-12 As financial leverage increases, both the cost of debt and the cost of equity increase, with
equity rising at a faster rate. As reliance on debt rises, the overall cost of capital first
13-13 The EBIT-EPS approach shows how different capital structures affect EPS over a range of
EBIT. The EBIT-EPS approach involves selecting the capital structure providing maximum
EPS, which admittedly may or may not be consistent with the maximization of share price. It
is used to select the best of a number of possible capital structures, rather than to determine
13-14 It is unlikely that attempts to maximize value would produce the same capital structure as
maximization neglects risk).
13-15 The firm should find the capital structure that balances risk and return to maximize share
value. This requires estimating EPS and required rates of return for different levels of debt
then choosing the debt-equity mix that produces the highest share price. In addition to
Suggested Answer to Focus on Practice Box: Qualcomm’s Leverage
Summarize the pros and cons of operating leverage.
Operating leverage exists when a firm uses fixed operating costs to magnify the impact of changes in sales on
earnings before interest and taxes (EBIT). The pros and cons stem from the impact of leverage on EBIT. The
upside: When a firm has fixed operating costs, an increase in sales will produce a greater-than-proportional
increase in EBIT. The downside: Operating leverage also magnifies the impact of a decline in sales on EBIT.
In FY 2011, for example, Qualcomm enjoyed a 32.4% increase in sales over the previous year, and the 1.5
degree of operating leverage (DOL) magnified this sales increase into a 48.6% jump in EBIT. In FY 2016, in
contrast, the 1.9 DOL turned a 6.8% fall off in sales caused EBIT to tumble 13.1%.
Suggested Answer to Focus on Ethics Box: “Repo 105 Man”
Because the Repo 105 deals took place in London, Lehman executives hid behind the legal blessing from a
U.K. law firm to escape U.S. prosecution. Does “legal” make the transactions ethical? What ethical duty did
E&Y have as Lehman’s auditor to go public with the intent of the Repo 105 transactions?
Lehman’s actions were aimed at misrepresenting the firm’s indebtedness to outsiders. In effect, investors
were not able to accurately gauge Lehman’s riskiness because of the Repo 105 transactions. This permitted
Answers to Warm-Up Exercises
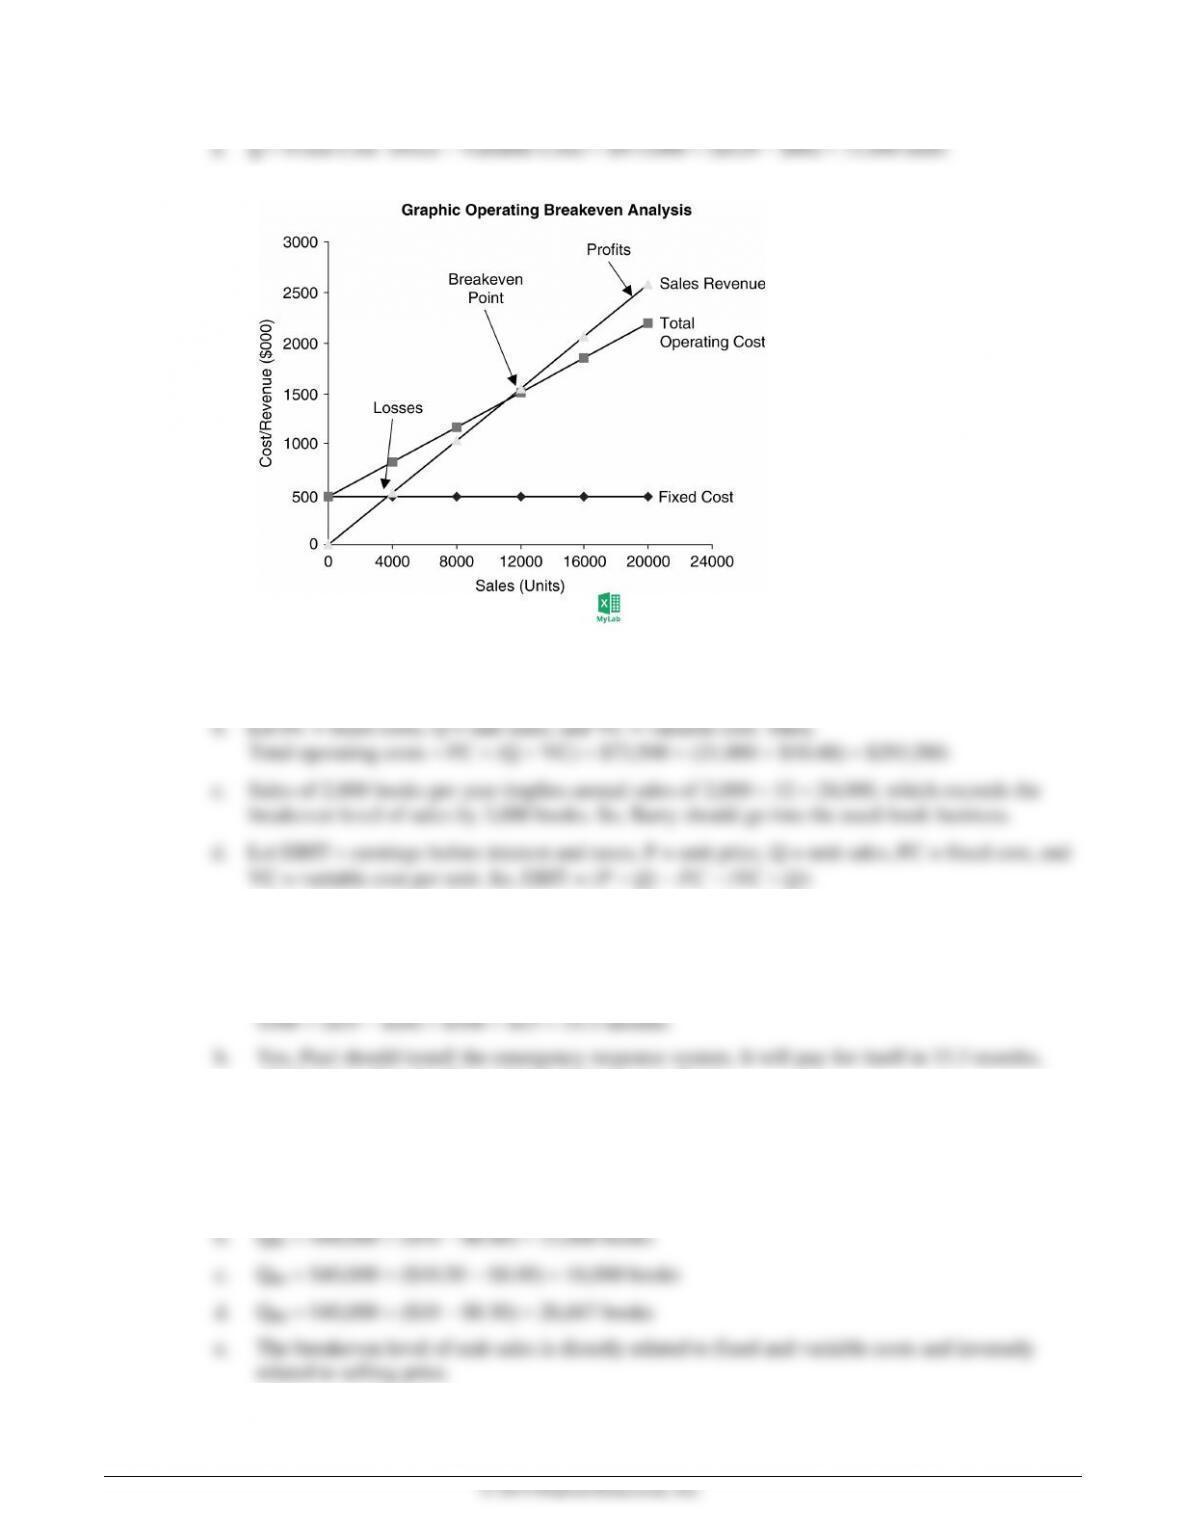
E13-1 Breakeven analysis
Answer: The operating breakeven point is the level of sales at which all fixed and variable operating costs
are covered and EBIT is equal to $0.
E13-2 Changing costs and the operating breakeven point
Answer: Calculate the breakeven point for the current process and the new process, then compare the two.
Current breakeven: Q1 $15,000 ($6.00 $2.50) 4,286 boxes
E13-3 Degree of operating leverage (DOL)
variable cost is $12 per unit, and fixed cost is $30,000.
E13-4 Degree of financial leverage (DFL)
Answer: Substitute earnings before interest and taxes (EBIT) $20,000, interest (I) $3,000, preferred
E13-5 Net operating profits after taxes (NOPAT)
Answer: To find the approximate value of Cobalt, first calculate earnings before interest and taxes (EBIT)
and then net operating profit after taxes (NOPAT):
EBIT Total revenue – Total cost
Weighted average cost of capital (WACC) is given as 8.5%, so an approximate value of the firm is
the firm will be $4,647,059.
Solutions to Problems
P13-1 Breakeven point: Algebraic (LG1; Basic)
Q = Fixed Cost (Price – Variable Cost) = $12,350 ($24.95 – $15.45) = 1,300.
P13-2 Breakeven comparisons: Algebraic (LG 1; Basic)
a. Q = Fixed Cost (Price – Variable Costs)
Firm F: Firm H:
P13-3 Breakeven point: Algebraic and graphical (LG 1; Intermediate)
b.
P13-4 Breakeven analysis (LG 1; Intermediate)
a. Let QBE = breakeven level of unit sales, FC = fixed cost, P = price, and VC = variable cost per
unit. QBE = FC (P – VC) = $73,500 ($13.98 – $10.48) = 21,000 books.
EBIT ($13.98 24,000) $73,500 ($10.48 24,000) $10,500
P13-5 Personal finance: Breakeven analysis (LG 1; Easy)
a. Breakeven point in months fixed cost ÷ (monthly benefit – monthly variable costs)
which is less than the 36 months he plans to own the car.
P13-6 Breakeven point: Changing costs/revenues (LG 1; Intermediate)
Let QBE = breakeven level of unit sales, FC = fixed cost, P = price, and VC = variable cost per unit.
a. QBE FC (P VC) $40,000 ($10 $8.00) 20,000 books
P13-7 Breakeven analysis (LG 1; Challenge)
Let Q = unit sales, FC = fixed cost, P = price, and VC = variable cost per unit.
a. QBreakeven = FC (P VC) = $4,000 ($8.00 – $6.00) = 2,000 figurines.
d. EBIT = Sales revenue – Total cost (= Fixed cost + Variable cost) = (P Q) – FC – (Q VC)
e. One alternative is to price the units differently based on variable cost. Those more costly to
produce would have higher prices than the less expensive production models. If Molly and
Caitlin want to maintain the same price for all units, they may need to reduce selection from the
P13-8 EBIT sensitivity (LG 2; Intermediate)
a. and b. 8,000 Units 10,000 Units 12,000 Units
Sales $72,000 $90,000 $108,000
Less: Variable costs 40,000 50,000 60,000
c. Unit Sales 8,000 10,000 12,000
% ∆ in unit sales (8,000 10,000) 10,000 0 (12,000 10,000) 10,000
20% 20%
d. A given percentage change in sales produces a larger percentage change in EBIT.
P13-9 Degree of operating leverage (DOL) (LG 2; Intermediate)
a. Let QBE = breakeven level of unit sales, FC = fixed cost, P = price, and VC = variable cost per
unit. QBE FC (P VC) = $380,000 ($63.50$16) = 8,000 units.
b. 9,000 Units 10,000 Units 11,000 Units
Sales $571,500 $635,000 $698,500
c.
∆ in unit sales 1,000 01,000
% ∆ in sales 1,000 10,000 10% 01,000 10,000 10%
e. Let Q = unit sales, P = unit price, VC = variable costs, and FC = fixed costs.
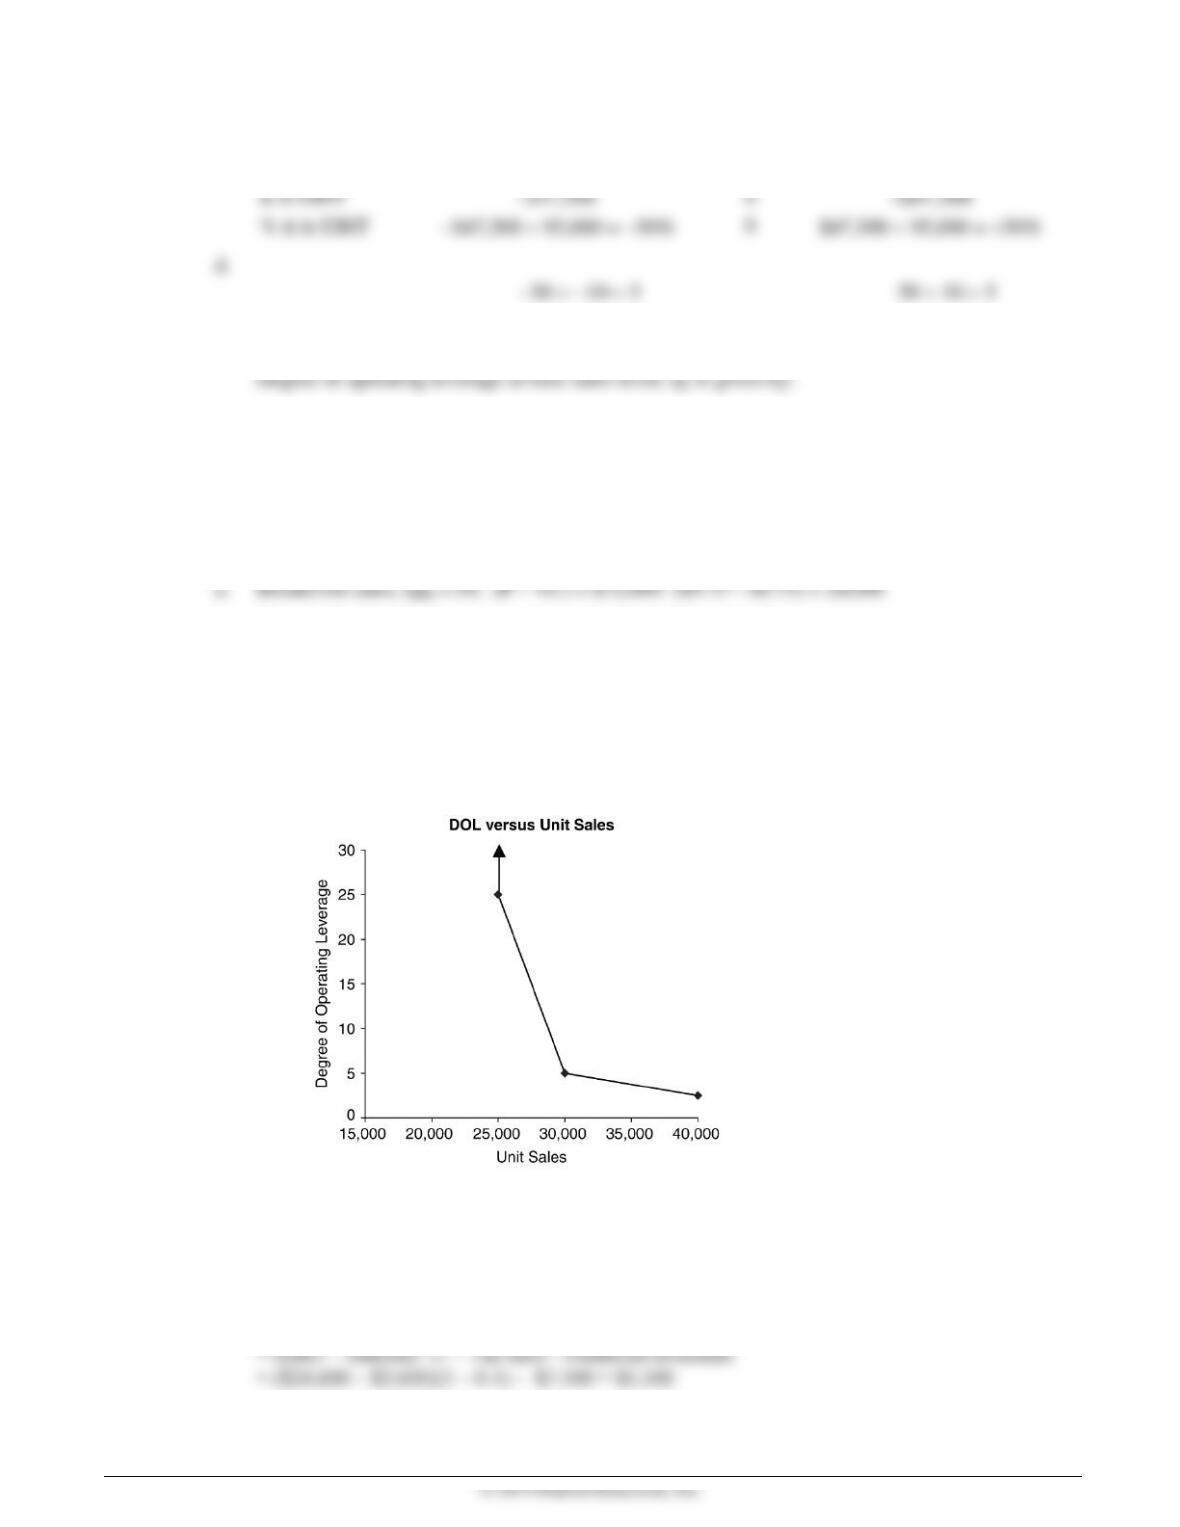
P13-10 Degree of operating leverage (DOL): Graphical (LG 2; Intermediate)
Let Q = unit sales, P = unit price, VC = variable costs, and FC = fixed costs.
b. Degree of operating leverage at base sales level, Q, is given by:
c.
d. At the operating breakeven point, DOL is infinite.
e. DOL decreases as the firm expands beyond the operating breakeven point.
P13-11 EPS calculations (LG 2; Intermediate)
a. Common earnings = EBIT – Interest – Taxes – Dividends on preferred stock
Earnings per share (EPS) = Common earnings Common shares outstanding
EPS = $11,340 4,000 = $2.835
P13-12 Degree of financial leverage (LG 2; Intermediate)
a. EBIT $80,000 $120,000
Less: Interest 40,000 40,000
PD = preferred stock dividends
T = tax rate
c. EBIT $80,000 $120,000
Less: Interest 16,000 16,000
Alternatively, if the tax rate is 21% the EPS values are $16.85 and $27.39.