
Part 4
Risk and the Required Rate of Return
Chapters in this Part
Chapter 8 Risk and Return
Chapter 9 The Cost of Capital

Chapter 8
Risk and Return
Instructor’s Resources
Chapter Overview
This chapter focuses on the fundamentals of risk and return—beginning with simple definitions of total and
expected return, risk neutral, risk averse, and risk seeking. The discussion then moves to risk measurement by
focusing on a single asset and measuring risk with statistics associated with a probability distribution—
namely, mean, standard deviation, and coefficient of variation. To demonstrate that insights about risk for a
single asset do not necessarily carry through to a collection of assets, the discussion broadens to risk and
return for a portfolio. Diversification is introduced through examination of risk for a portfolio of positively
correlated, negatively correlated, and uncorrelated assets. The key takeaway is that the volatility (risk) of a
portfolio will be less than a weighted average of the volatilities of the assets in the portfolio as long as the
correlation is less than 1.0. The potential for risk-reduction through international diversification is offered as an
intuitive example. These ideas are used to motivate the Capital Asset Pricing Model (CAPM). Diversifiable
and nondiversifiable risk are distinguished, with the key idea that the market only rewards bearing
nondiversifiable risk because firm-specific risk can so easily be eliminated through diversification. Then, the
CAPM equation and its pictorial representation (Security Market Line or SML) are introduced to show the
link between return and nondiversifiable risk. The chapter concludes by illustrating the impact of changes in
inflation expectations and investor risk aversion on the SML.
Answers to Review Questions
8-1. Risk refers to the uncertainty about the return an investment will earn.
8-2 Total return (gain or loss) on an investment over a given time period is the change in value over that
period plus any cash distributions, expressed as a percentage of beginning-of- period value.
8-3 a. Risk-averse investors dislike risk and, therefore, expect higher returns on riskier investments.
b. Risk-neutral investors select investments based on expected return—the higher the better—without
regard to risk. Such investors require no compensation for bearing more risk.
8-4. Scenario analysis assesses asset risk using more than one possible set of returns to gauge the variability
of outcomes. Range—a measure of variability—is found by subtracting the pessimistic outcome from
© 2019 Pearson Education, Inc.
E8-1 Total annual return (LG 1)
ttt
CPP
−
+
−
E8-2 Expected return (LG 2)
1 0.35 5% 1.75%
3 0.20 10% 2.00%
E8-3 Comparing the risk of two investments (LG 2)
=
σ
E8-4 Computing the expected return of a portfolio (LG 3)
E8-5 C
a
Answer
:
a
lculating a
p
Portfolio
b
n
y
t
a
d
d
e
p
ortfolio bet
a
b
eta is just th
e
a
(LG 5)
e
weighted a
v
v
erage of bet
a
a
s of individu
Chapter
al portfolio c
o
8 Risk and R
e
o
mponents,
m
e
turn 149
m
eaning
a
:
a
R
M
e
r
s
t
t
k
r
a
c
e
0
0
g
m
e
n
x
e
e
M
n
r
e
a
© 2019 Pearson Education, Inc.
−
P8-2 Return calculations (LG 1; Basic)
Total return on an investment is given by:
1
()
tt t
PP C
−−
+
P8-3 Risk preferences (LG 1; Intermediate)
a. If Sharon were risk neutral, differences in risk would not enter into her decision; she would care
only about expected return. Moreover, she would not have a preference among investment A, B,
or C because all three provide a 14% expected return.
P8-4 Risk analysis (LG 2; Intermediate)
a. Range is the difference between return with the best outcome and return with the worst.
Expansion Range
−
© 2019 Pearson Education, Inc.
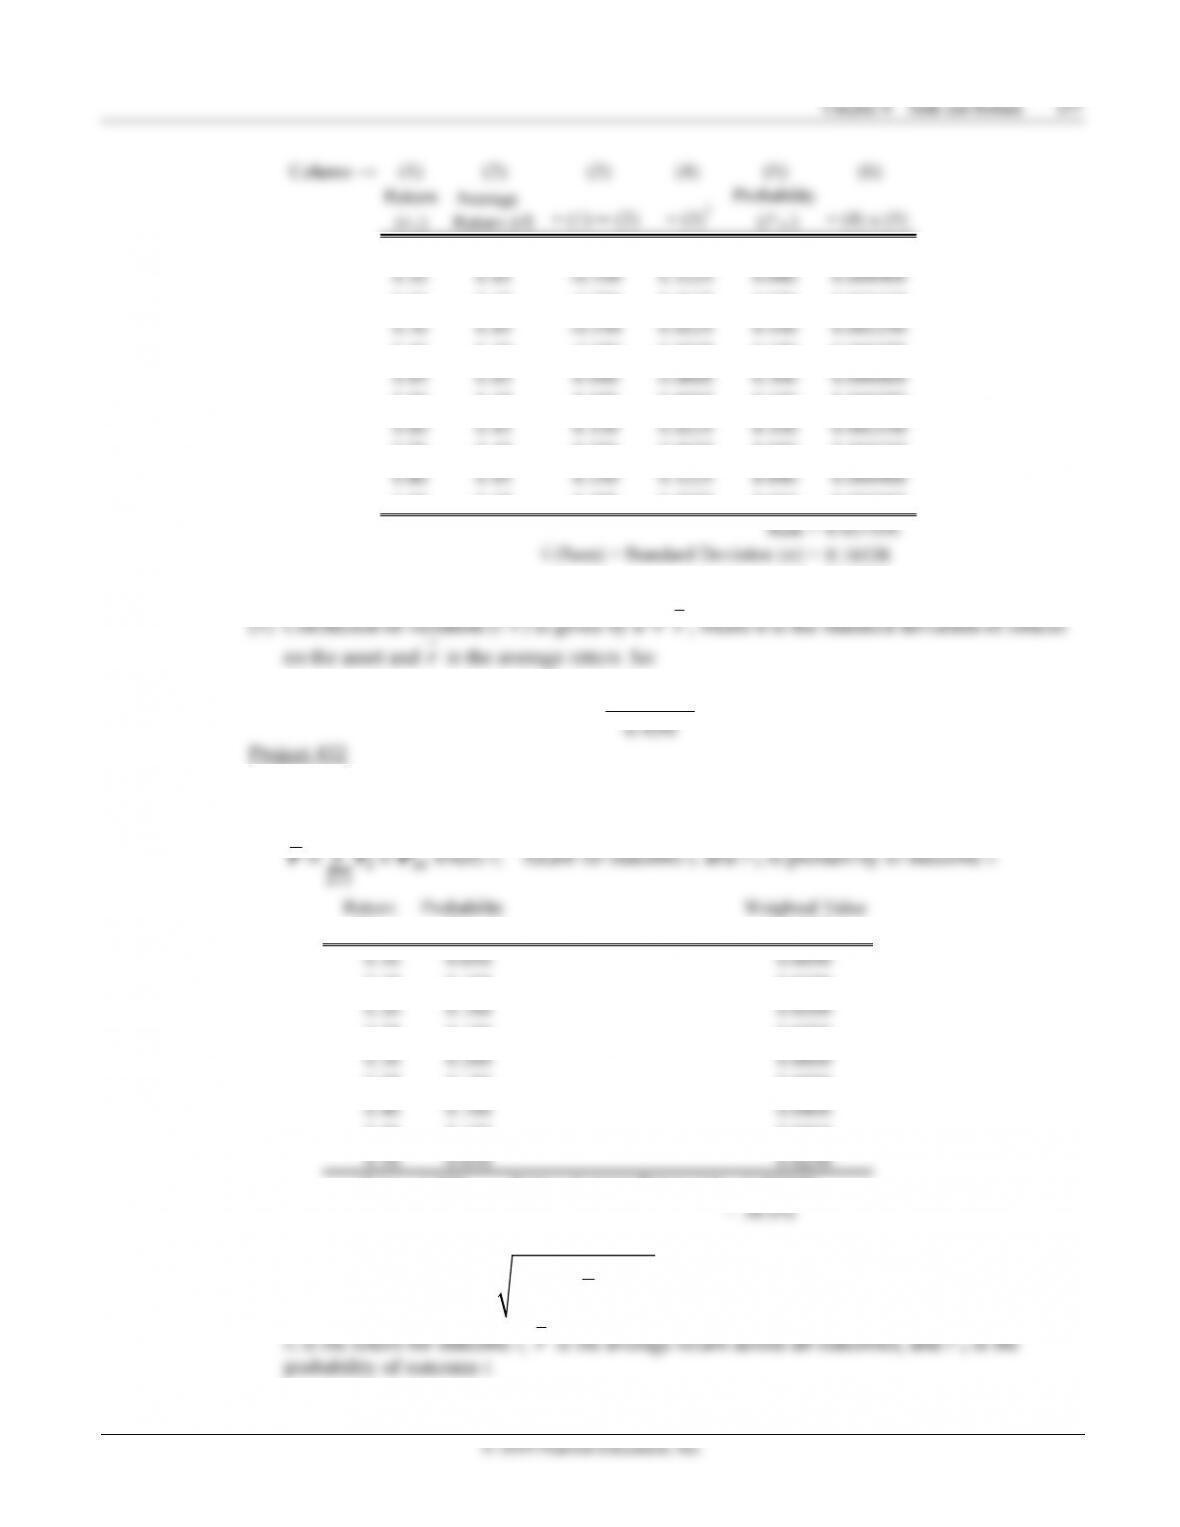
P8-5 Risk and probability (LG 2; Intermediate)
a. Range is the difference between return with the best outcome and return with the worst.
Camera Range
1.00 Expected return = 25.00%
1.00 Expected return = 25.50%
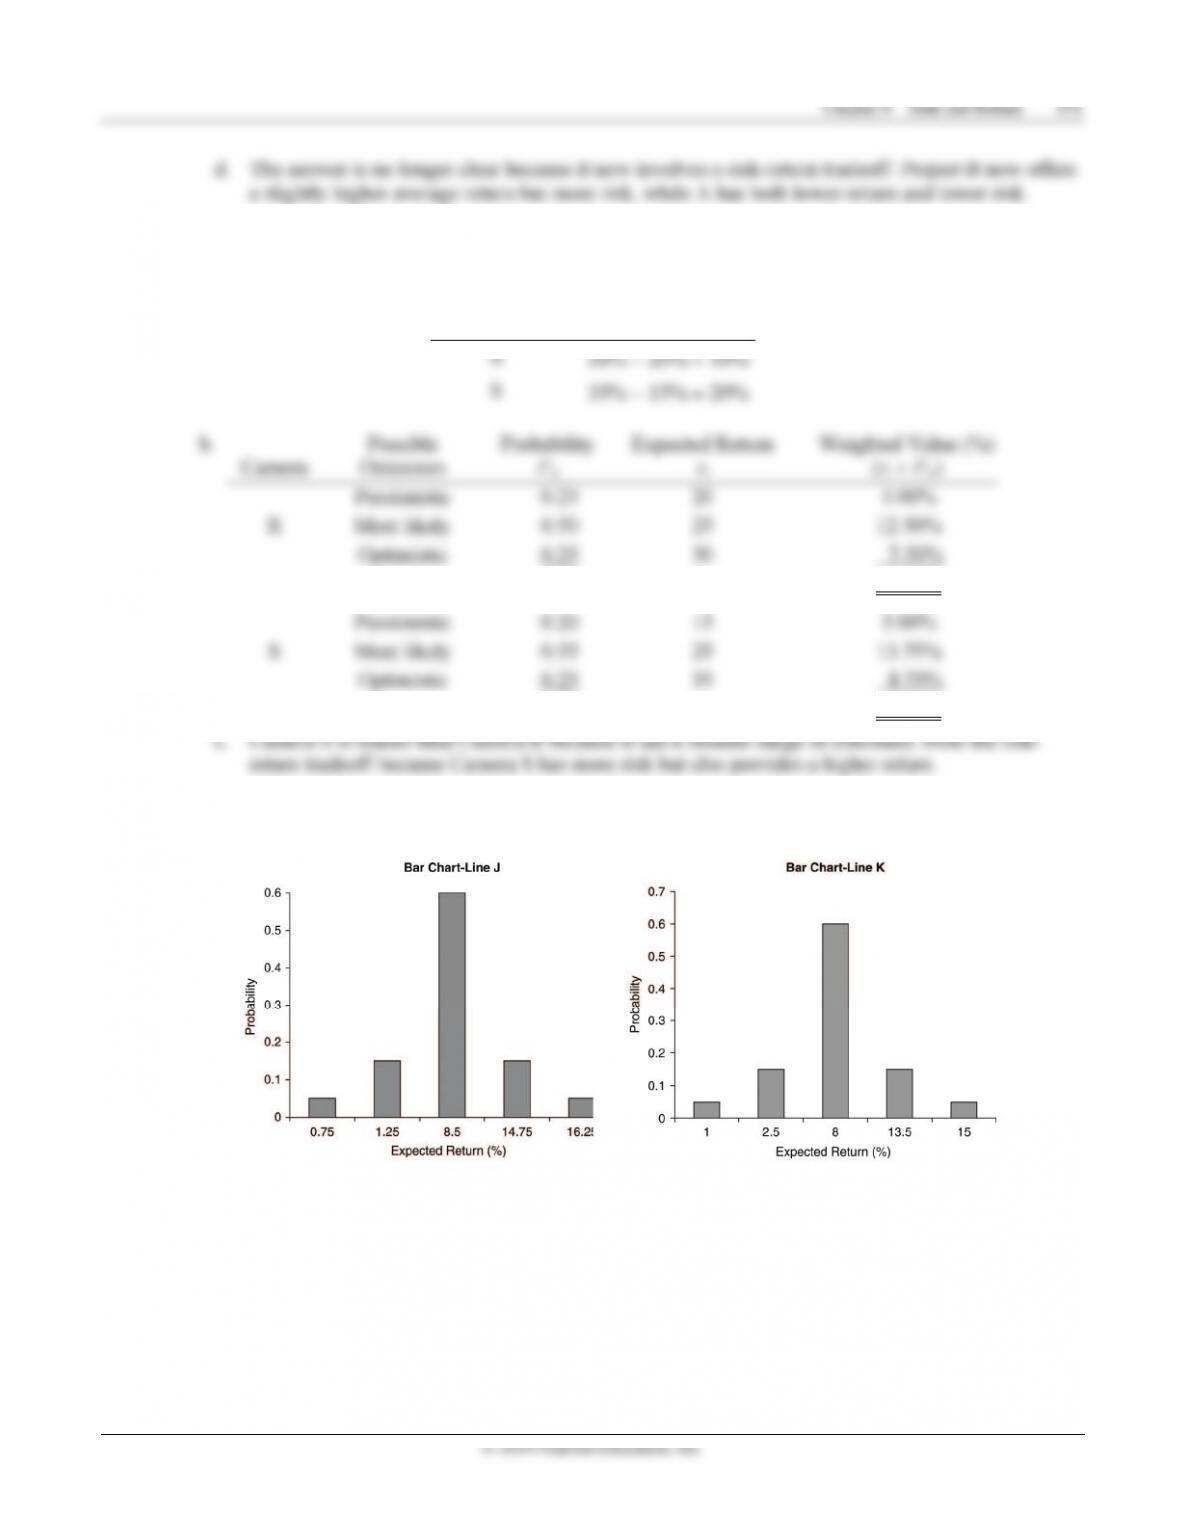
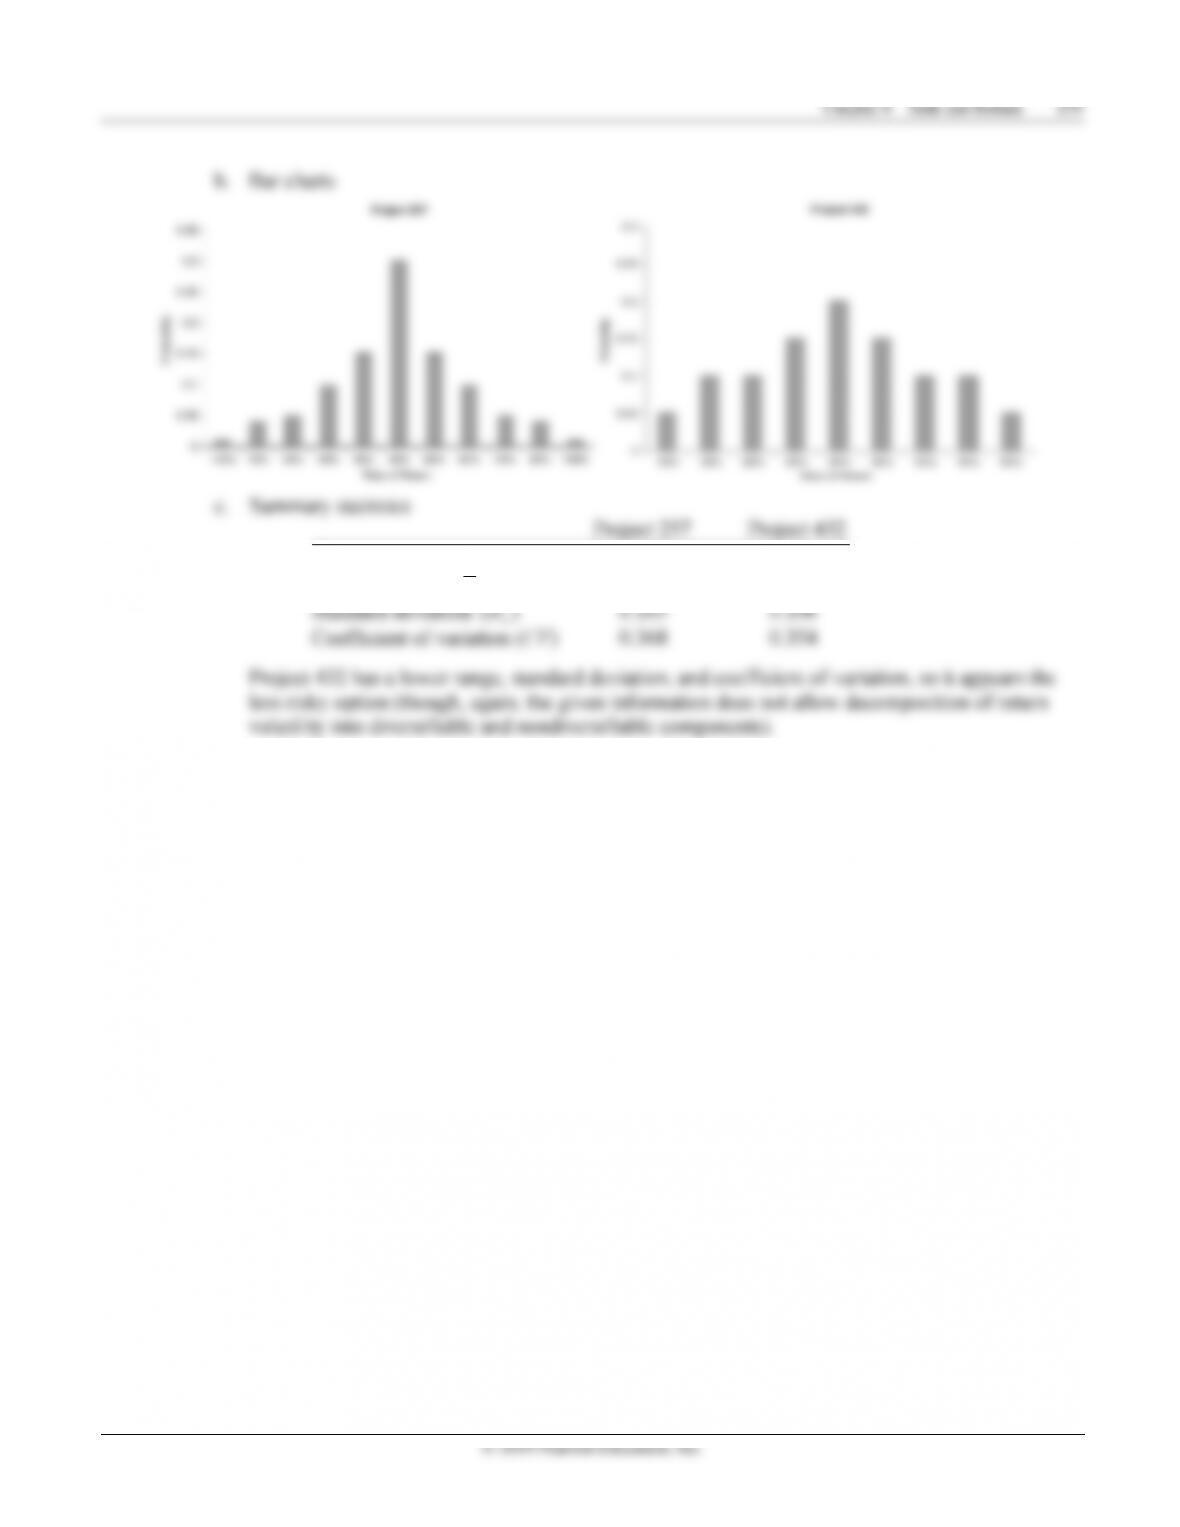
P8-6 Bar charts and risk (LG 2; Intermediate)
a.
© 2019 Pearson Education, Inc.
Poor 0.15 0.0125 0.001875
J Average 0.60 0.0850 0.051000
1.00 Expected return = 0.083500
Very Poor 0.05 0.010 0.000500
Good 0.15 0.135 0.020250
Excellent 0.05 0.150 0.007500
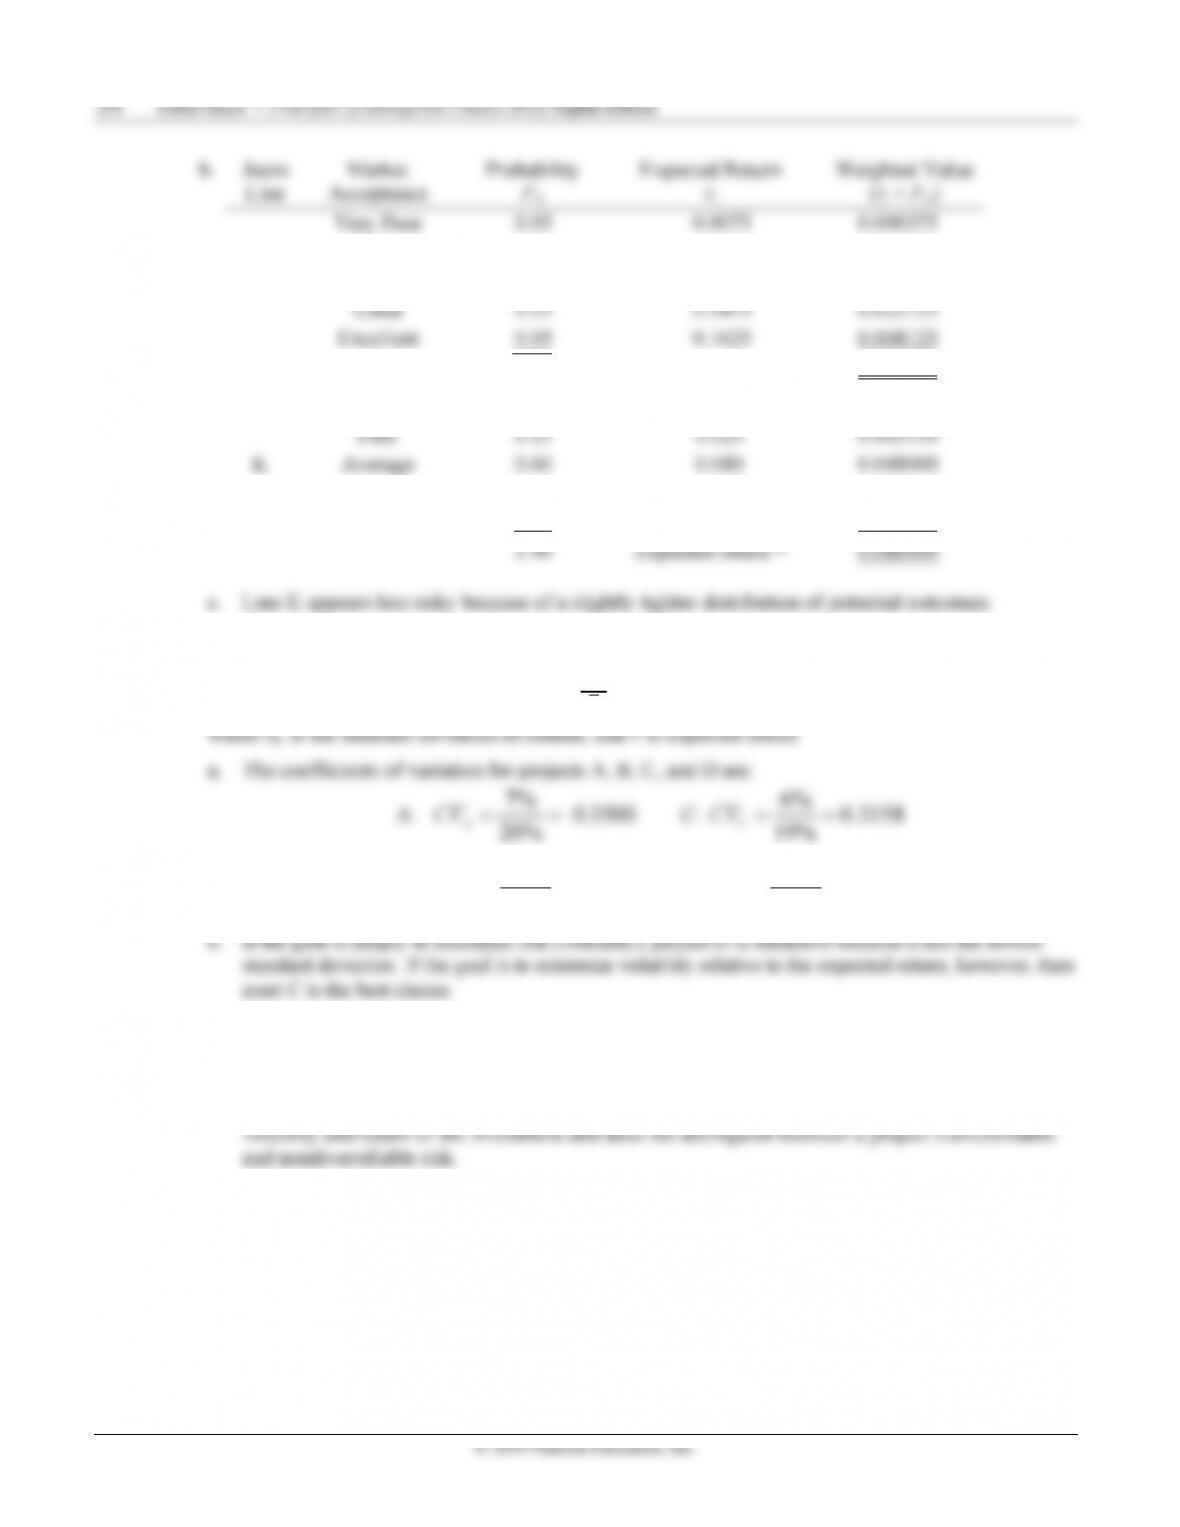
P8-7 Coefficient of variation (LG 2; Basic)
Coefficient of variation is given by : r
CV r
σ
=,
20%
A
19%
C
B: 9.5% 0.4318
22%
B
CV == D: 5.5% 0.3438
16%
D
CV ==
P8-8 Standard deviation versus coefficient of variation as measures of risk (LG 2; Basic)
a. Project A is least risky based on range because it has the smallest value (4%).
b. Project A has the lowest standard deviation. Standard deviation fails to take into account both the
© 2019 Pearson Education, Inc.
A: 0.029 0.2417
A
CV == C: 0.035 0.2692
C
CV ==
B: 0.032 0.2560
0.125
B
CV == D: 0.030 0.2344
0.128
D
CV ==
Project D may be the best alternative because it has the least amount of risk per percentage point
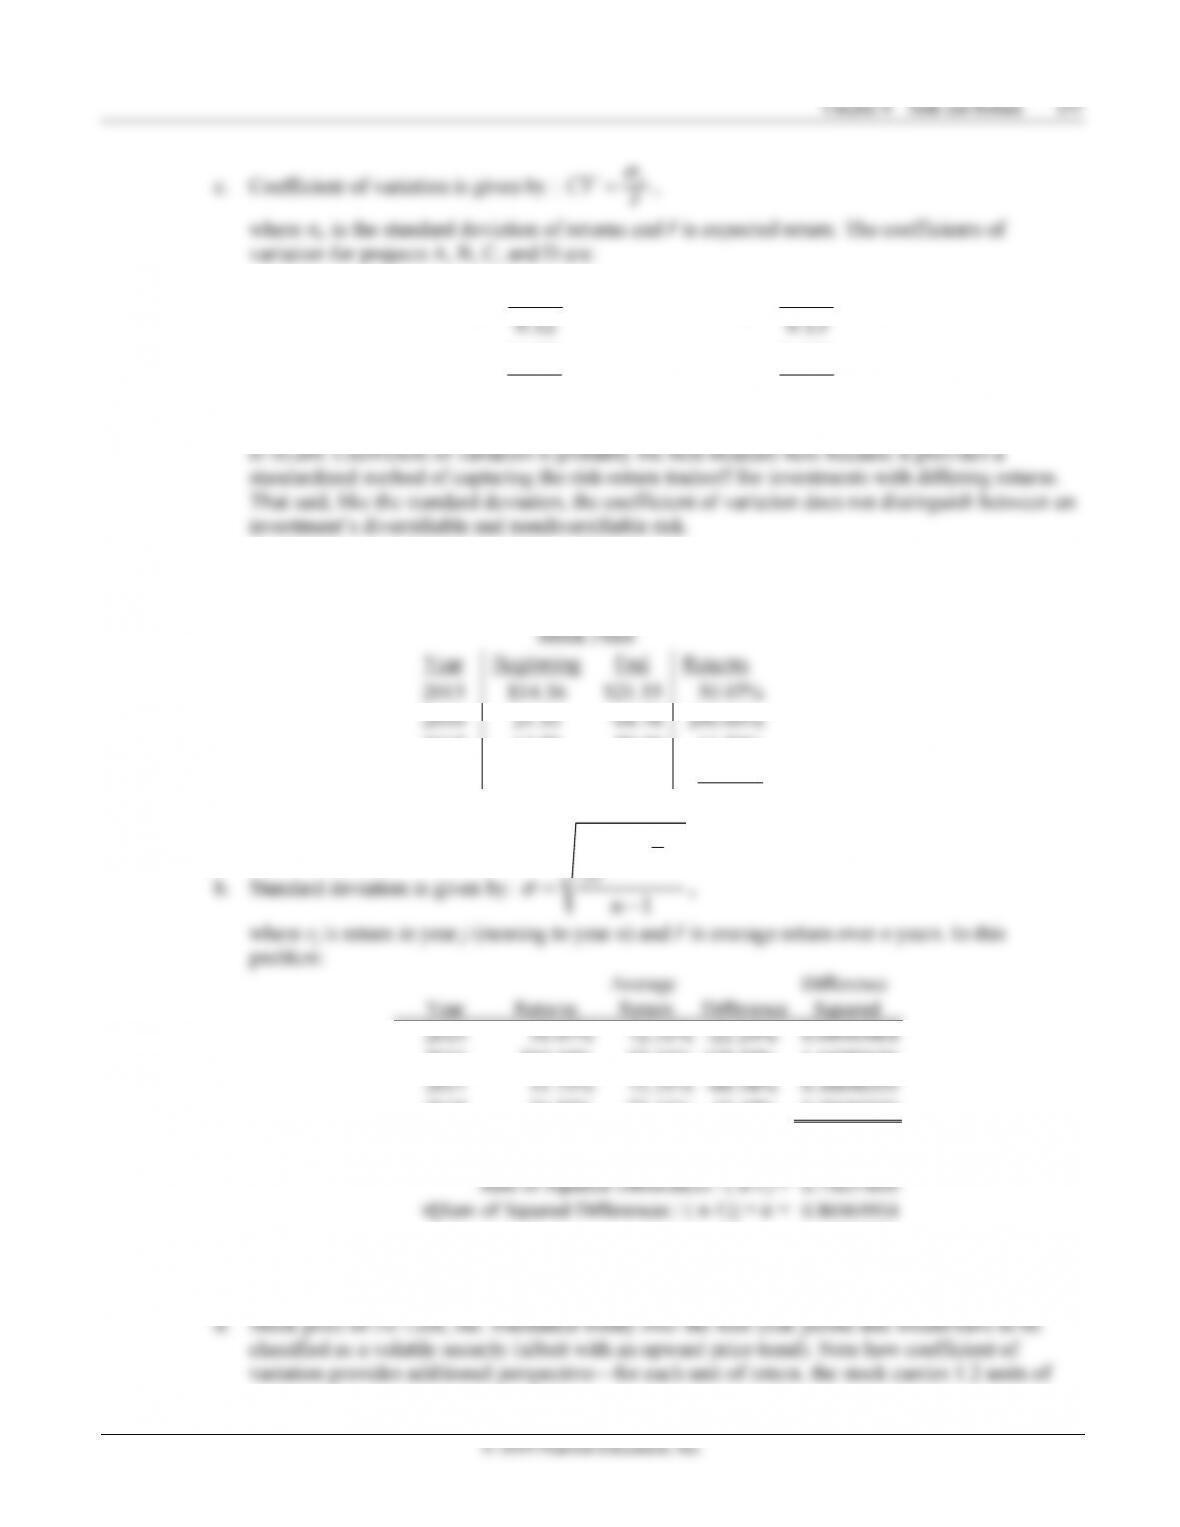
P8-9 Personal finance: Rate of return, standard deviation, coefficient of variation (LG 2; Challenge)
a.
2017
2018
64.78
72.38
72.38
91.80
11.73%
26.83%
Average return = 72.31%
()
2
n
j
rr
−
∑
2016 200.60% 72.31% 128.29% 1.64589656
2018 26.83% 72.31% –45.48% 0.20682030
2.26913085
n-1 = 3
86.97%
Sum of Squared Differences =
c. Coefficient of variation is given by CV = 𝜎 ÷ 𝑟̅ where 𝜎 is standard deviation of returns and 𝑟̅ is
expected return: 86.97% ÷ 72.31% = 1.2.

© 2019 Pearson Education, Inc.
(1) Range: 1.00 − (−0.10) = 1.10 percentage points
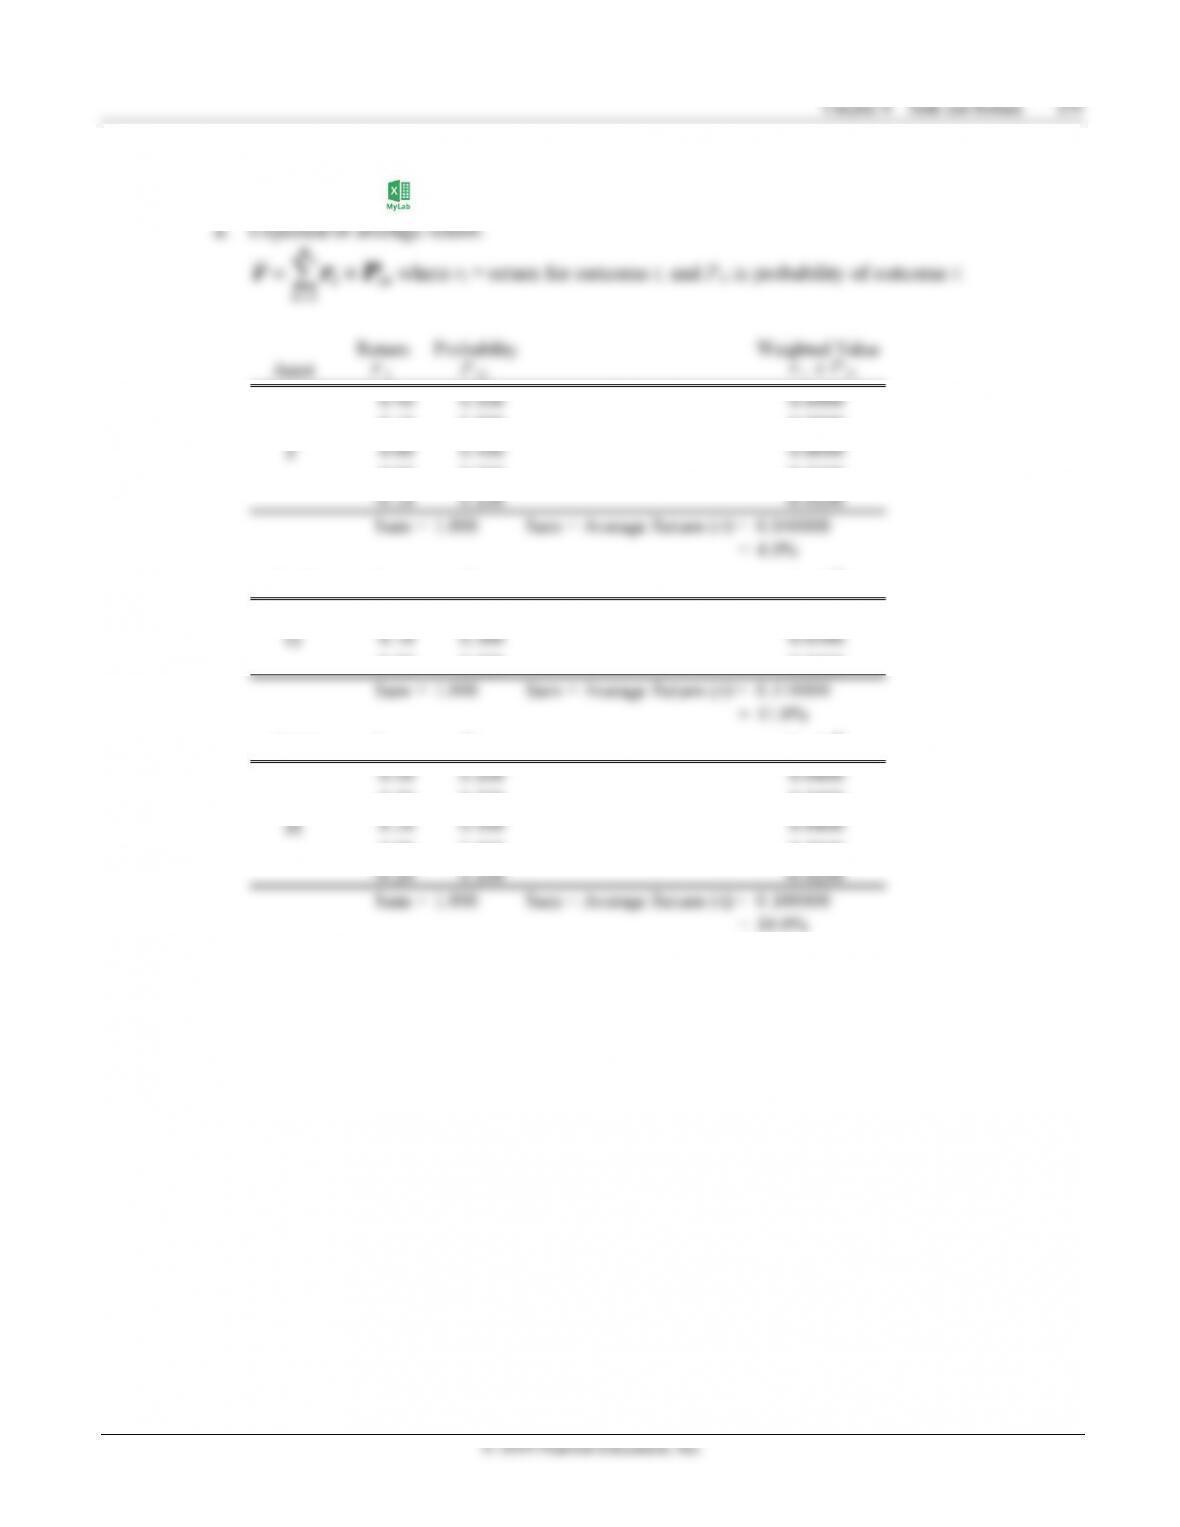
(2) Expected or average return:
n
r
rP
=×where ri = return for outcome i, and Pri is probability of outcome i:
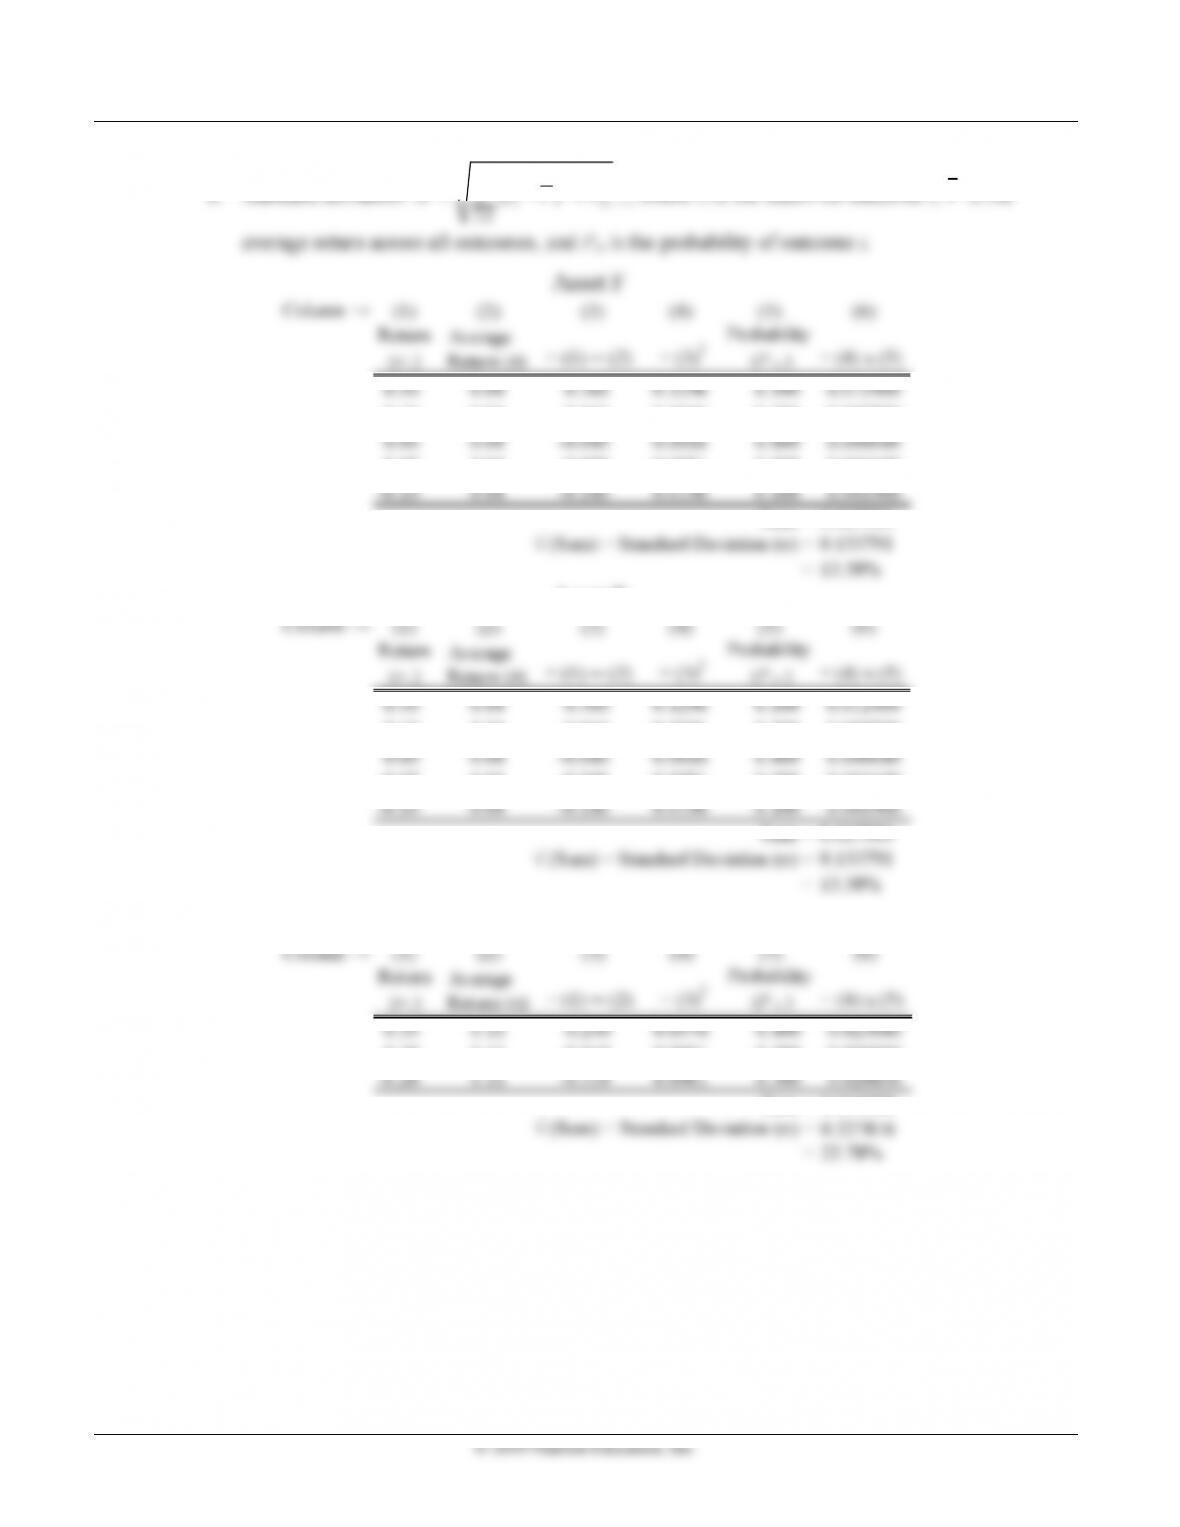
(3) Standard deviation: 2
1
()
n
iri
i
rr P
σ
=
=−×
∑, where:
ri is the return for outcome i, r is the average return across all outcomes, and Pri is the
probability of outcome i.
Return Probability Weighted Value
r
i
P
ri
r
i
x P
ri
0.10 0.040 0.004000
0.30 0.100 0.030000
0.45 0.300 0.135000
0.60 0.100 0.060000
0.80 0.040 0.032000
Sum = 1.000 Sum = Average Return (r) = 0.450000

© 2019 Pearson Education, Inc.
Range 1.100 0.400
Expected return ()r0.450 0.300
160 Zutter/Smart • Principles of Managerial Finance Brief, Eighth Edition
b. Standard deviation: 2
()
n
rr P
σ
=−×
0.10 0.04 0.060 0.0036 0.200 0.000720
-0.05 0.04 -0.090 0.0081 0.200 0.001620
Sum = 0.017900
= 13.38%
Asset F
0.10 0.04 0.060 0.0036 0.200 0.000720
-0.05 0.04 -0.090 0.0081 0.200 0.001620
= 13.38%
Asset G
0.10 0.11 -0.010 0.0001 0.300 0.000030
Sum = 0.051900
= 22.78%