42 Zutter/Smart • Principles of Managerial Finance Brief, Eighth Edition
P3-12. Personal finance: Liquidity ratio (LG 3; Basic)
a. Liquidity ratio = Total liquid assets / Total current debts
P3-13 Inventory management (LG 3; Intermediate)
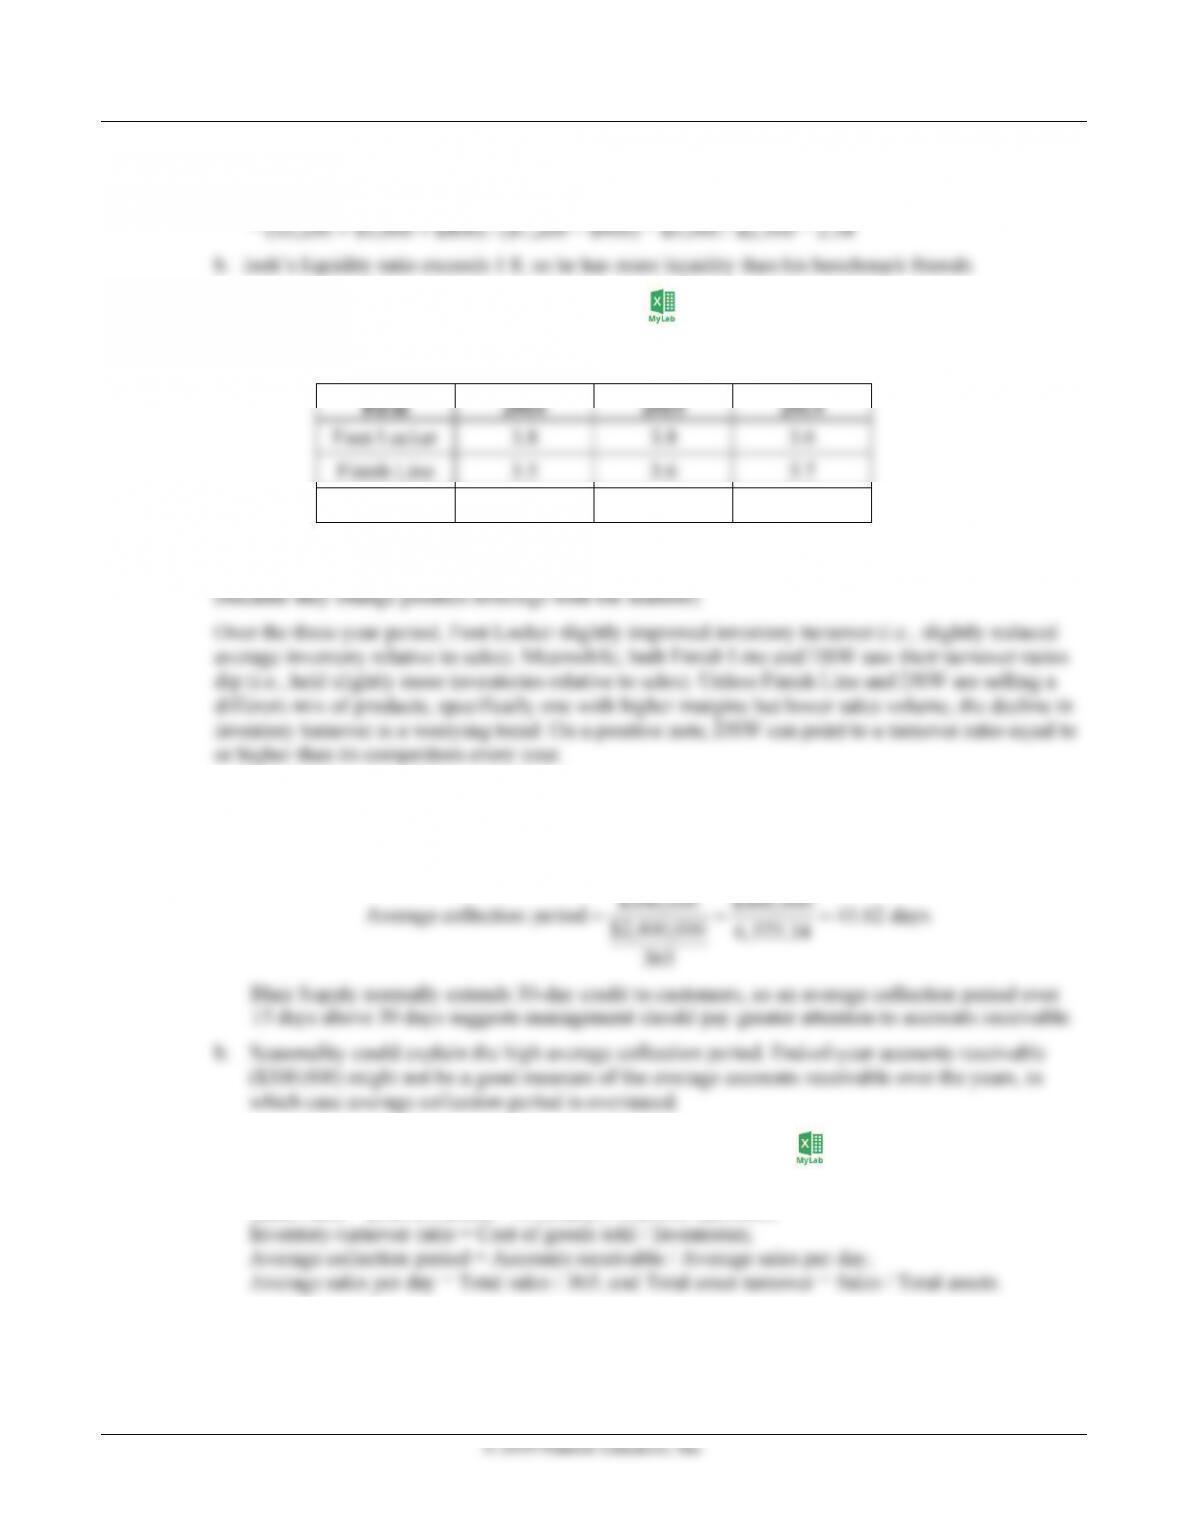
Inventory-turnover ratio = Cost of goods sold / Inventories. So:
DSW 3.8 3.9 4.1
The first thing to notice is the three companies have similar turnover ratios— that is, all three turn
inventory over a just under four times per year. This is typical for retailers specializing in clothing
P3-14. Accounts-receivable management (LG 3; Basic)
a. A good ratio for evaluating a firm’s collection system is average collection period
(= Accounts receivable ÷ Average sales per day).
P3-15. Interpreting liquidity and activity ratios (LG 3; Intermediate)
a. Current ratio = Current assets / Current liabilities;
Quick ratio = [Current assets – Inventory] / Current liabilities;
So,
Chapter 3 Financial Statements and Ratio Analysis 43
Firm
Current
Ratio
Quick
Ratio
Inventory
Turnover
Average
Collection
P
e
ri
od
Total
Asset
T
u
rn
ove
r
Proctor & Gamble 0.89 0.72 6.89 26.46 0.56
Colgate-Palmolive 1.31 0.96 5.19 33.89 1.25
Clorox 0.76 0.51 6.45 31.93 1.29
b. Colgate-Palmolive boasts the highest current and quick ratios, so they have the most liquidity.
Clorox’s relatively low liquidity ratios are surprising because it is considerably smaller than P&G
and Colgate. Usually smaller companies have greater liquidity on their balance sheets because of
(i) difficulty obtaining external finance in times of crisis and (ii) less predictable revenues than
larger companies. The explanation might be that Clorox sells fewer products than P&G and
Colgate, and consumer demand for those products are relatively stable over the business cycle.
c. All three firms collect on sales in about 30 days, with the differences in average collection periods
between the shortest (P&G) and longest (Colgate) collection periods only seven days. The most
likely explanation is that companies compete with each other, selling similar products to most of
the same customers, so probably offer similar credit terms.
d. Procter & Gamble turned inventory over a bit faster than the other firms but assets much slower.
This is surprising because both ratios measure asset efficiency—how could P&G excel at
managing inventories (receivables, too, given its average collection period) but not overall assets?
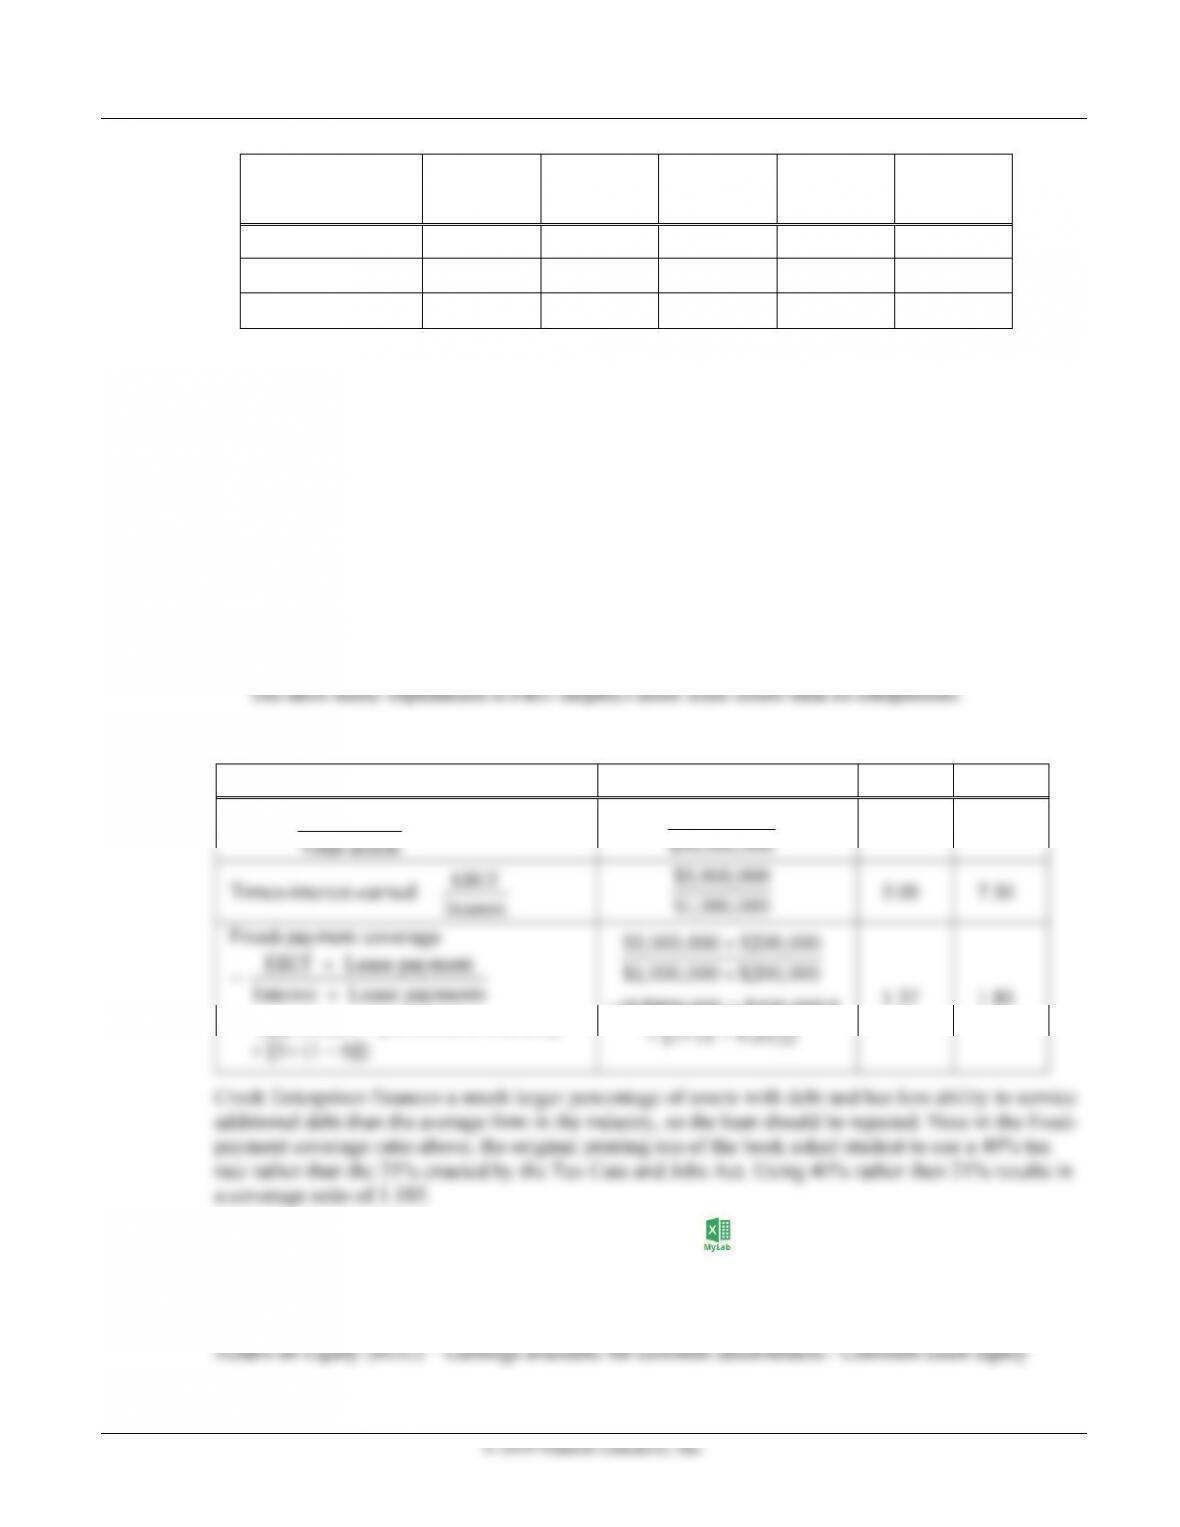
P3-16 Debt analysis (LG 4; Basic)
Ratio Calculation Creek Industry
Debt = Debt
+ {[(principal + preferred dividends)]
+{[($800,000 + $100,000)]
P3-17 Profitability analysis (LG 4 and LG 5; Intermediate)
Gross profit margin = [Sales – Cost of goods sold] / Sales;
Net profit margin = Earnings available for common stockholders / Sales;
Return on Assets (ROA) = Earnings available for common stockholders / Total assets;
So,
© 2019 Pearson Education, Inc.
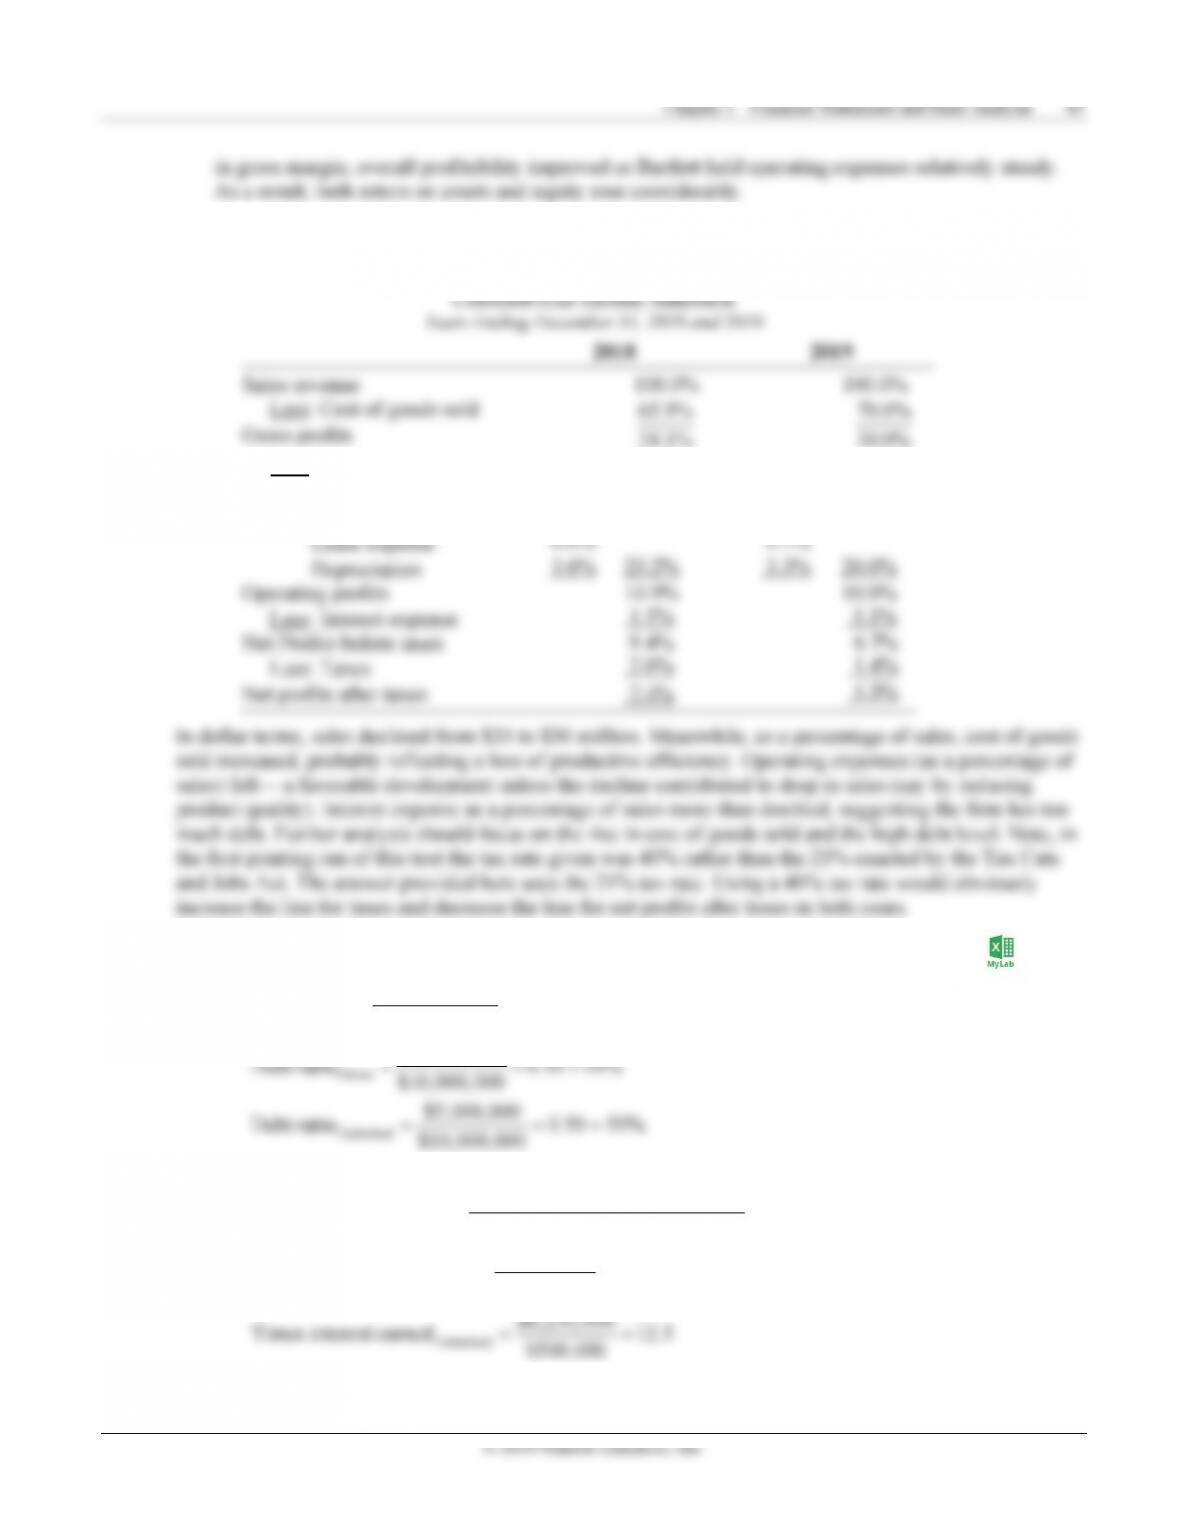
P3-19. Common-size statement analysis (LG 5)
Creek Enterprises
Less: Operating expenses:
Selling 12.7% 10.0%
General 6.3% 6.0%
P3-20. The relationship between financial leverage and profitability (LG 4 and LG 5; Challenge)
a. (1) total liabilities
Debt ratio total assets
=
$1,000,000
$10,000,000
(2) earning before interest and taxes
Times interest earned interest
=
Pelican
$6,250,000
Times interest earned 62.5
$100,000
==
© 2019 Pearson Education, Inc.
Timberland
$25,000,000
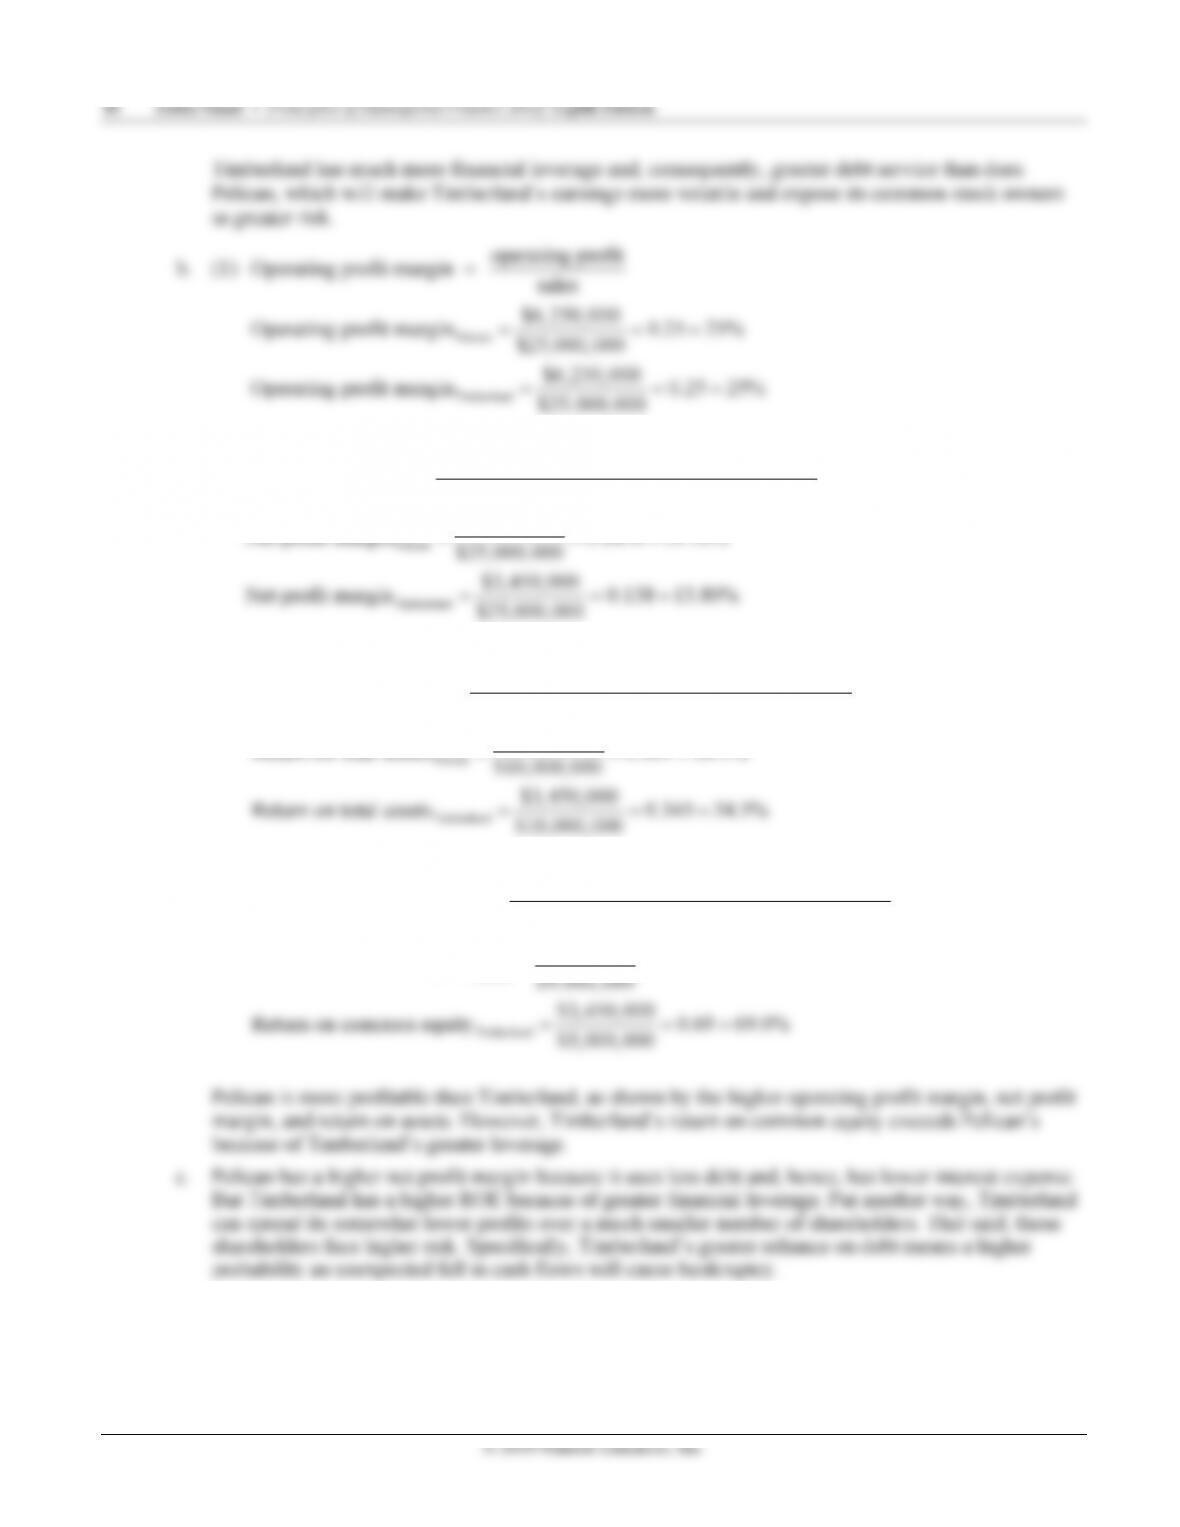
(2) Earnings available for common stockholders
Net profit margin sales
=
Pelican
$3,690,000
Net profit margin 0.1476 14.76%
===
(3) Earnings available for common stockholders
Return on total assets total assets
=
Pelican
$3,690,000
Return on total assets 0.369 36.9%
===
(4) Earnings available for common stockholders
Return on common equity Common stock equity
=
Pelican
$3,690,000
Return on common equity 0.41 41.0%
===
P3-21. Analysis of Debt Ratios (LG 4; Intermediate)
a. Debt Ratio = Total Liabilities / Total Assets. For Estée Lauder, the debt ratio is
$5,636,000 / $9,223,300 = 0.61, and for e.l.f. Beauty, the ratio is $273,867 / $414,729 = 0.66.
Chapter 3 Financial Statements and Ratio Analysis 47
Times Interest Earned Ratio = Earnings before Interest and Taxes / Interest. For Estée Lauder, the
P3-22. Ratio proficiency (LG 6; Basic)
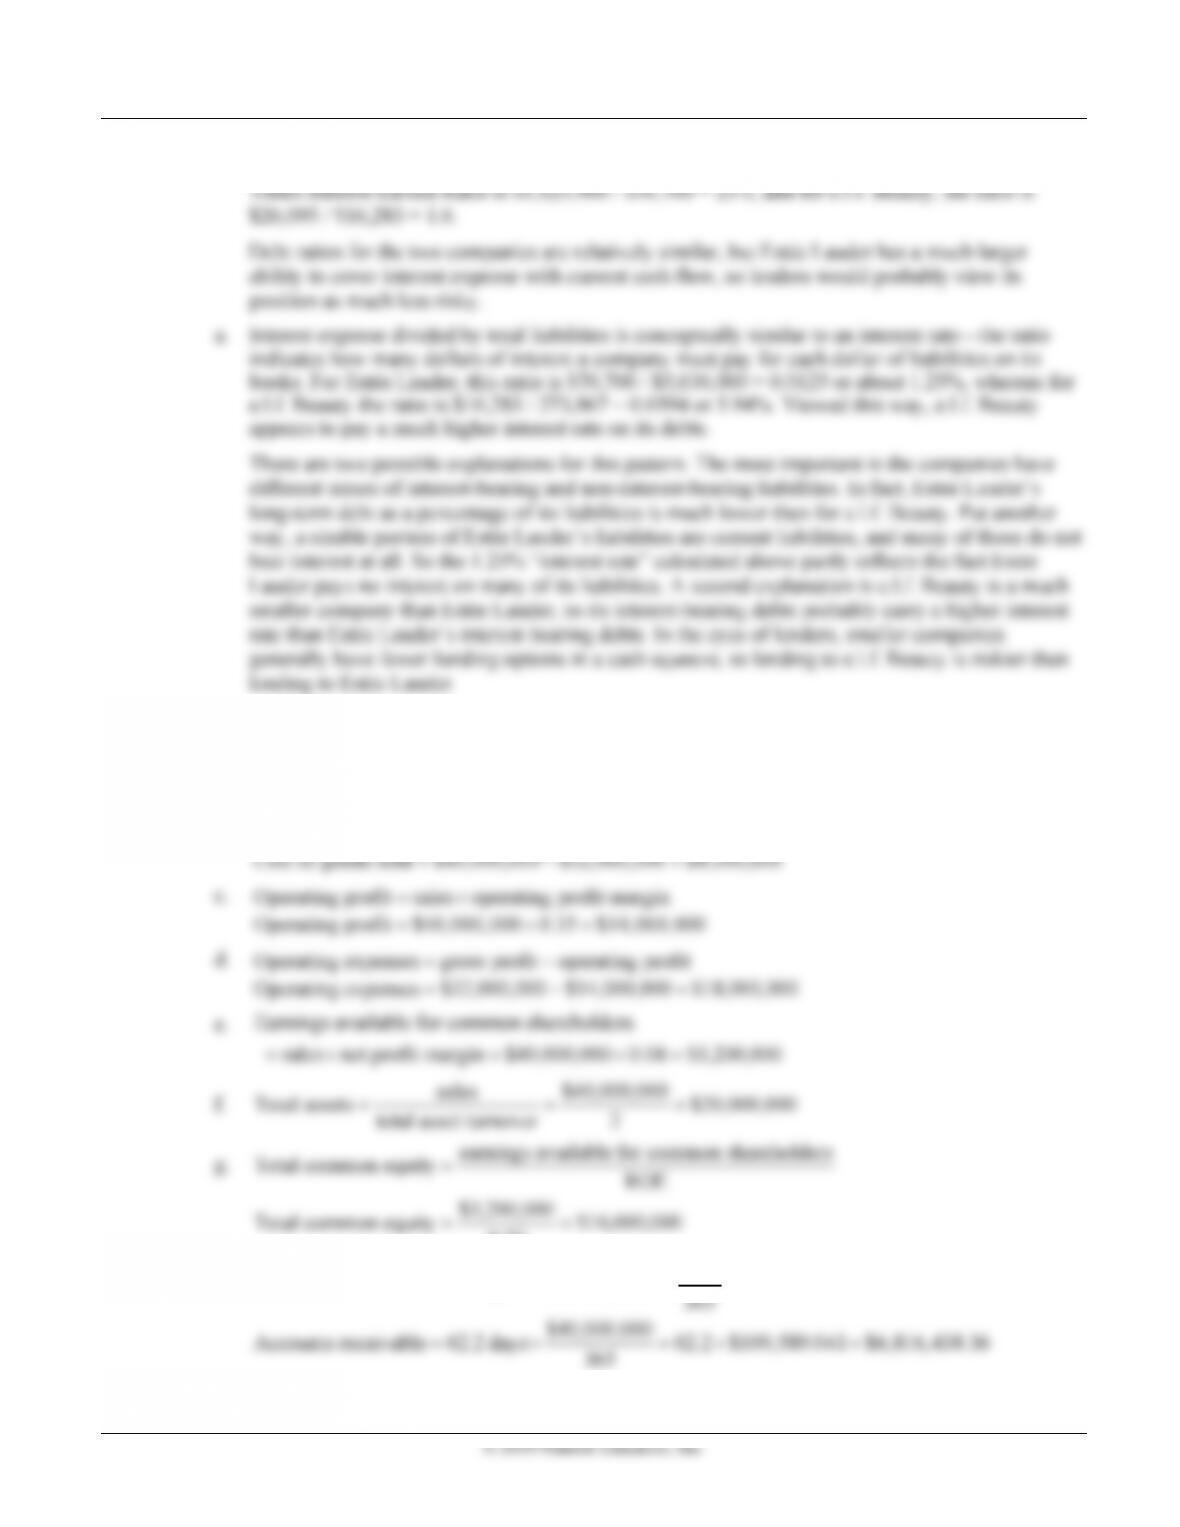
a. Gross profit sales gross profit margin
Gross profit $40,000,000 0.8 $32,000,000
=×
=×=
b. Cost of goods sold sales gross profit
=−
0.20
h. sales
Accounts receivable average collection period
=×
Chapter 3 Financial Statements and Ratio Analysis 51
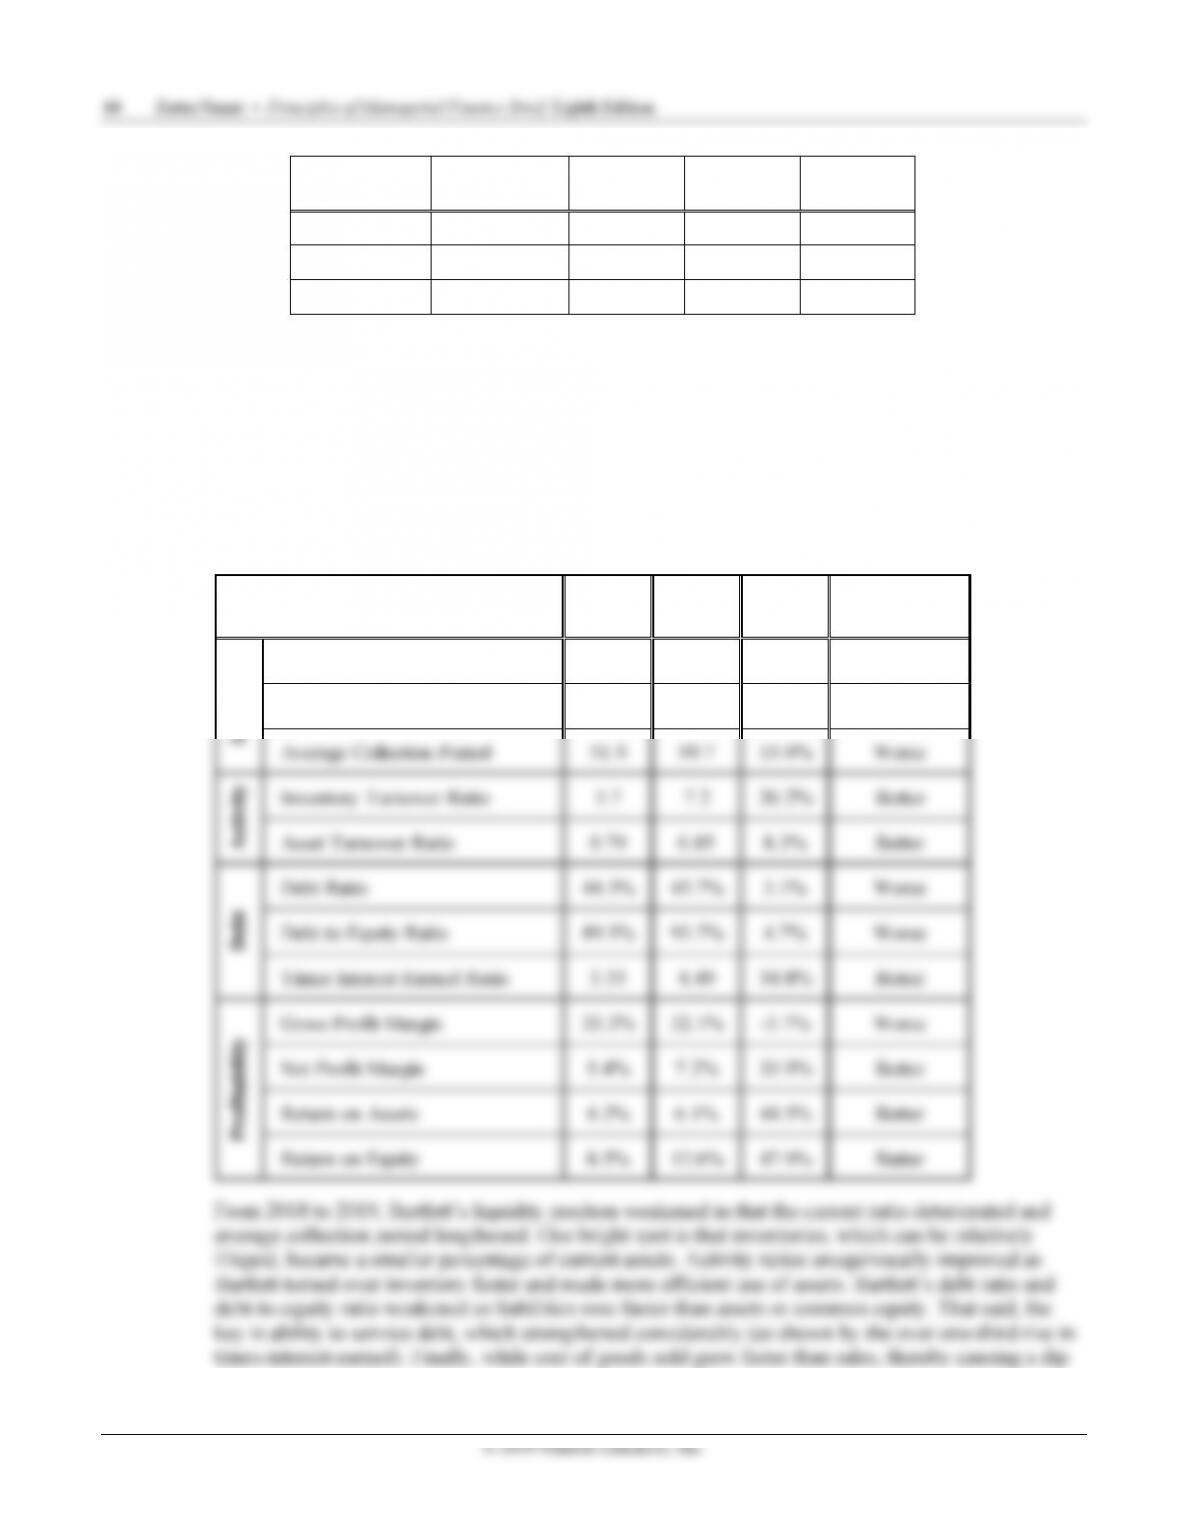
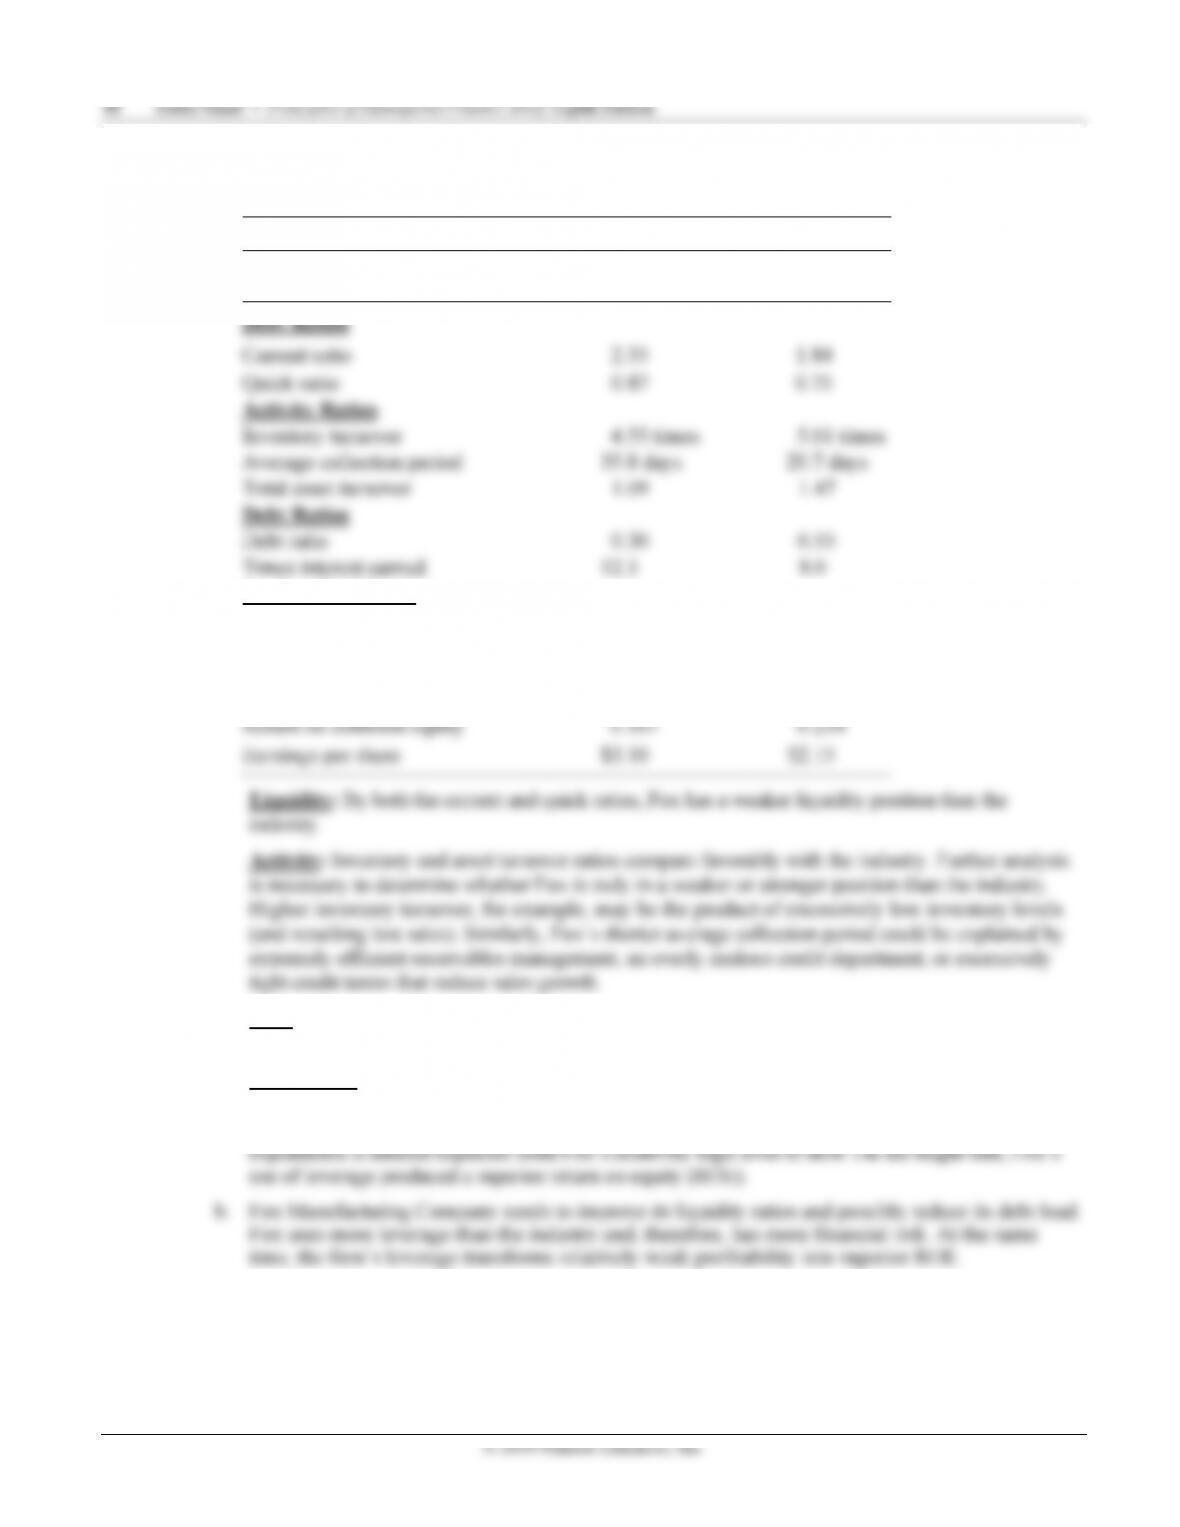
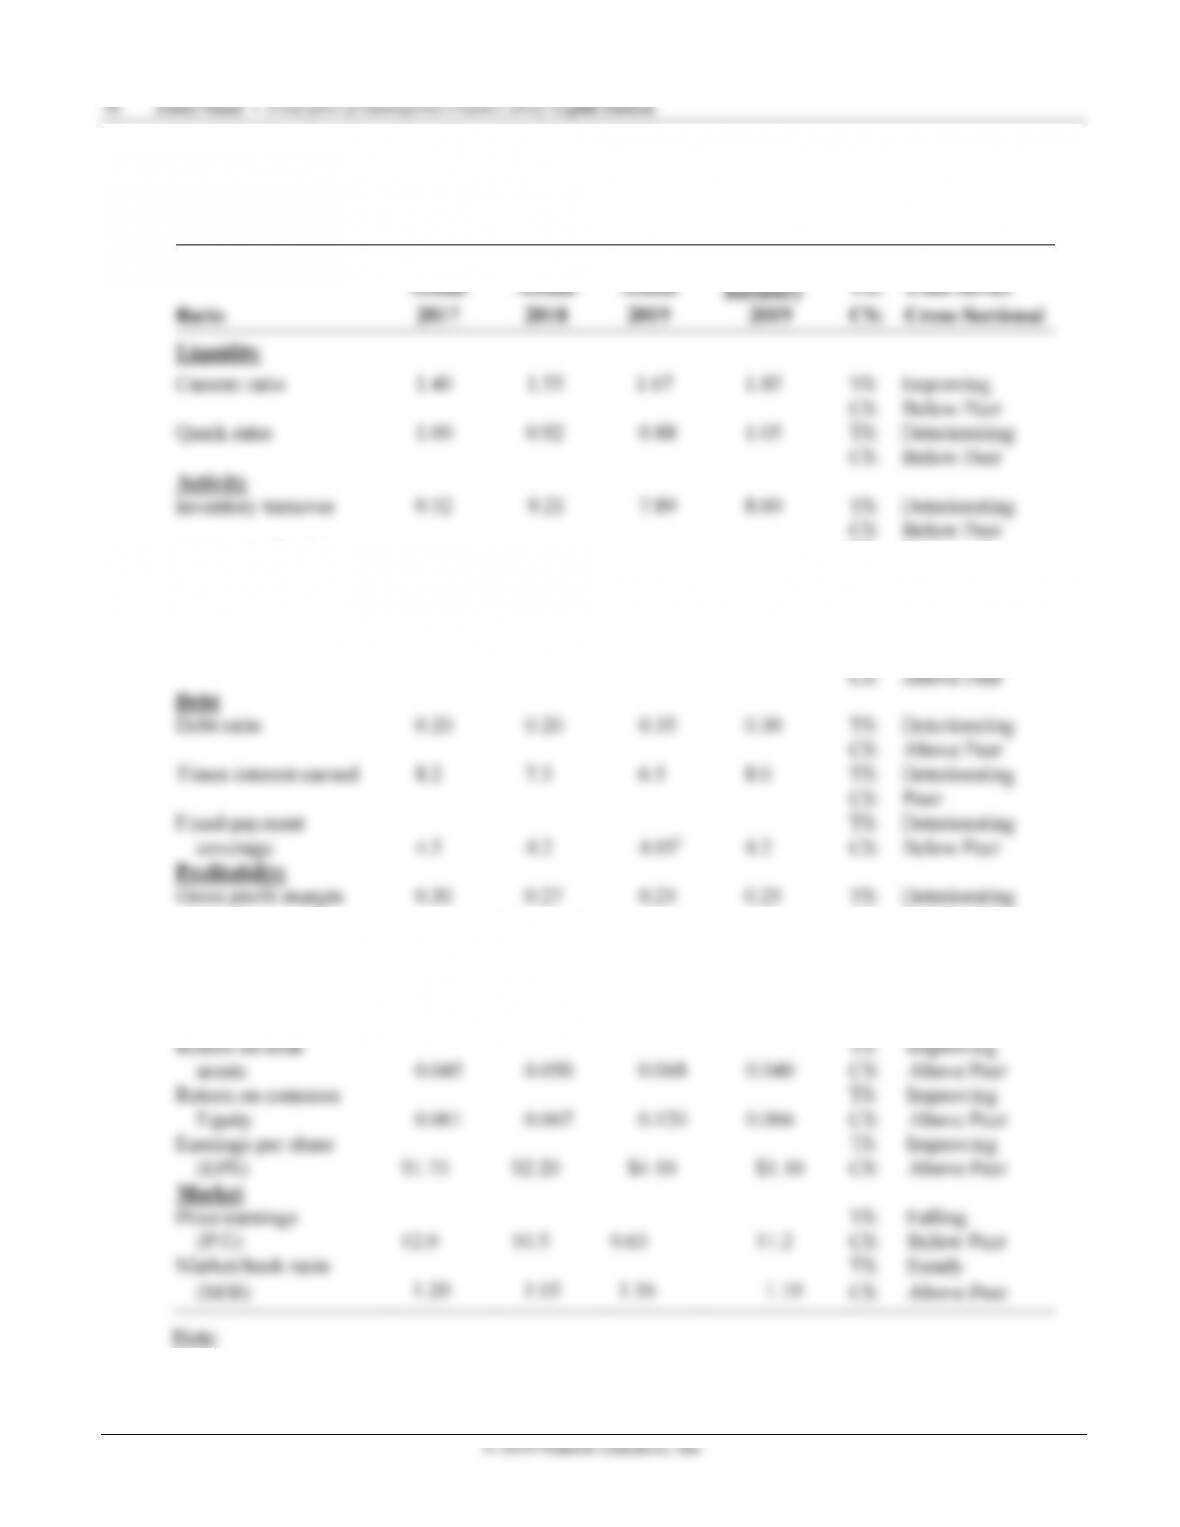
Liquidity: Sterling’s overall liquidity position is weak compared with peer firms. The significant
(and growing) difference in the current and quick ratios suggests the firm is holding a significant
level of relatively illiquid inventory.
P3-26. DuPont system of analysis (LG 6; Intermediate)
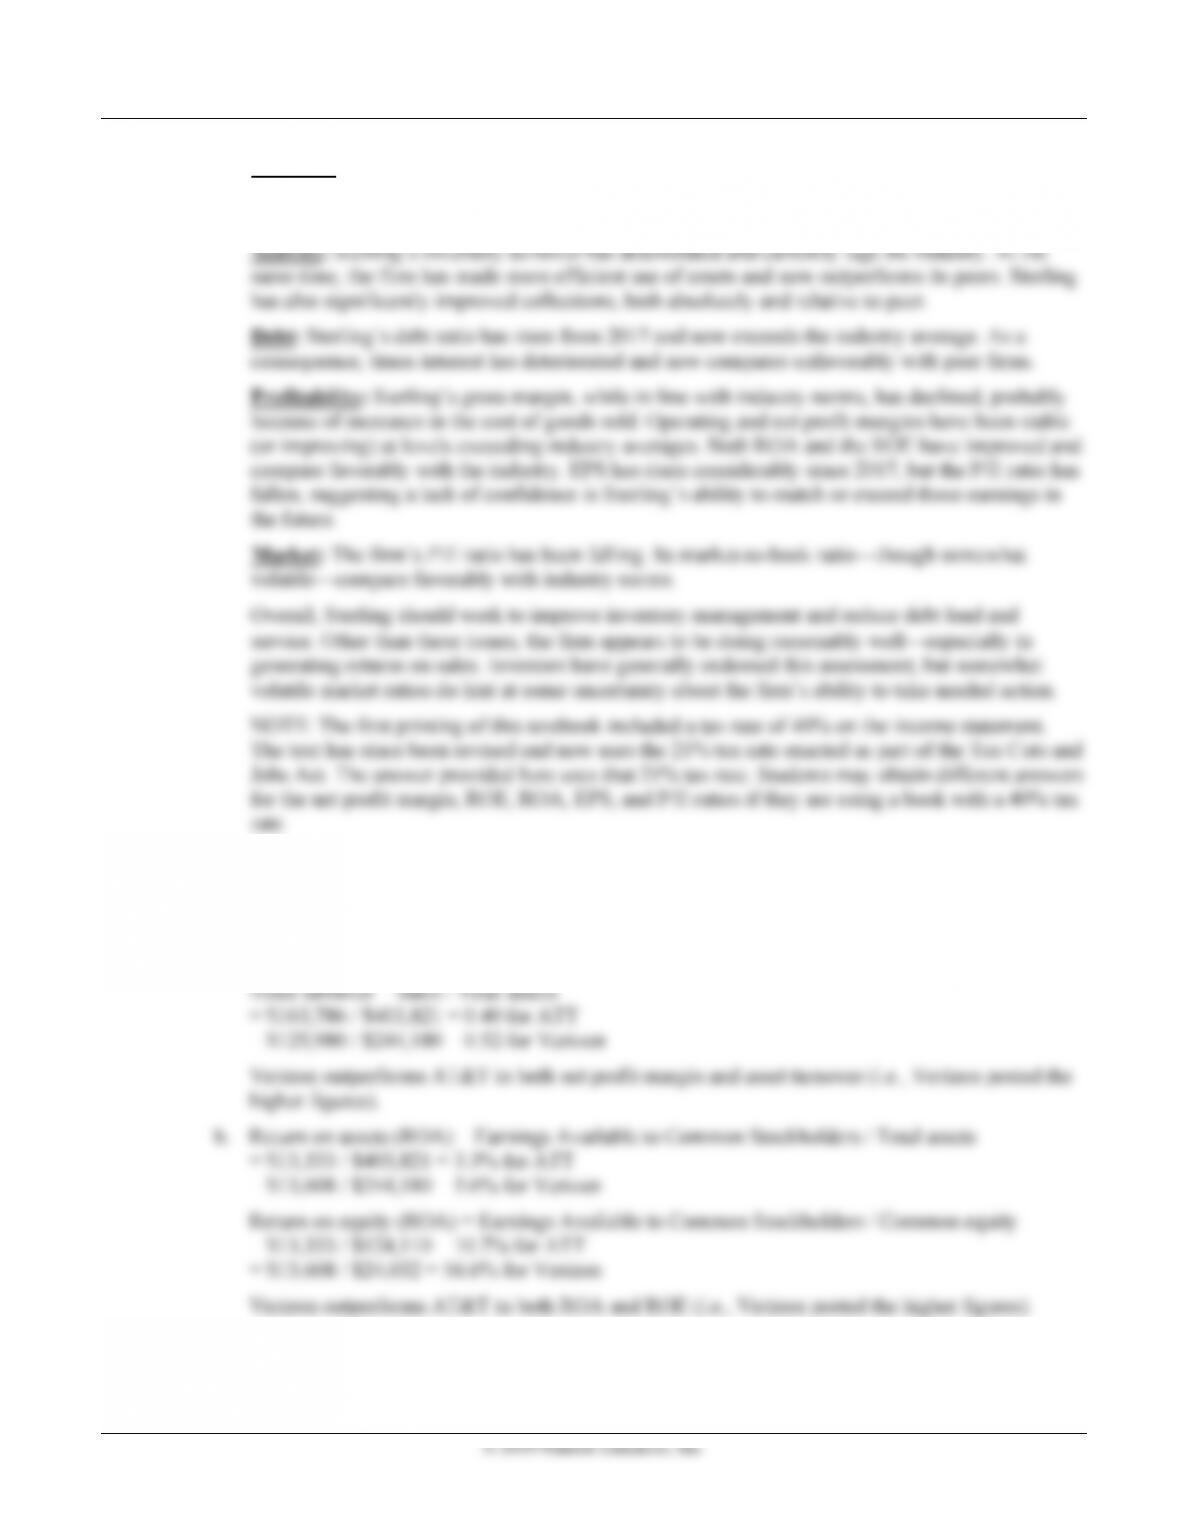
a. Net profit margin = Earnings Available to Common Stockholders / Sales
= $13,333 / $163,786 = 8.1% for ATT
= $13,608 / $125,980 = 10.8% for Verizon
Chapter 3 Financial Statements and Ratio Analysis 53
Case
Assessing Martin Manufacturing’s Current Financial Position
Martin Manufacturing Company is an integrative case study employing financial-analysis techniques. The
company is a capital-intensive firm that manages accounts receivable and inventory poorly. The industry
average inventory turnover can fluctuate from 10 to 100 depending on the market.
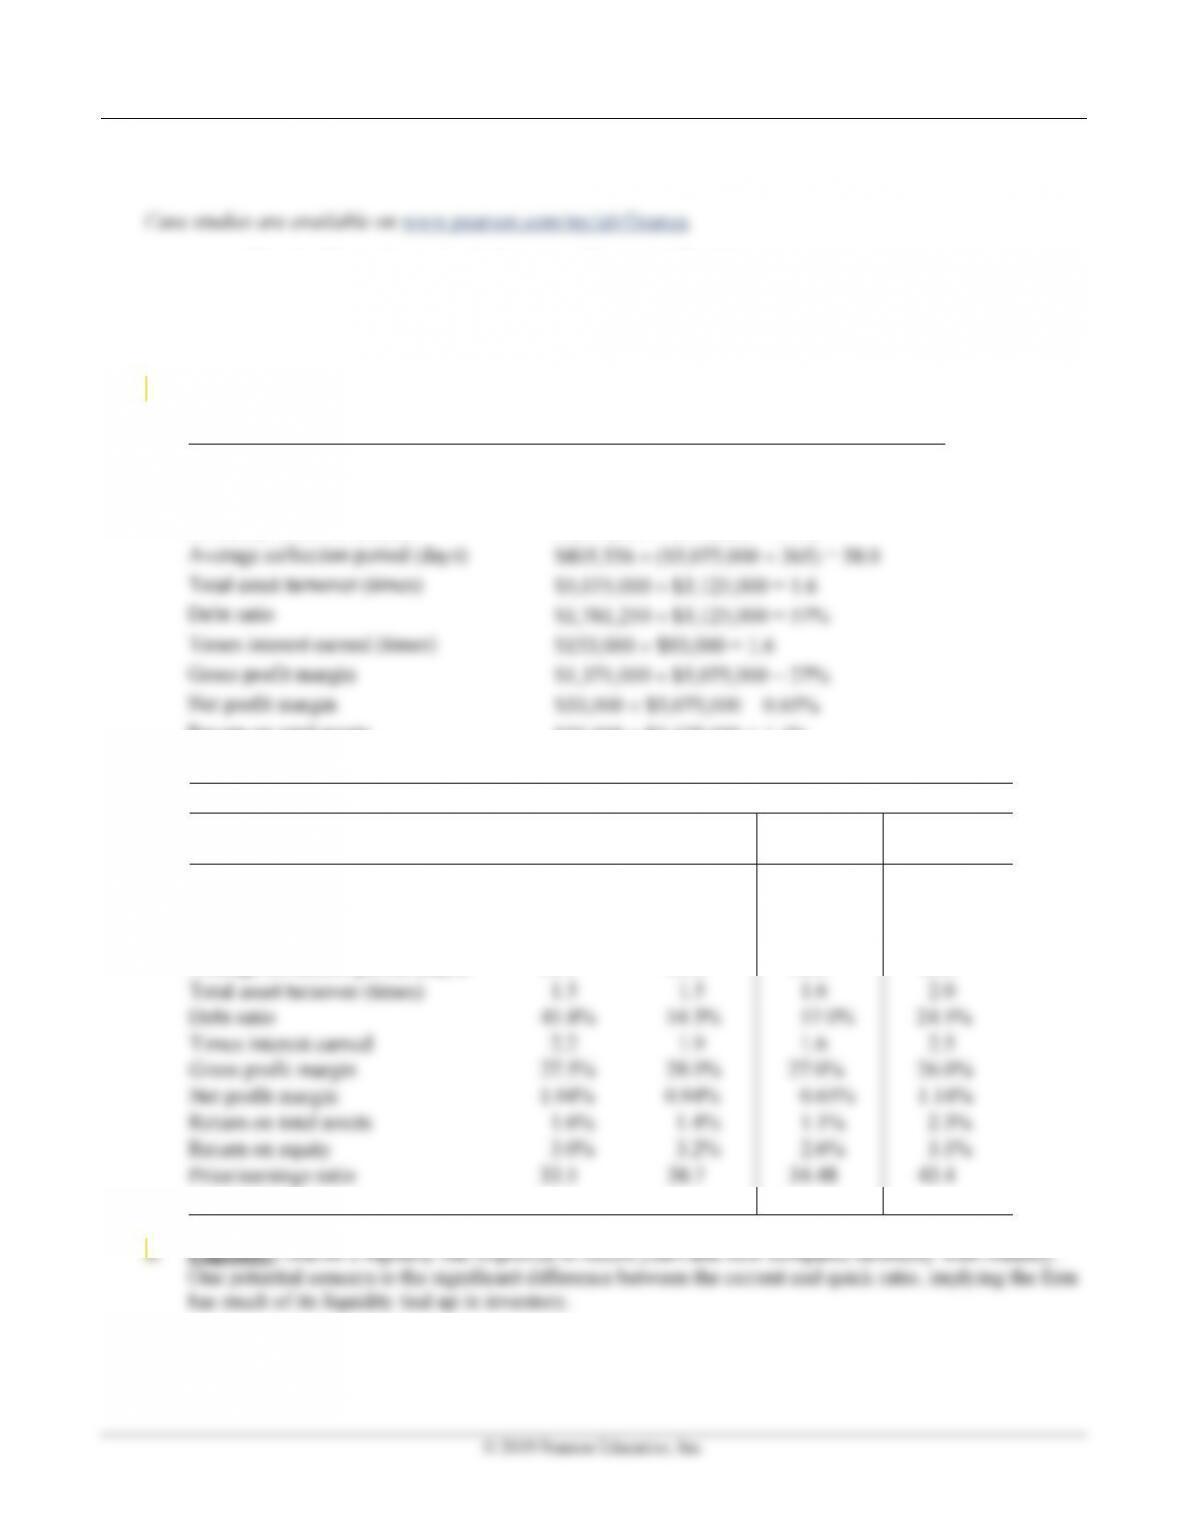
a. Ratio calculations
Financial Ratio 2019
Current ratio $1,531,181 ÷ $616,000 = 2.5%
Quick ratio ($1,531,181 – $700,625) ÷ $616,000 = 1.3%
Inventory turnover (times) $3,704,000 ÷ $700,625 = 5.3%
Return on total assets $33,000 ÷ $3,125,000 = 1.1%
Return on equity $33,000 ÷ $1,293,000 = 2.6%
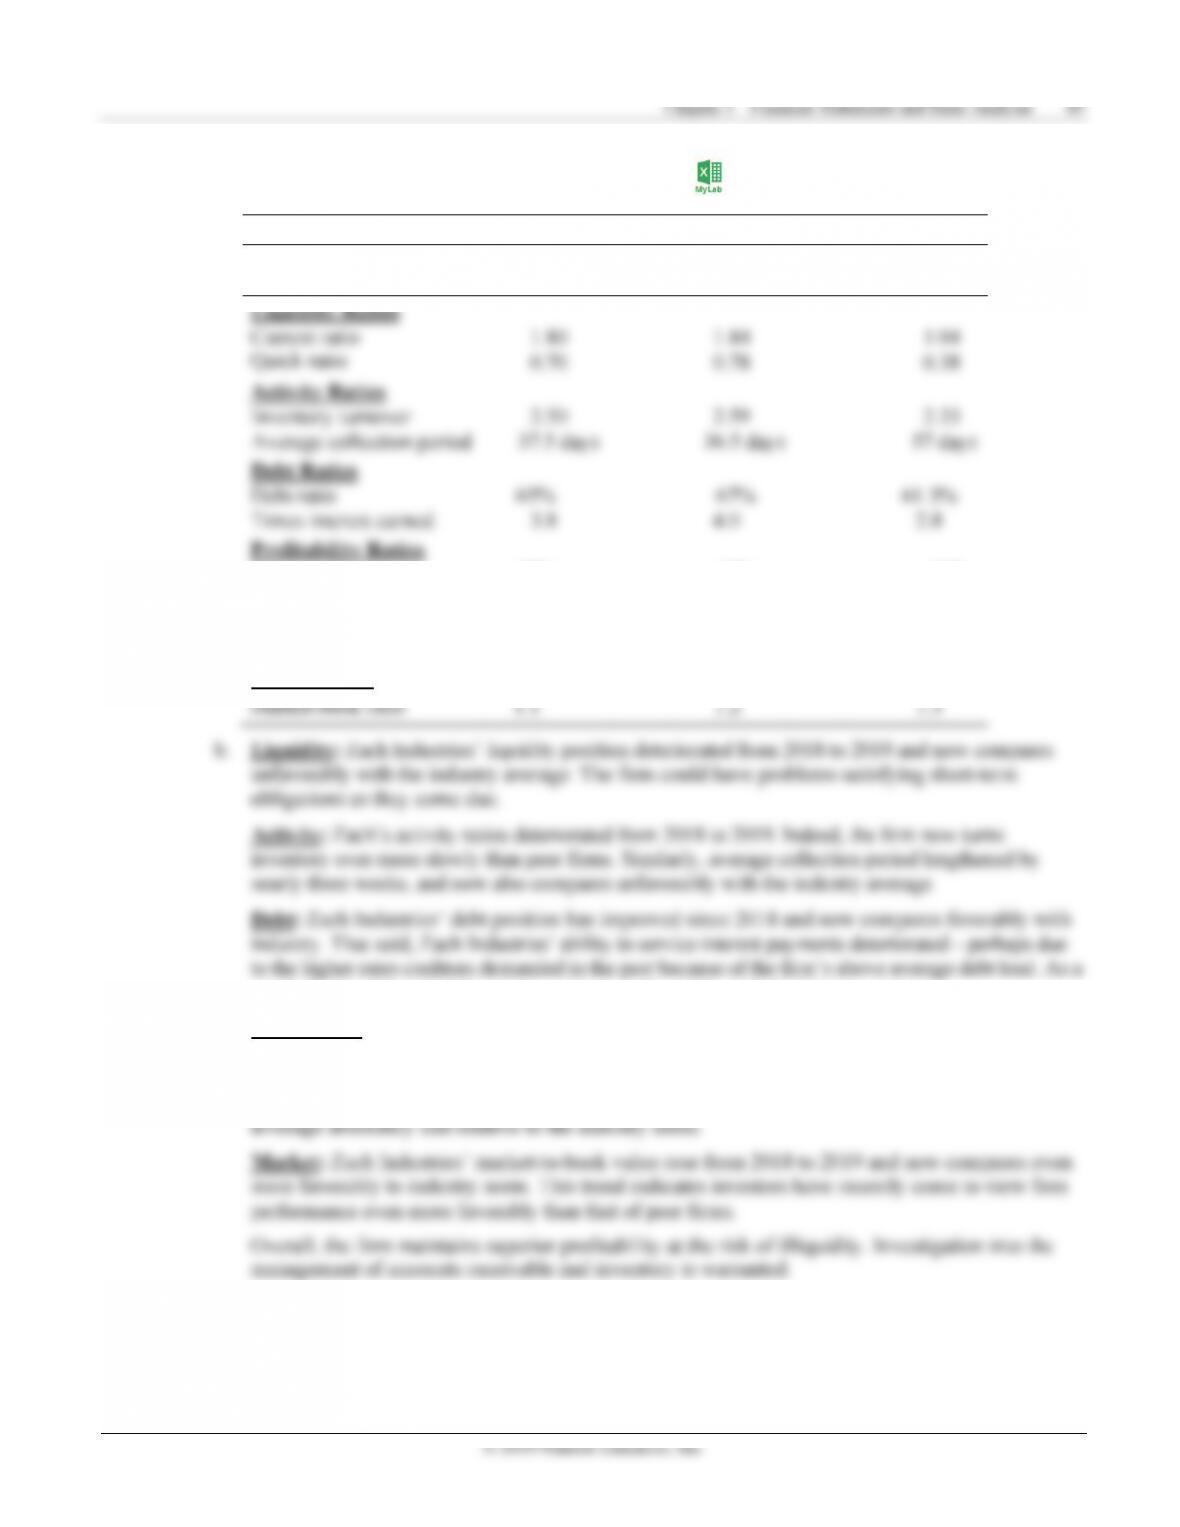
Historical Ratios—Martin Manufacturing Company
Ratio
Actual
2017
Actual
2018
Actual
2019
Industry
Average
Current ratio 1.7 1.8 2.5 1.5
Quick ratio 1.0 0.9 1.3 1.2
Inventory turnover (times) 5.2 5.0 5.3 10.2
Average collection period (days) 50.7 55.8 58.0 46.0
Market/book 1.0 1.1 0.88 1.2
© 2019 Pearson Education, Inc.