
Part 2
Financial Tools
Chapters in This Part
Chapter 3 Financial Statements and Ratio Analysis
Chapter 4 Cash Flow and Financial Planning
Chapter 5 Time Value of Money
Chapter 3
Financial Statements and Ratio Analysis
Instructor’s Resources
Chapter Overview
This chapter examines the four key components of the stockholders’ report: the income statement, the balance
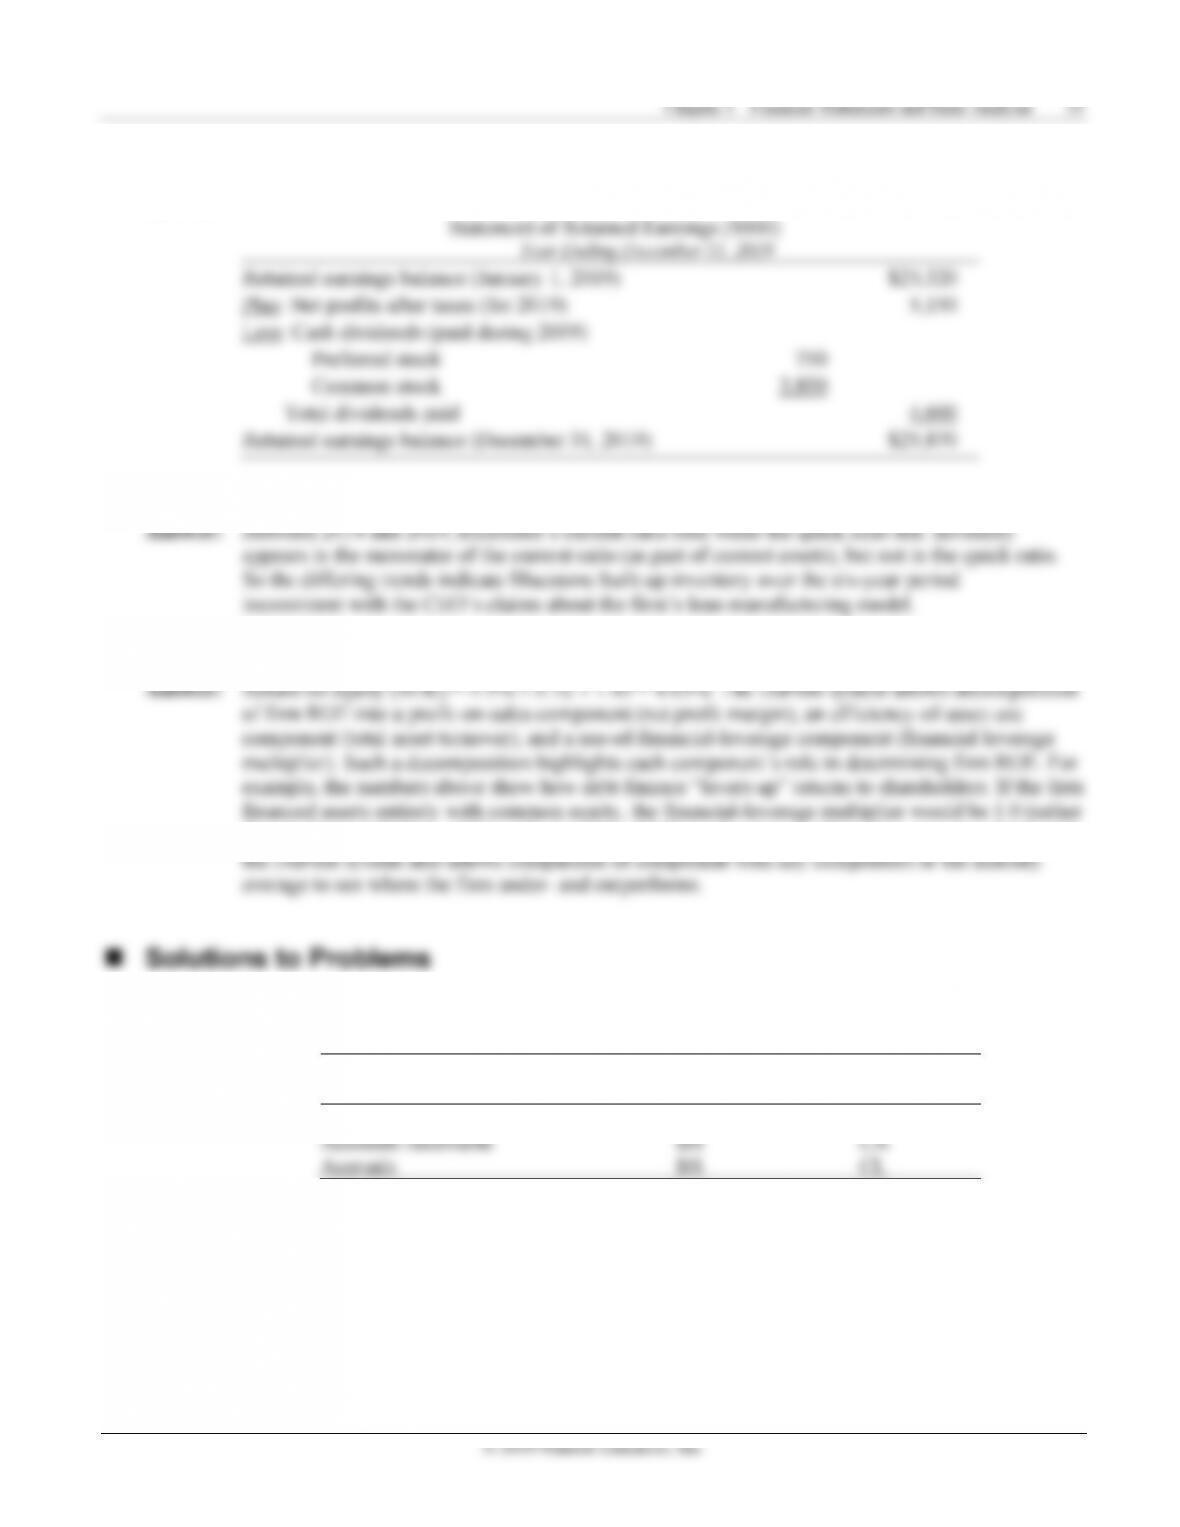
sheet, the statement of retained earnings, and the statement of cash flows. All major items on the income
statement and balance sheet are reviewed along with rules for consolidating foreign and domestic financial
statements (FASB No. 52). Next, the discussion turns to use of income-statement/balance-sheet figures to
assess a firm’s financial condition. Three types of comparative analysis are noted—cross-sectional, time-
series, and combined—and specific ratios for such analysis are presented for five perspectives on firm
condition—liquidity, activity, debt, profitability, and market. Each ratio is illustrated using the last public
financial statements of Whole Foods Market, Inc., just before it was acquired by Amazon. The meaning of
deviations of performance ratios from industry benchmarks (as well as differences across industries) is also
explored. The chapter ends with a complete (cross-sectional and time-series) ratio analysis of Whole Foods.
The DuPont system is integrated into the example to show how profit margin, sales volume, and leverage
interact to determine return on equity.
Answers to Review Questions
3-1. Generally accepted accounting principles (GAAP), the Financial Accounting Standards Board (FASB),
and the Public Company Accounting Oversight Board (PCAOB) all play significant roles in the
financial reporting of publicly traded firms. GAAP refers to the basic guidelines firms should use in
3-2 The four major financial statements are the:
• Income Statement, which summarizes firm operating results over a specified time period. It is a
“flow” document— demonstrating whether revenues over a month, quarter, or year exceed costs
with sufficient detail to explain profits or losses.
© 2019 Pearson Education, Inc.
3-3 Notes to the Financial Statements offer important background details for firm financial statements.
3-4 FASB Statement No. 52 governs rules for consolidating a firm’s foreign and domestic financial
statements. The statement requires U.S.-based companies to translate foreign-currency-denominated
3-5 Current and prospective shareholders care about ratios bearing on expected cash flows and uncertainty
about those flows because risk and return drive stock price. Creditors, on the other hand, focus on ratios
3-6 Cross-sectional analysis involves comparing performance ratios for different firms at a specific point in
3-7 An analyst should focus on significant differences between firm ratios and those of a designated peer
(competitor, group of competitors, or industry average), irrespective of whether the ratio is above or
3-8 Analyzing financial data from different points in the year could lead to inaccurate conclusions because
3-9 The current ratio is a better metric when current assets are all reasonably liquid while the quick ratio is

© 2019 Pearson Education, Inc.
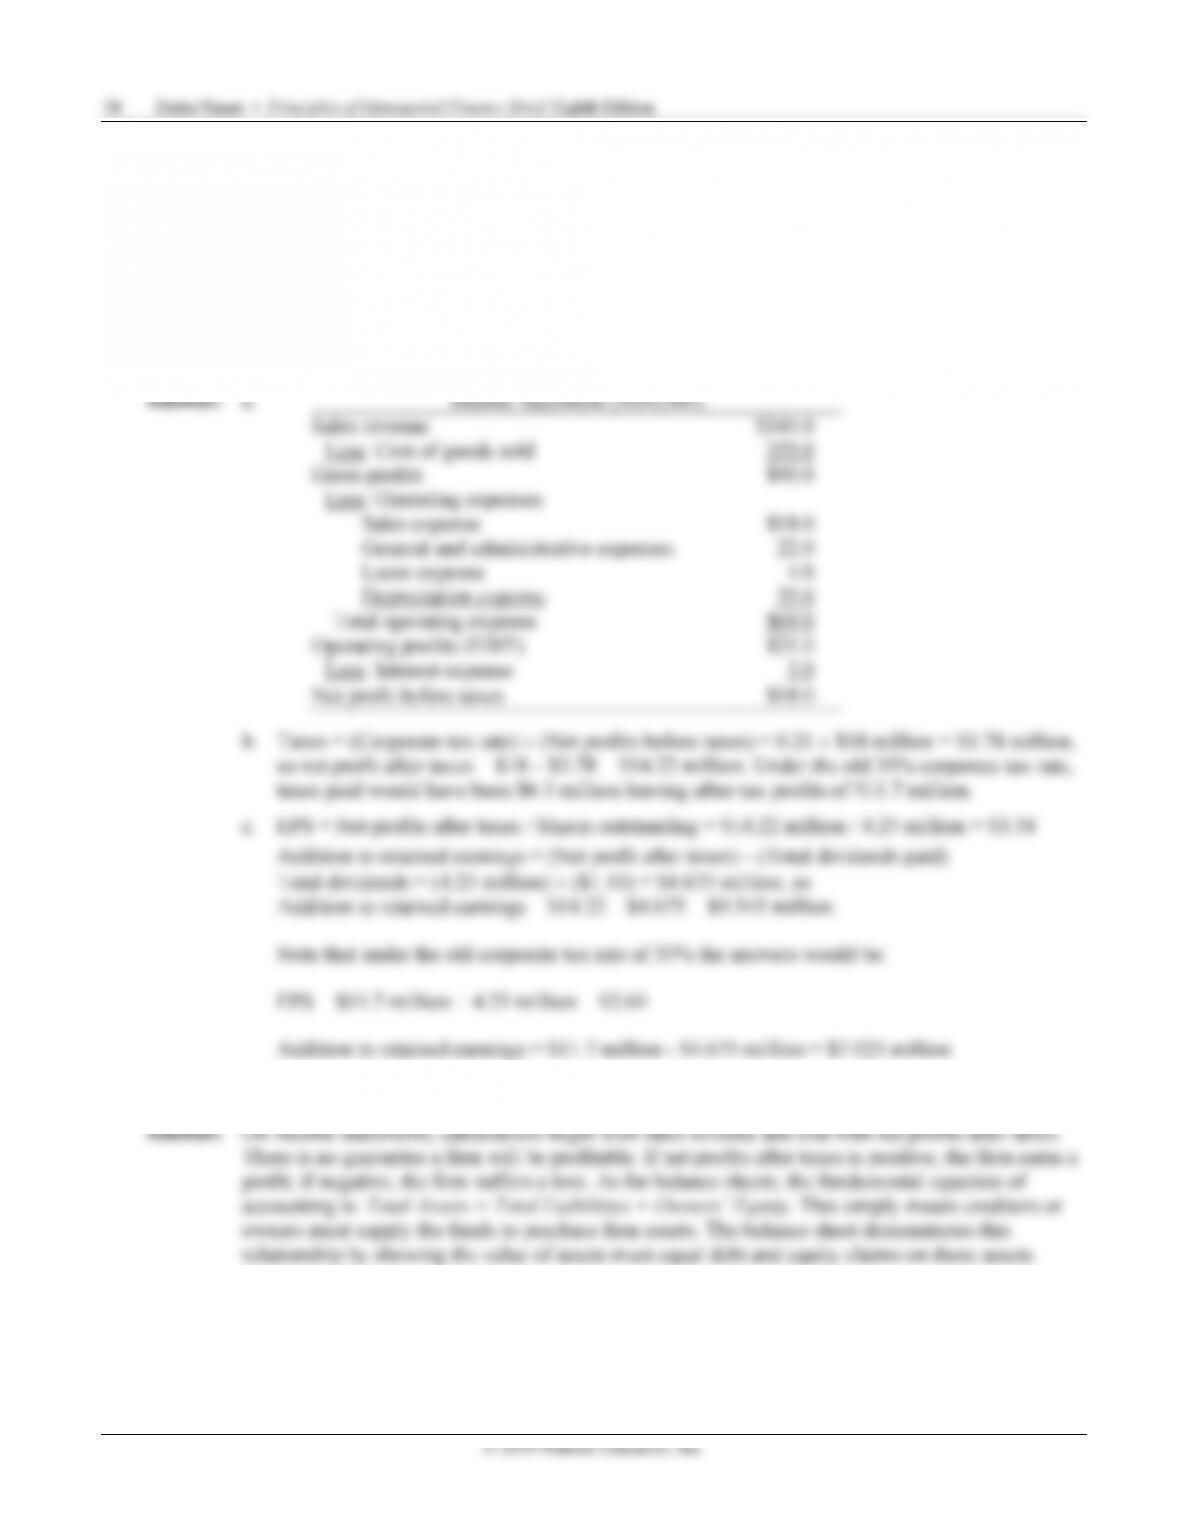
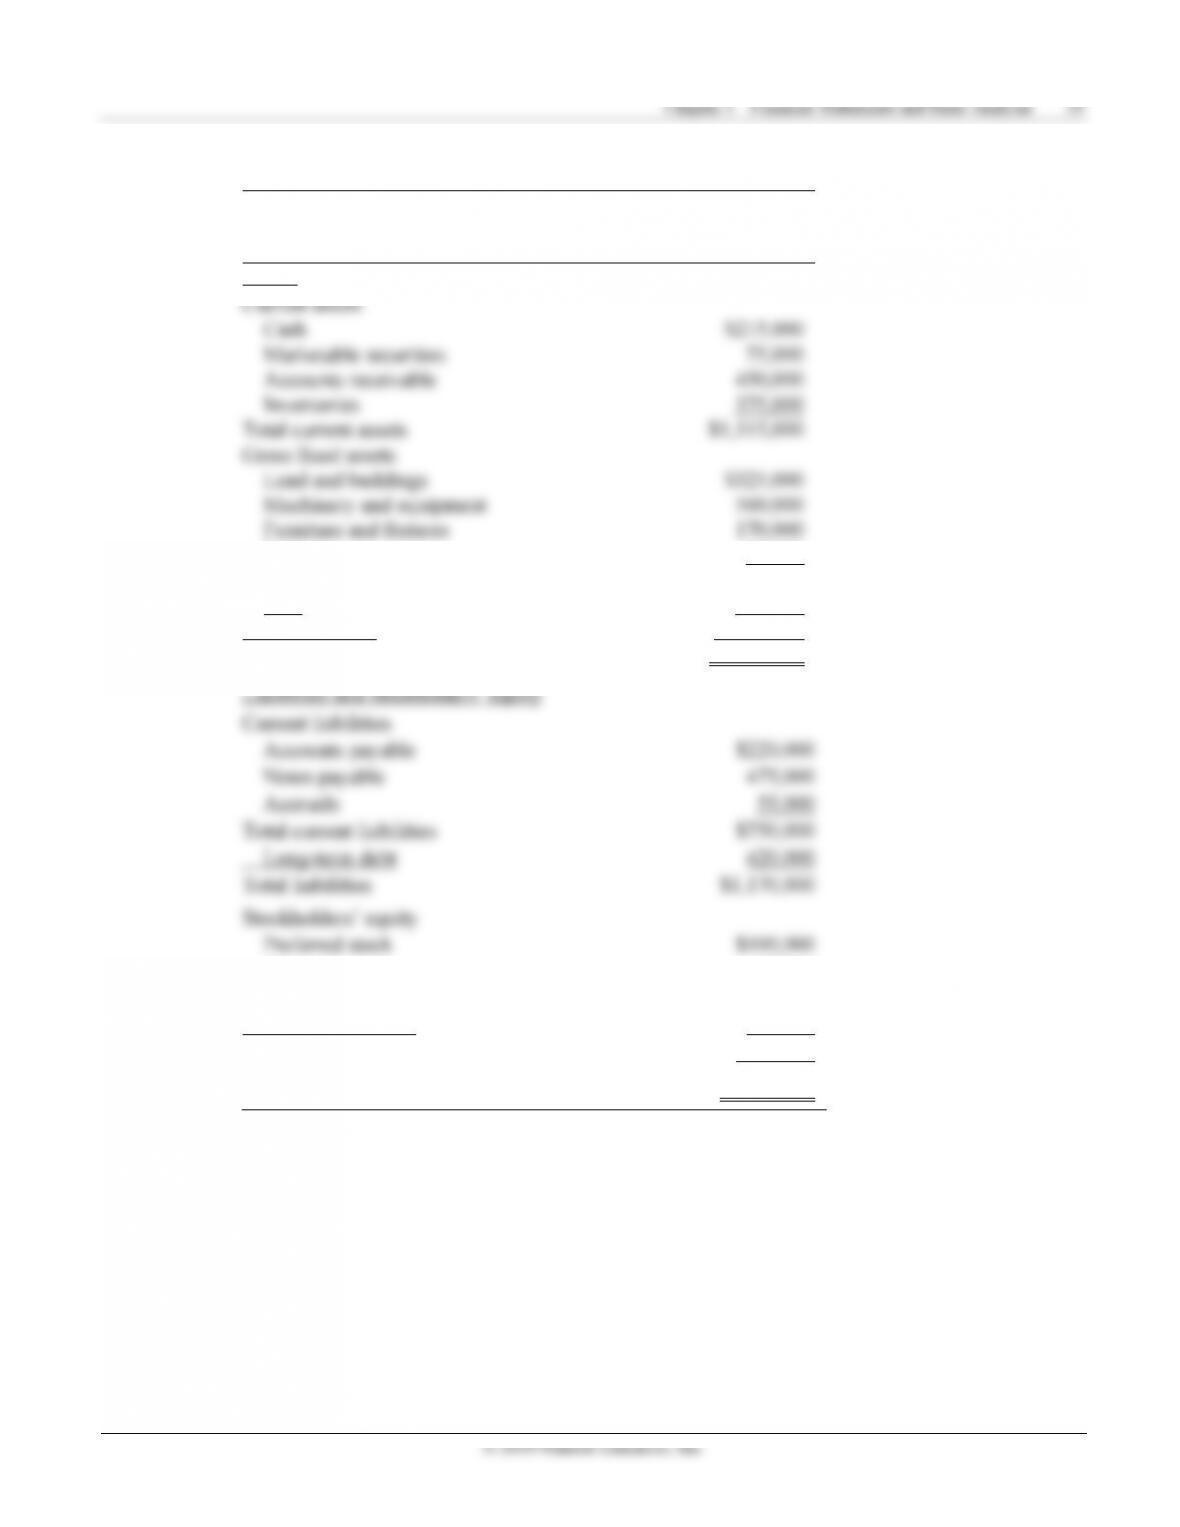
P3-4 Calculation of EPS and retained earnings (LG 1; Intermediate)
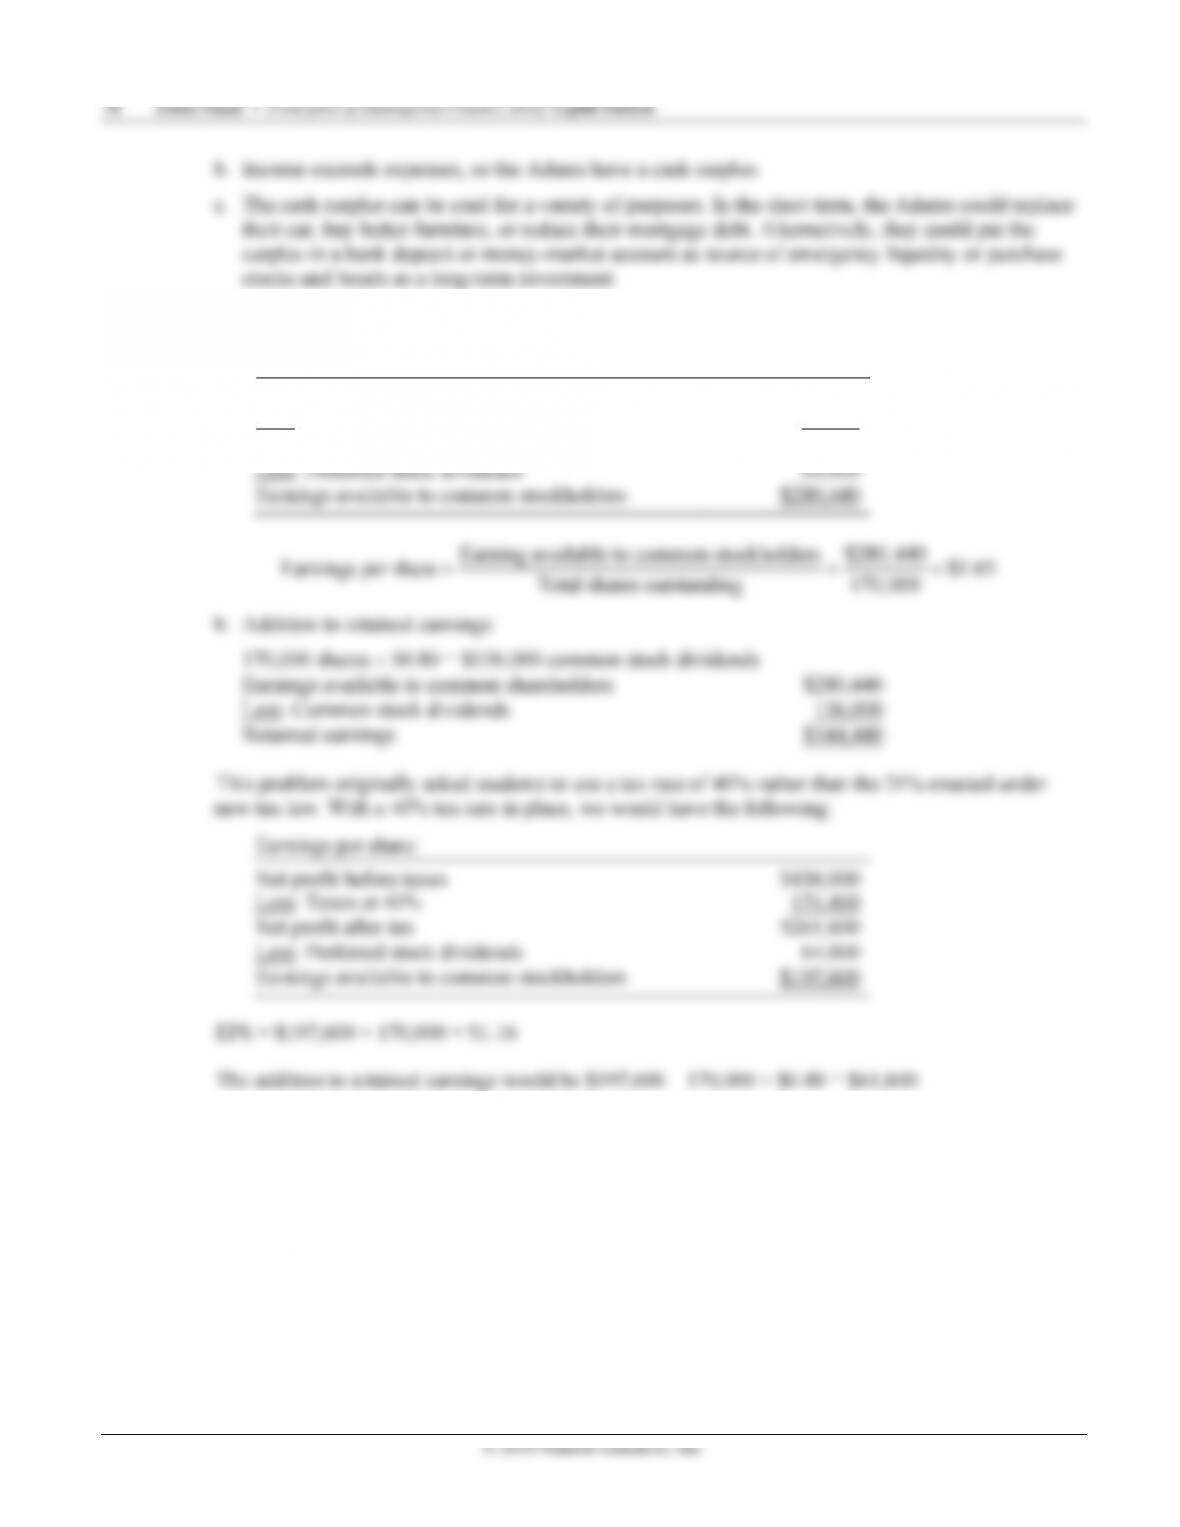
a. Earnings per share:
N
et profit before taxes $436,000
Less: Taxes at 21% 91,560
N
et profit after tax $344,440
N
N
Chapter 3 Financial Statements and Ratio Analysis 41
© 2019 Pearson Education, Inc.
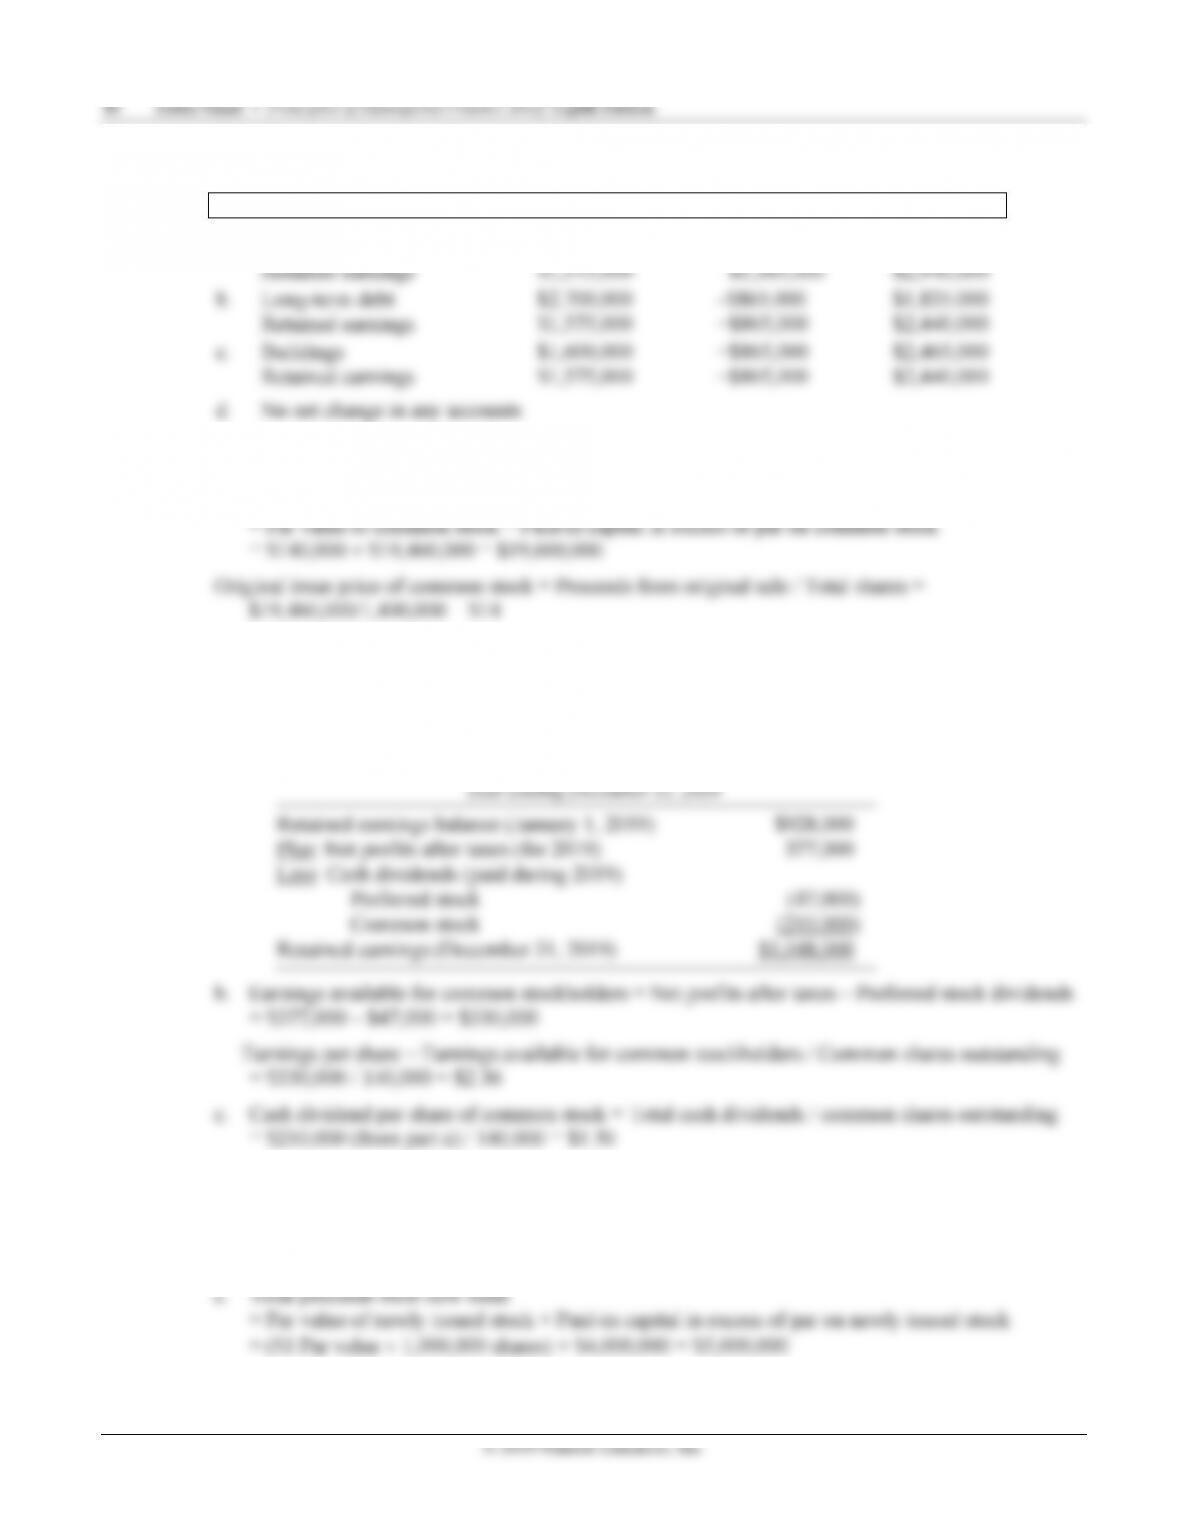
Average price of newly issued common stock = Total Proceeds from New Issue / Shares Issues
= $5,000,000 / 1,000,000 = $5.00
d. Original issue price
= Total Par Value (2018) + Paid-in Capital (2018) / Shares Outstanding (2018)
= [$500,000 + $500,000] / 500,000 = $2.00
P3-10 Ratio comparisons (LG 2, LG 3, LG 4, and LG 5; Basic)
a. The companies operate in dissimilar industries, with wide-ranging differences in the nature of the
product delivered, amount of plant/equipment needed for production, age of the industry, and
degree of government regulation. So ratio comparisons will be apples to oranges.
b. The electric utility and fast-food restaurant operate with lower liquidity ratios than the other firms,
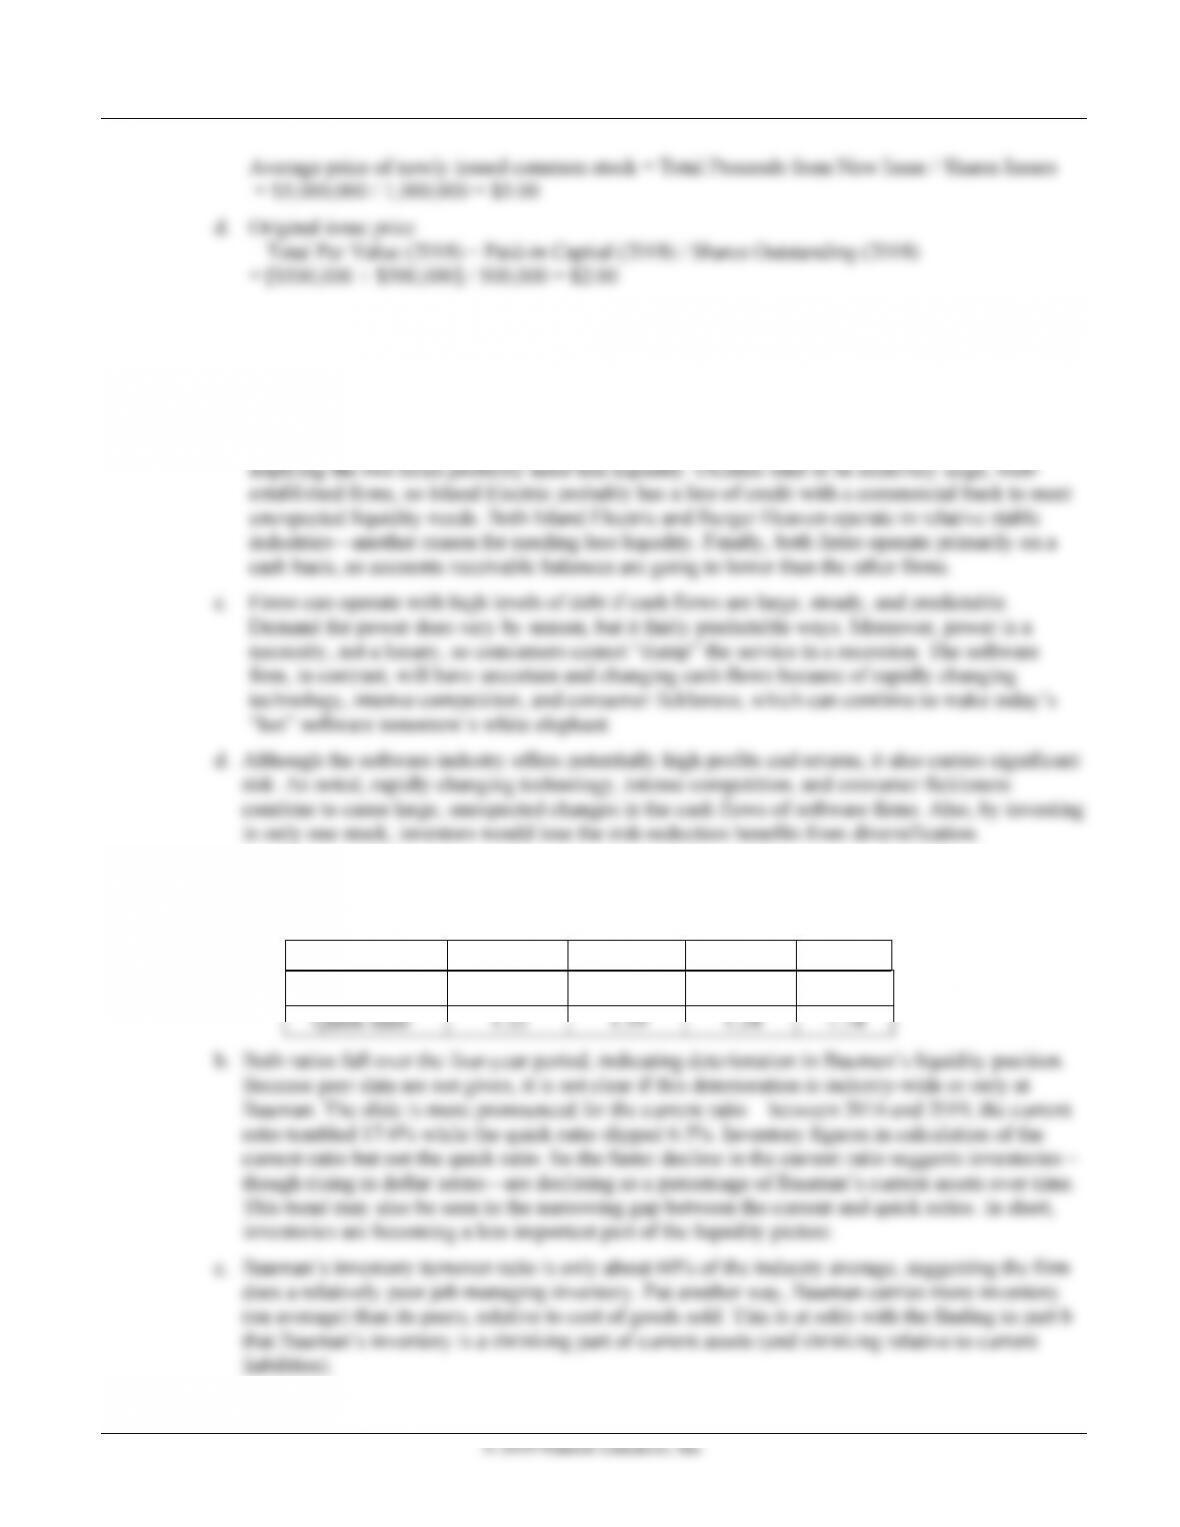
P3-11. Liquidity management (LG 3; Challenging)
a. Both Bauman’s liquidity ratios are falling over time as shown below.
Ratio 2016 2017 2018 2019
Current ratio 1.88 1.74 1.79 1.55