Chapter 12 Leverage and Capital Structure 271
P12-18 Personal finance: Capital structures (LG 3; Intermediate)
a. Monthly mortgage payment ÷ Monthly gross income = $1,100 ÷ $4,500 = 24.44%
P12-19 Various capital structures (LG 3; Basic)
Debt Ratio Debt Equity
10% $100,000 $900,000
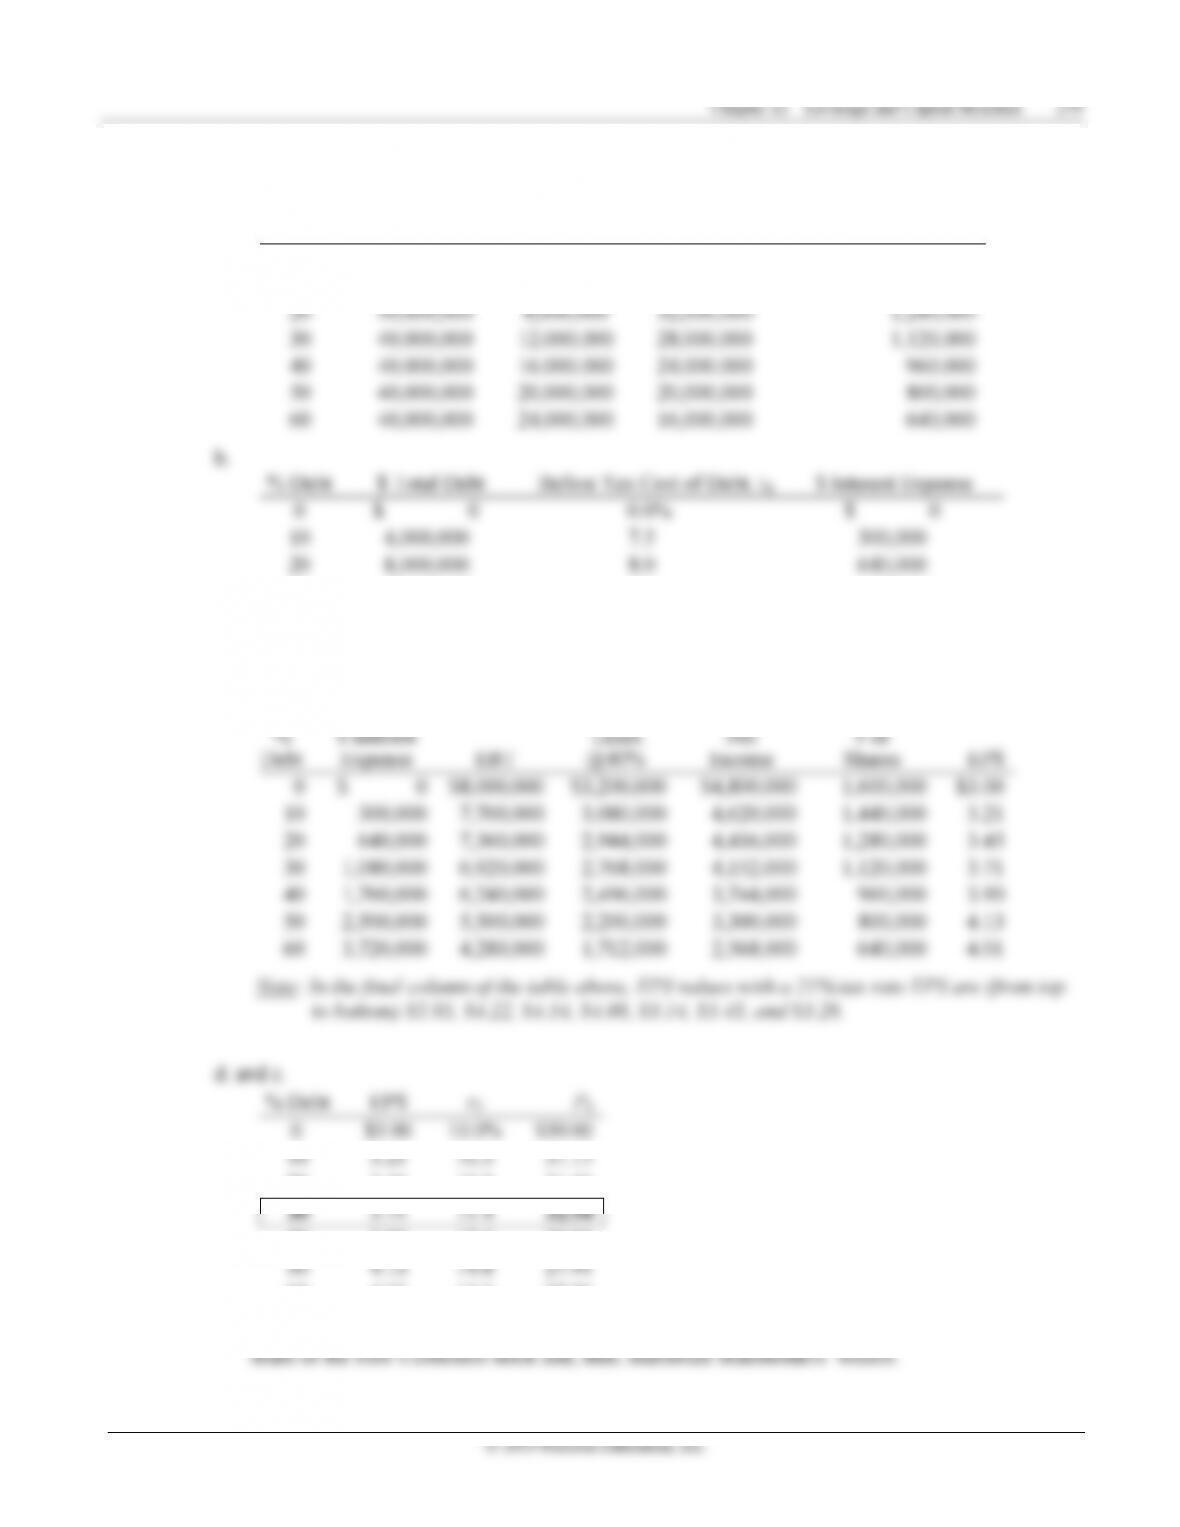
P12-20 Debt and financial risk (LG 3; Challenge)
a. EBIT Calculation:
Probability 0.20 0.60 0.20
Sales $200,000 $300,000 $400,000
Less: Variable costs (70%) 140,000 210,000 280,000
© 2019 Pearson Education, Inc.
σ
===
EPS
EPS 1.138 6.32
Expected EPS 0.18
CV
c.
EBIT * $(15,000) $15,000 $45,000
==EPS
$0.759 1.265
0.60
CV
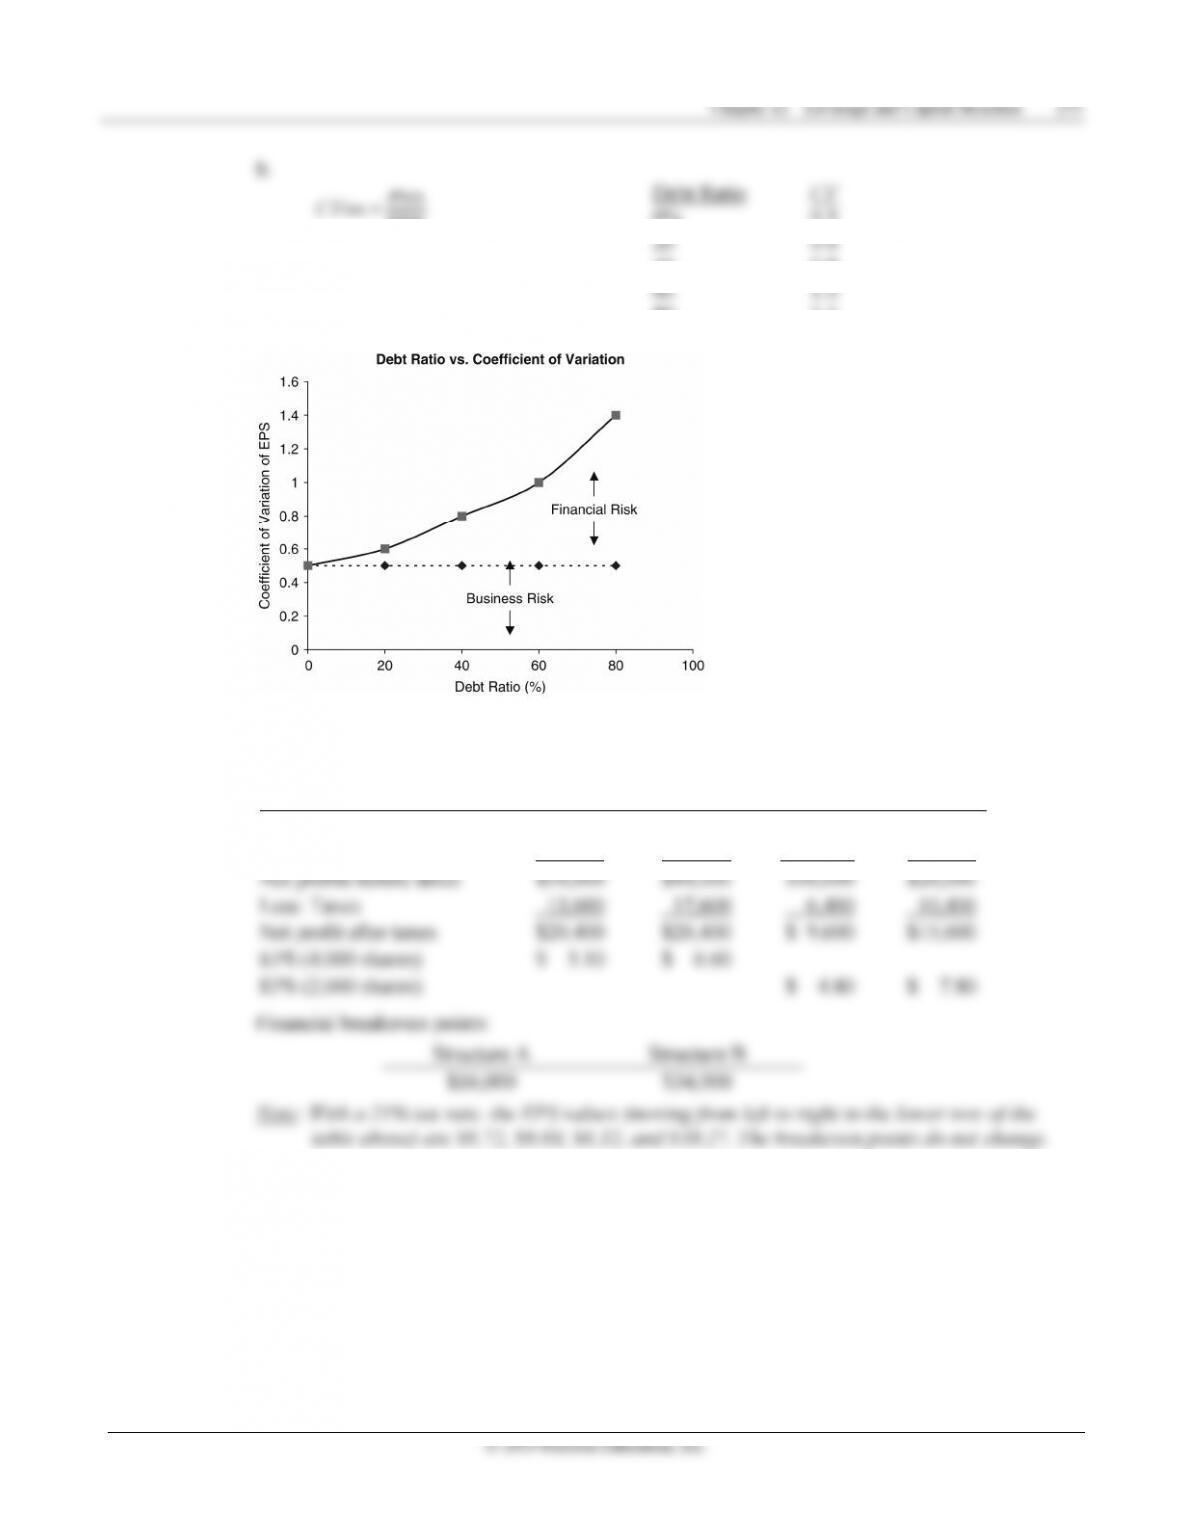
d. Summary statistics:
of variation than the all-equity structure.
Eliminating debt from the firm’s capital structure
greatly reduces financial risk (as measured by the
coefficient of variation for EPS).
CVEPS 6.320 1.265
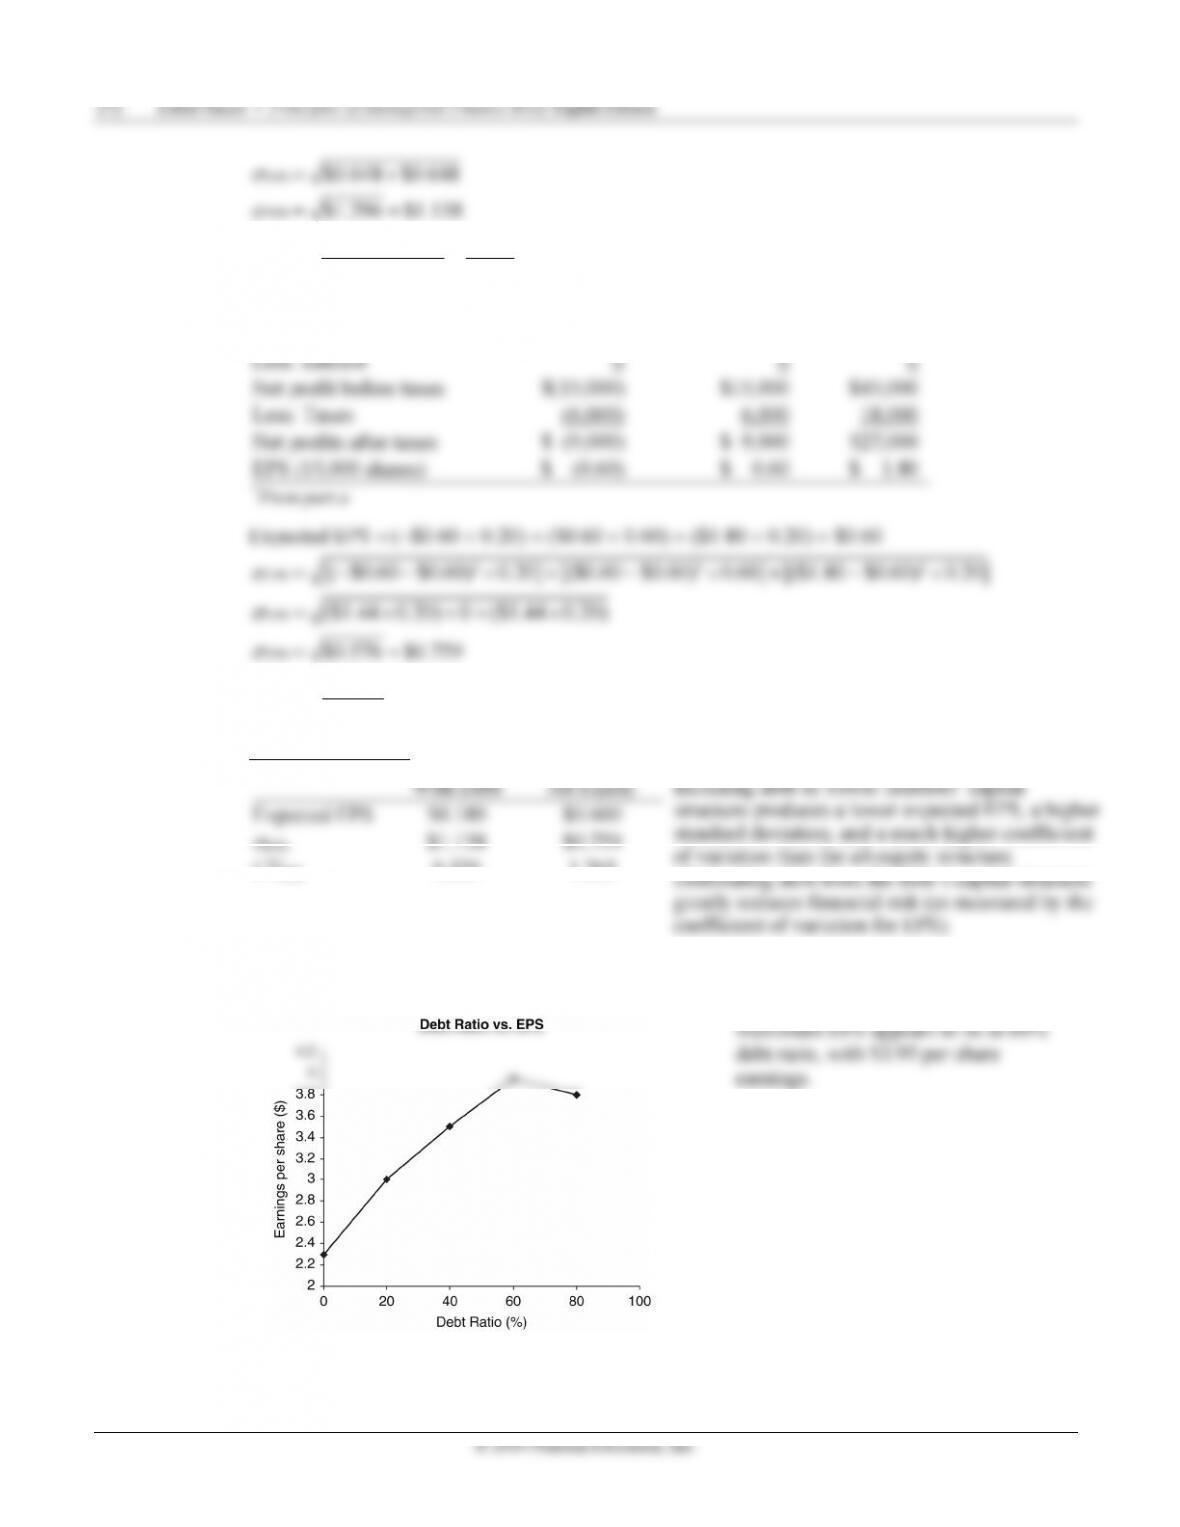
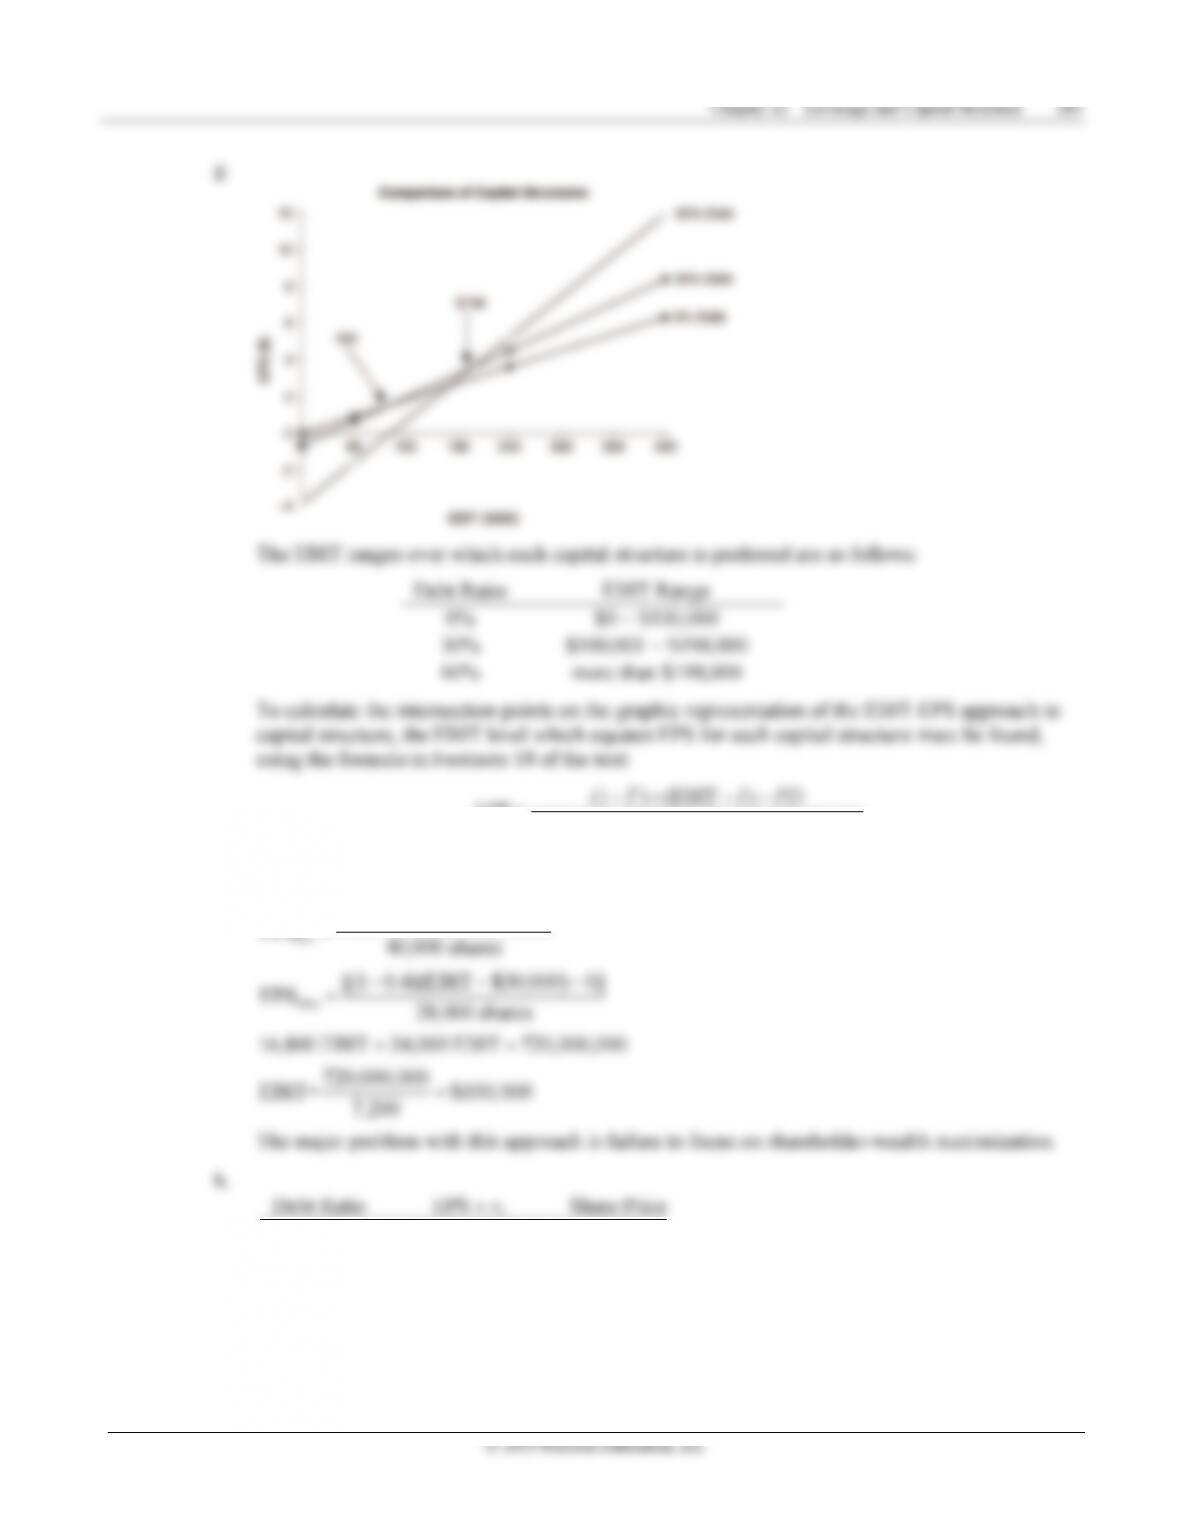
P12-21 EPS and optimal debt ratio (LG 4; Intermediate)
a.
© 2019 Pearson Education, Inc.
0% 0.5
40 0.8
80 1.5
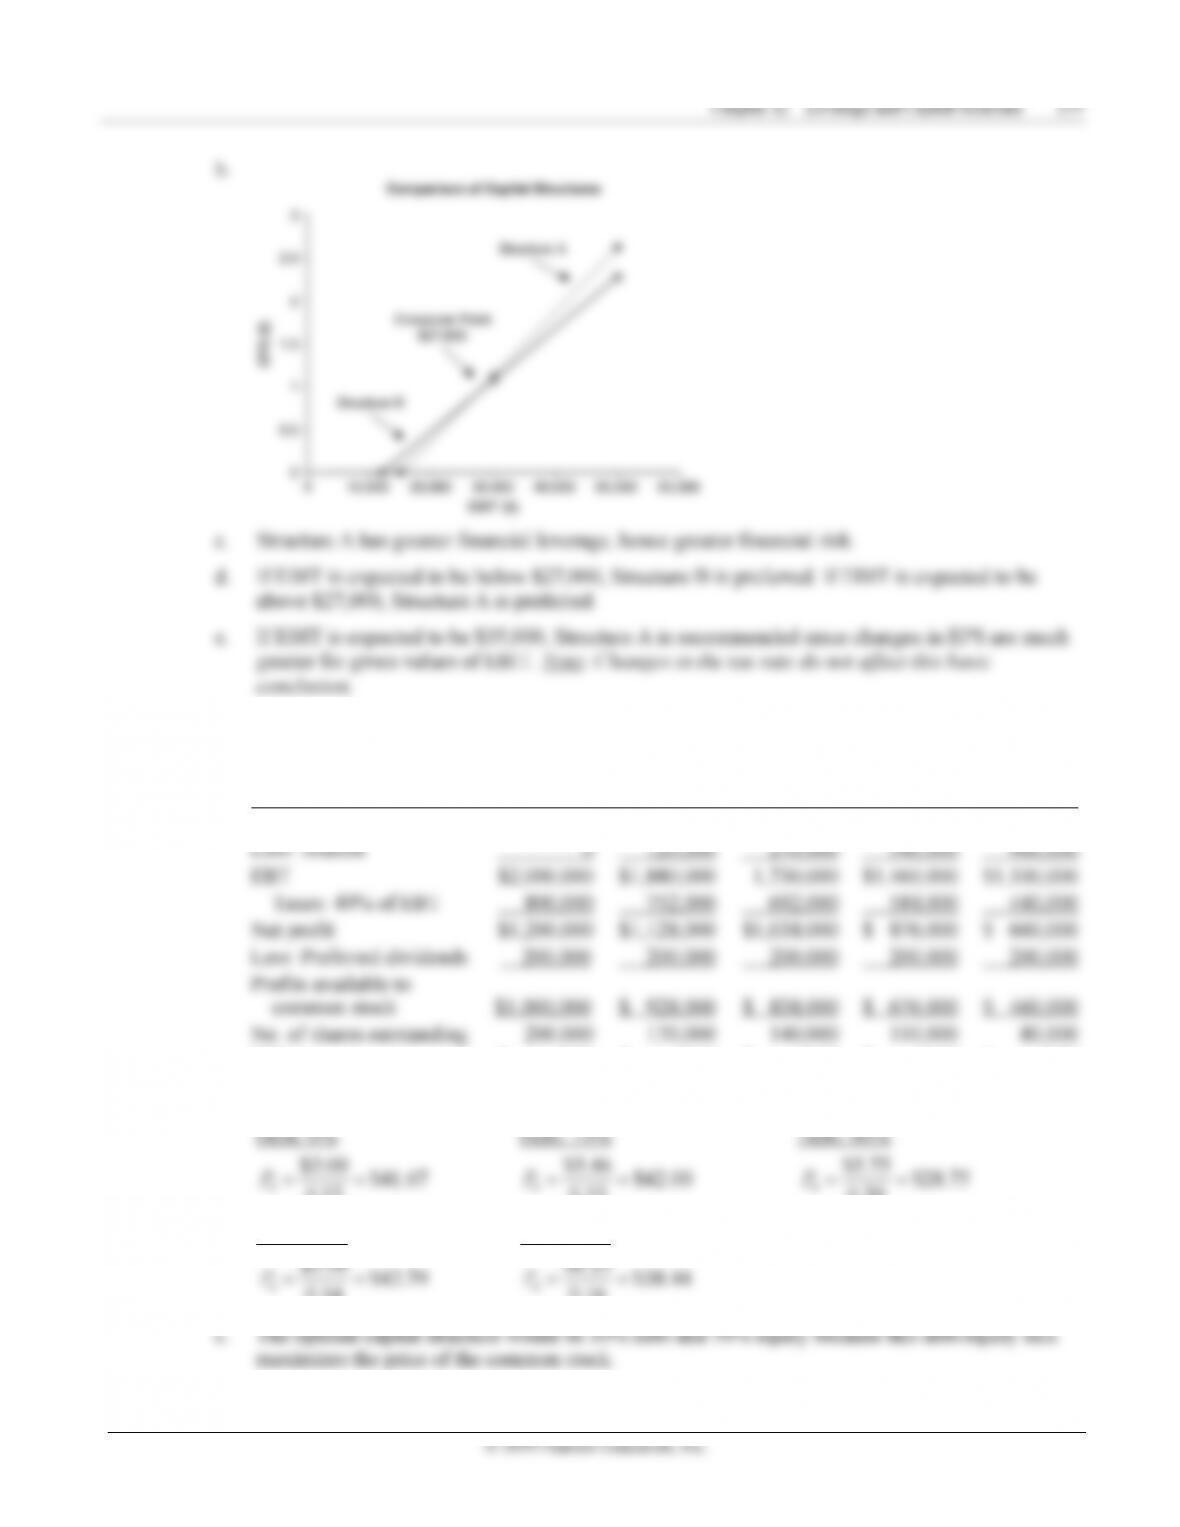
P12-22 EBIT-EPS and capital structure LG 5; Intermediate
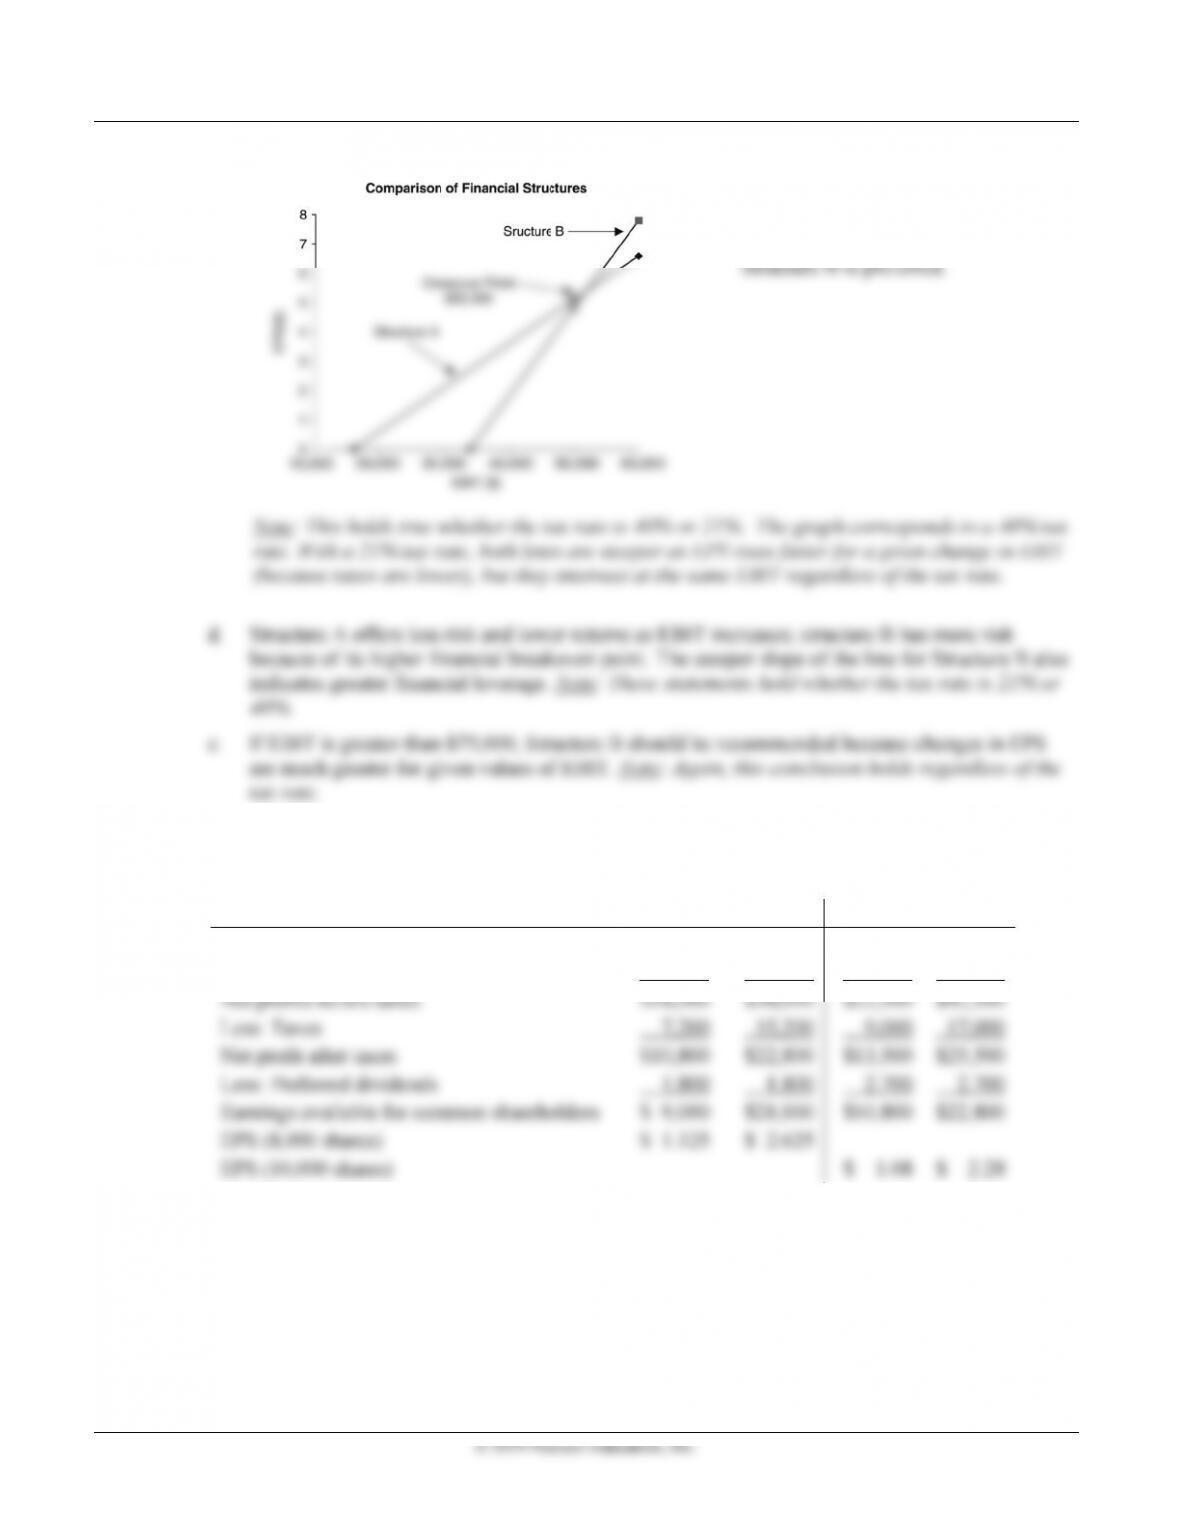
a. Using $50,000 and $60,000 EBIT:
Structure A Structure B
EBIT $50,000 $60,000 $50,000 $60,000
Less: Interest 16,000 16,000 34,000 34,000
N
et profits before taxes $34,000 $44,000 $16,000 $26,000
Less: Taxes 13,600 17,600 6,400 10,400
N
et profit after taxes $20,400 $26,400 $ 9,600 $15,600
EPS (4,000 shares) $ 5.10 $ 6.60
EPS (2,000 shares) $ 4.80 $ 7.80
Financial breakeven points:
Structure A Structure B
$16,000 $34,000
Note: With a 21% tax rate. the EPS values (moving from left to right in the lower row of the
table above) are $6.72, $8.69, $6.32, and $10.27. The breakeven points do not change.
2
7
7
4 Zutter/S
m
b
.
t
t
0
S
S
m
art • Principl
e
and c.
i
i
e
e
8
a
a
m
o
o
2
1
1
2
e
s of Manageria
l
Finance Brief,
Eighth Edition
If
E
$5
2
if
E
u
E
BIT is expe
c
2
,000, Struct
u
E
BIT is expec
c
ted to fall be
l
u
re A is prefe
r
ted to top $5
2
l
ow
r
red and
2
,000,
o
.
o
c
s
n
i
b
c
n
E
u
E
l
u
B
l
b
u
u
i
u
i
Chapter
12 Leverage
a
a
nd Capital Stru
c
c
ture 275
278 Zutter/Smart • Principles of Managerial Finance Brief, Eighth Edition
Probability (p)
p
1 = 0.20 p2 = 0.60 p3 =0.20
***
Debt
Ratio
Expected
(EPS)
σ
(EPS)
CV(EPS)
Common
Shares
Total
Debt ($)
Share Price*
= Expected EPS
÷ Required Return
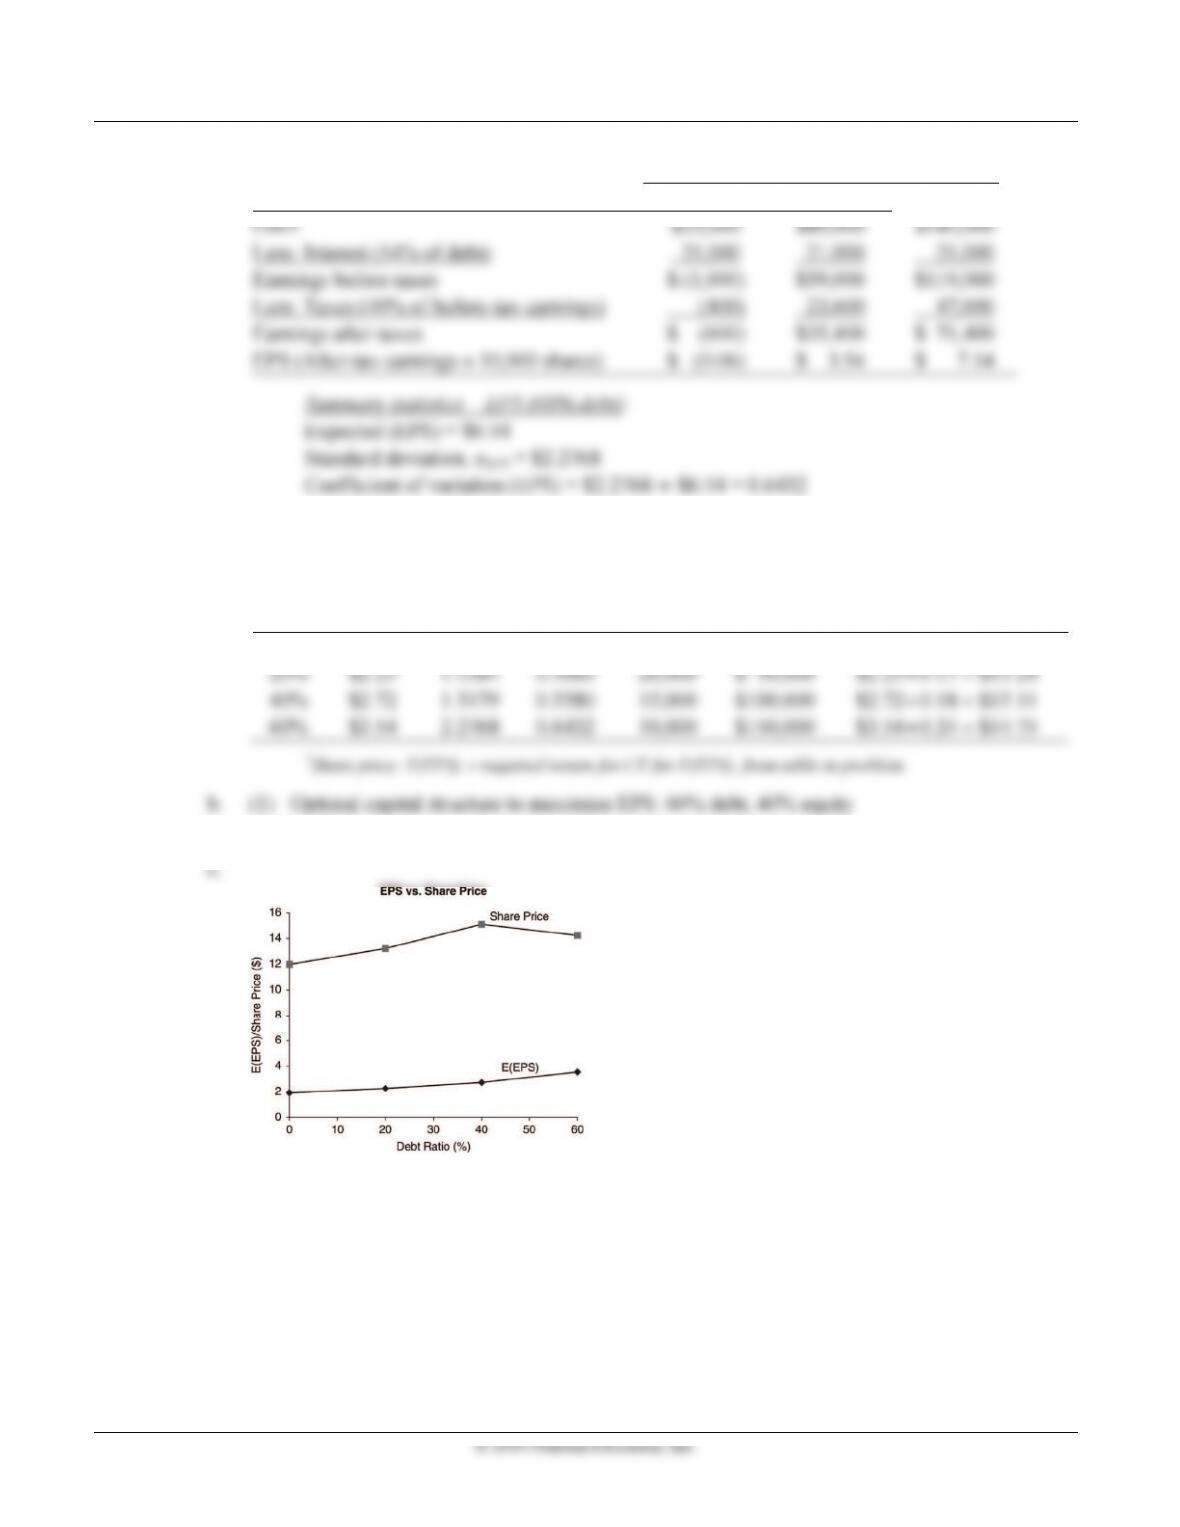
0% $1.92 0.9107 0.4743 25,000 0 $1.92÷0.16
=
$12.00
=
=
=
(2) Optimal capital structure to maximize share price: 40% debt, 60% equity
© 2019 Pearson Education, Inc.
$41.67, $42.82, $40.75, $36.70, and $30.19.
P12-27 Integrative: Optimal capital structure (LG 3, 4, 5, 6; Challenge)
0.30 0.40 0.30
Sales $600,000 $900,000 $1,200,000
Less: Variable costs (40%) 240,000 360,000 480,000
Less: Fixed costs 300,000 300,000 300,000
EBIT $ 60,000 $240,000 $ 420,000
t
t
c.
Deb
t
Ratio
Amoun
t
of Debt
Before-Tax
Cost of Debt
Annual
Interest
0% $ 0 0.0% $ 0
15% 150,000 8.0 12,000
© 2019 Pearson Education, Inc.
−
×
÷
=
−
×
÷
=
($240,000
−
$12,000)
×
(0.6)
÷
34,000 shares
=
4.02
($420,000
−
$12,000)
×
(0.6)
÷
34,000 shares
=
7.20
30% ($60,000 − $30,000) × (0.6) ÷ 28,000 shares = $0.64
($240,000
−
$30,000)
×
(0.6)
÷
28,000 shares
=
4.50
($420,000
−
$30,000)
×
(0.6)
÷
28,000 shares
=
8.36
−
×
÷
=
−
×
÷
=
−
×
÷
=
−
×
÷
=
×
+
×
+
×
0.27
+
1.44
+
1.89 = $3.60
15% 0.30 × (0.85) + 0.40 × (4.02) + 0.30 × (7.20)
+
+
0.19
+
1.80
+
2.51 = $4.50
45% 0.30 × (0.04) + 0.40 × (4.95) + 0.30 × (9.86)
+
+
−
0.47
+
2.07
+
3.58 = $5.18
(2) Standard deviation of EPS,
σ
EPS:
Debt Ratio Calculation
222
σ
σ
σ
EPS 7.232 0 7.232
σ
=++
= 3.803
22 2
−
×
÷
=
© 2019 Pearson Education, Inc.
=(1 ) (EBIT )
EPS number of common shares outstanding
Set EPS 0% = EPS 30% and EPS 30% = EPS 60%. The first calculation, EPS 0% = EPS 30%, is
as follows:
−−−
=
[(1 0.4)(EBIT $0) 0]
EPS 40,000 shares
0% $3.60 ÷ 0.100 $36.00
15% $4.03 ÷ 0.105 $38.38
30% $4.50 ÷ 0.116 $38.79
45% $4.95 ÷ 0.140 $35.36
60% $5.18 ÷ 0.200 $25.90
© 2019 Pearson Education, Inc.
P12-28 Ethics problem (LG 3; Intermediate)
An information asymmetry occurs when one party has more information than other interested parties.
Such an asymmetry can occur when managers overleverage or lead a company buyout Existing
bondholders and possibly stockholders could be harmed by the financial risk of overleveraging, and
existing stockholders will be harmed if they accept a buyout price below that consistent with accurate
c. Giv
e
slo
p
rati
o
of e
tha
n
abo
u
d. Rec
Alt
e
e. Alt
e
the
f
wit
h
stru
c
Sprea
Answers
on www
.
Grou
p
Group e
x
This cha
p
income
s
fixed/va
r
their fict
i
b
reakev
e
highligh
t
Returnin
Likewis
e
will con
c
shadow
a
e
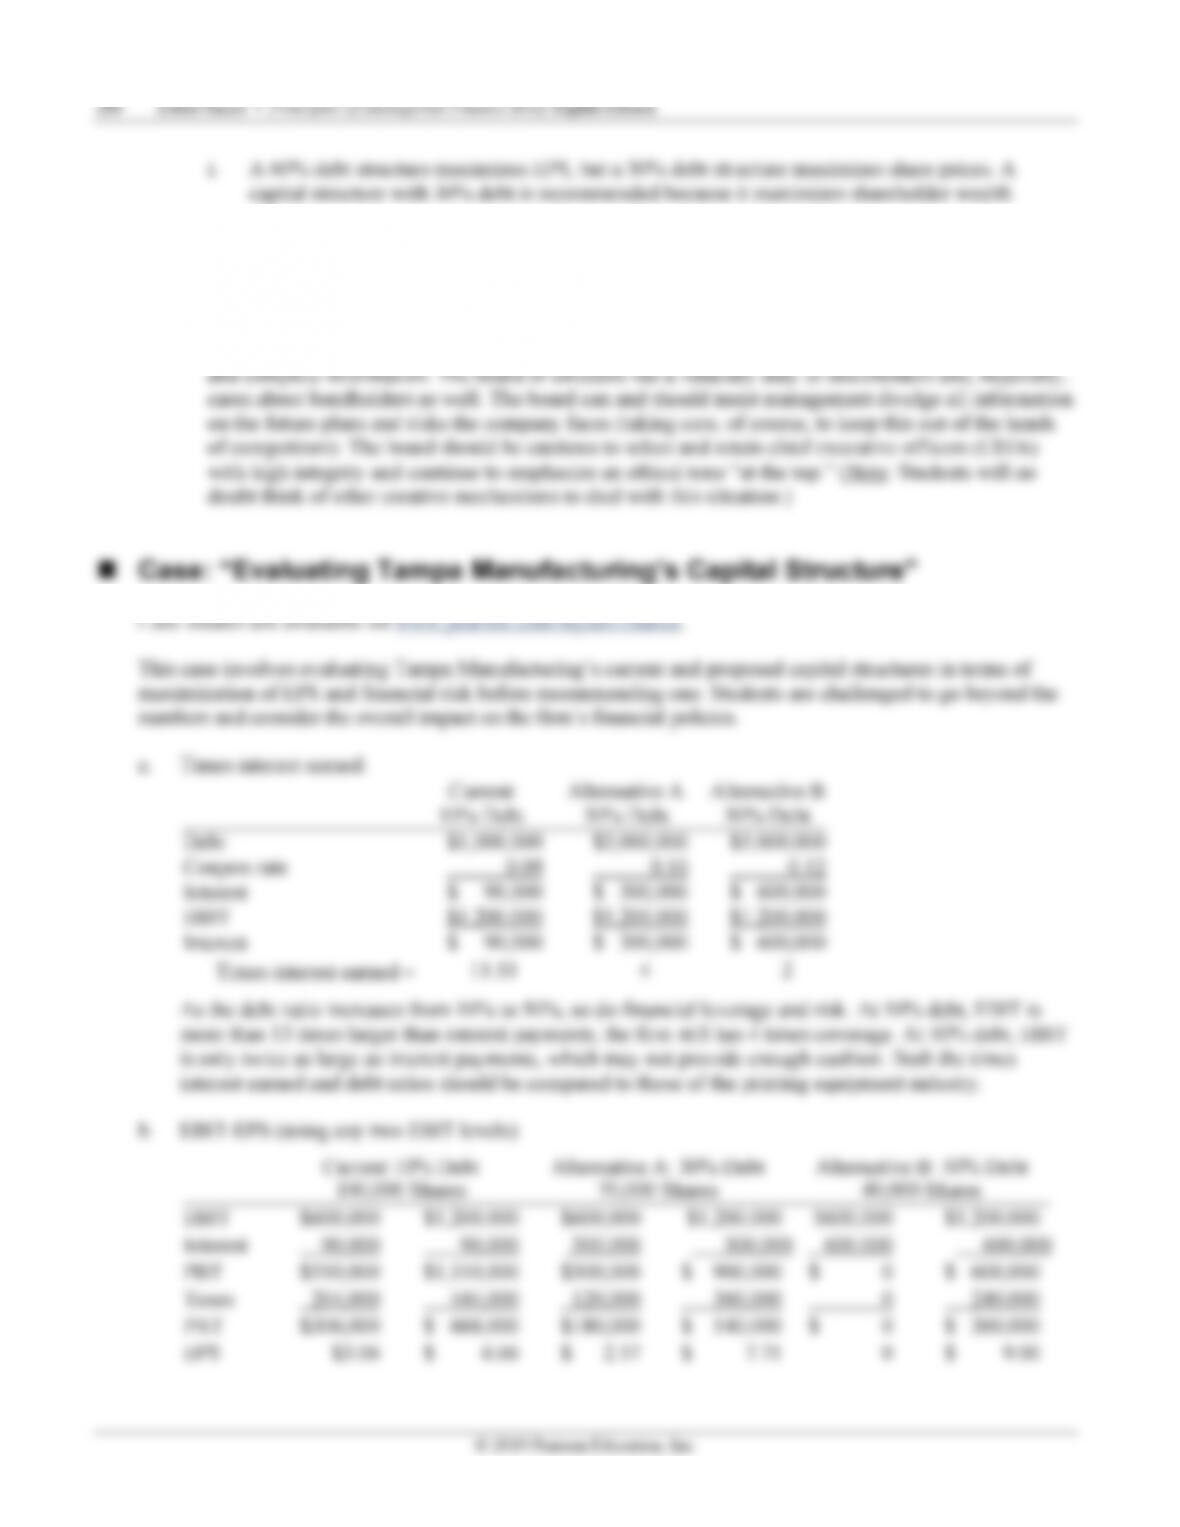
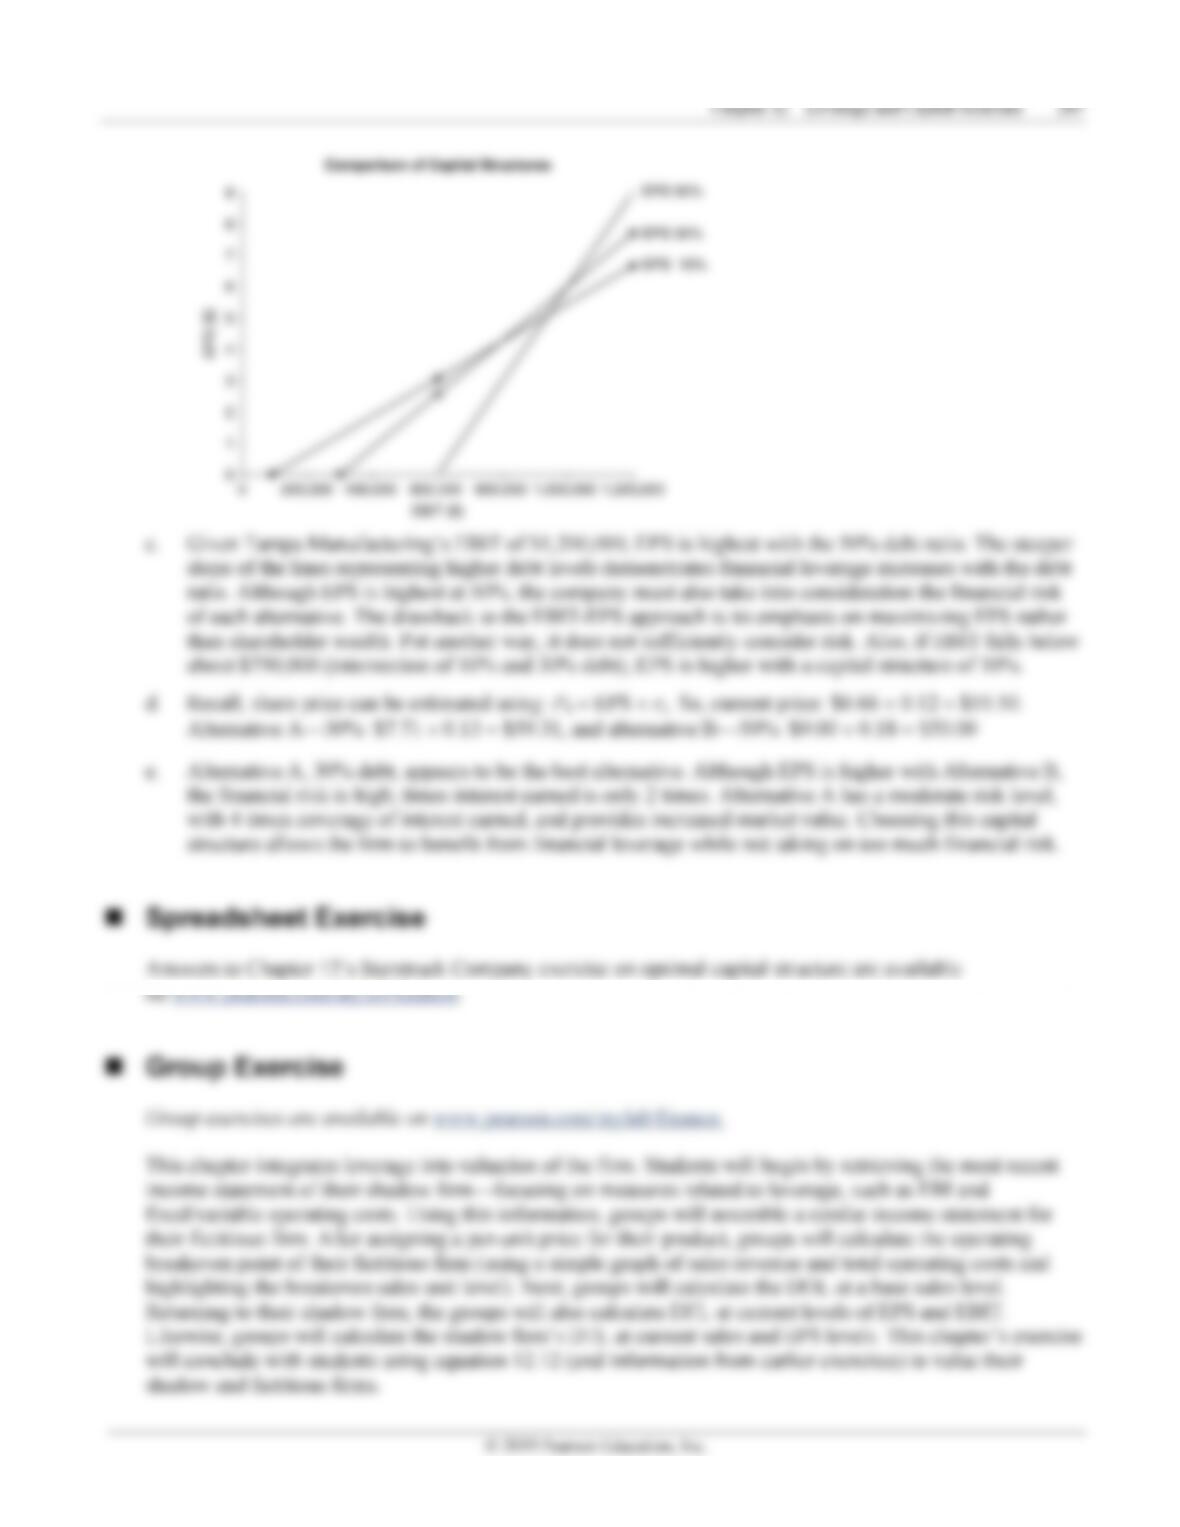
n Tampa M
a
p
e of the line
s
o
. Although
E
ach alternati
v
n
shareholder
u
t $750,000
(
all, share pri
c
e
rnative A—
3
e
rnative A, 3
0
f
inancial risk
h
4 times cov
e
c
ture allows
t
dsheet
E
to Chapter 1
2
.
pearson.co
m
p
Exercis
x
ercises are
a
p
ter integrate
s
tatement of t
h
r
iable operati
n
i
tious firm.
A
e
n point of th
e
t
ing the brea
k
g to their sha
e
, groups will
c
lude with st
u
a
nd fictitious
a
nufacturing’
representin
g
E
PS is highes
t
v
e. The draw
b
wealth. Put
a
(
intersection
o
c
e can be esti
m
3
0%: $7.71
÷
0
% debt, app
e
is high; time
e
rage of inte
r
t
he firm to b
e
E
xercise
2
’s Starstruc
k
m
/mylab/finan
c
e
a
vailable on
w
s leverage in
t
h
eir shadow
f
n
g costs. Usi
n
A
fter assignin
g
e
ir fictitious
f
k
even sales u
n
d
ow firm, th
e
calculate the
u
dents using
e
firms.
© 2019
P
s EBIT of $1
g
higher debt
l
t
at 50%, the
b
ack to the E
B
a
nother way,
i
o
f 10% and 3
0
m
ated using:
0.13
=
$59.3
e
ars to be the
s interest ear
n
est earned, a
n
e
nefit from fi
n
k
Company e
x
c
e.
w
ww.pearson
t
o valuation
o
f
irm—focusi
n
n
g this infor
m
g
a pe
r
-unit p
r
f
ir
m
(using a
s
n
it level). Ne
x
e
groups will
shadow firm
’
e
quation 12.1
2
P
earson Educati
o
,200,000, EP
l
evels demon
company mu
B
IT-EPS app
r
i
t does not su
0
% debt), EP
P
0
=
EPS
÷
r
1, and altern
a
best alternat
i
n
ed is only 2
n
d provides i
n
n
ancial lever
a
x
ercise on o
p
.com/mylab/
f
o
f the firm. S
t
n
g on measur
e
m
ation, group
s
r
ice for their
s
imple graph
x
t, groups wi
l
also calculat
e
’
s DTL at cu
r
2
(and infor
m
Chapter
o
n, Inc.
S is highest
w
strates finan
c
u
st also take i
n
r
oach is its e
m
u
fficiently co
n
P
S is higher
w
r
s
. So, curren
t
a
tive B—50
%
i
ve. Althoug
h
times. Alter
n
n
creased mar
k
a
ge while not
p
timal capital
f
inance.
t
udents will
b
es related to
l
s
will assem
b
product, gro
u
of sales reve
n
l
l calculate t
h
e
DFL at curr
r
rent sales an
d
m
ation from e
a
12 Leverage
a
w
ith the 50%
c
ial leverage
i
n
to considera
t
m
phasis on
m
n
sider risk. A
l
w
ith a capital
s
t
price: $6.66
%
: $9.00
÷
0.
1
h
EPS is high
e
n
ative A has
a
k
et value. C
h
taking on to
o
structure are
b
egin by retri
e
l
everage, suc
h
b
le a similar i
n
u
ps will calc
u
nue and total
h
e DOL at a b
r
ent levels of
E
d
EPS levels.
arlier exercis
a
nd Capital Stru
c
debt ratio. T
h
i
ncreases wit
h
t
ion the fina
n
m
aximizing E
P
l
so, if EBIT
f
s
tructure of 1
÷
0.12
=
$55
1
8
=
$50.00
e
r with Alter
n
a
moderate ri
s
h
oosing this c
a
o
much finan
c
available
e
ving the mo
s
h
as EBI and
n
come state
m
u
late the oper
a
operating co
ase sales lev
e
E
PS and EBI
T
This chapte
r
es) to value t
h
c
ture 285
h
e steeper
h
the debt
n
cial risk
P
S rather
f
alls below
0%.
.50.
n
ative B,
s
k level,
a
pital
c
ial risk.
s
t recent
m
ent for
a
ting
sts and
e
l.
T
.
r
’s exercise
h
eir