

Part 6
Long-Term Financial Decisions
Chapters in This Part
Chapter 12 Leverage and Capital Structure
Chapter 13 Payout Policy


Chapter 12
Leverage and Capital Structure
Instructor Resources
Chapter Overview
This chapter introduces students to operating and financial leverage and the associated business and financial
risks. As a prelude to operating leverage, breakeven analysis is explained (and its limitations noted) with help
from pictures and algebra. Next, the degree of operating, financial, and total leverage are introduced and
developed as tools for measuring the risk of the firm associated with differing operating and financial
structures. Finally, the notion of optimal capital structure— the mix of debt and equity that maximizes firm
value—is introduced conceptually along with the EBIT-EPS and valuation model approaches to evaluating
capital structure. Chapter 12 concludes by showing how breakeven analysis, leverage, and risk arising from
borrowing will affect the personal as well as professional lives of students.
Note to instructors: After the first print run of this edition, Congress passed the Tax Cuts and Jobs Act, which
made sweeping changes to the corporate tax code. The original print run of this edition did not incorporate
any of the changes of that Act, but subsequent printings did. Some problems below have solutions for the
current 21% corporate tax rate (reflected in recent printings), as well as solutions for a tax rate (appearing in
the first print run) reflecting the older tax law.
Answers to Review Questions
12-1 Leverage refers to the use of fixed expenses to magnify shareholder returns. Operating leverage
refers to the use of fixed operating costs to magnify the impact of changes in sales revenue on
earnings before interest and taxes (EBIT). Financial leverage refers to the use of fixed financial costs
12-2 The firm’s operating breakeven point is the level of sales at which all fixed and variable operating
costs are covered, i.e., EBIT equals zero. An increase (decrease) in fixed operating costs and variable

12-3 Operating leverage is the ability to use fixed operating costs to magnify the effects of changes in
sales on earnings before interest and taxes. Operating leverage results from the existence of fixed
operating costs in the firm’s overall cost structure. The degree of operating leverage (DOL) is
12-4 Financial leverage refers to the use of fixed financial costs to magnify the effects of changes in EBIT on
earnings and earnings per share (EPS); it arises when a firm relies on funding sources with fixed costs
such as interest on debt and dividends on preferred stock. The degree of financial leverage (DFL) can
12-5 The total leverage of the firm is the combined effect of fixed costs (operating and financial) on EPS;
it reflects both operating and financial leverage. Increases in either type of leverage will increase the
12-6 A firm’s capital structure is the mix of long-term debt and equity it utilizes. The key differences
between debt and equity capital are summarized:
Characteristic Debt Equity
Voice in management* No Yes

12-7 In general, non-U.S. companies rely much more on debt than U.S. corporations. In large part, this
difference reflects the relative sophistication of U.S. capital markets, which offer a large menu of
financing options. Also, large commercial banks take an active role in financing foreign corporations.
12-8 The tax deductibility of interest is the major benefit of debt finance. In effect, the government
12-9 Business risk refers to fluctuations of the firm’s cash flows not traceable to fixed-cost financing.
Business risk reflects (i) fixed operating costs (operating leverage), revenue stability, and cost
stability. Revenue stability refers to the variability of the firm’s sales revenues, which in turn depends
12-10 An agency problem arises in borrowing because lenders provide funds based on their expectations
about firm risk. But firm managers can increase shareholder wealth by increasing risk after loan terms
12-11 Asymmetric information results when a firm’s managers have more information about operations and
future prospects than investors. This information edge could cause financial managers to raise funds
using a pecking order (a hierarchy of financing beginning with retained earnings, followed by debt,
12-12 As financial leverage increases, both the cost of debt and the cost of equity increase, with equity
rising at a faster rate. As reliance on debt rises, the overall cost of capital first decreases to a

12-13 The EBIT-EPS approach shows how different capital structures affect EPS over a range of EBIT. The
EBIT-EPS approach involves selecting the capital structure providing maximum EPS, which
12-14 It is unlikely that attempts to maximize value would produce the same capital structure as attempts to
12-15 The firm should find the capital structure that balances risk and return to maximize share value. This
requires estimating EPS and required rates of return for different levels of debt then choosing the
debt-equity mix that produces the highest share price. In addition to quantitative considerations, the
firm should take into account factors related to business risk, agency costs, and asymmetric

Answers to Warm-Up Exercises
E12-1 Breakeven analysis
E12-2 Changing costs and the operating breakeven point
E12-3 Degree of operating leverage (DOL)
E12-4 Degree of financial leverage (DFL)
E12-5 Net operating profits after taxes (NOPAT)
P12-1 Breakeven point: Algebraic (LG1; Basic)
Q = Fixed Cost ÷ (Price – Variable Cost) = $12,350 ÷ ($24.95 – $15.45) = 1,300.
P12-2 Breakeven comparisons: Algebraic (LG 1; Basic)
()
$18.00 $6.75
− Firm H:
()
$30.00 $12.00
−
()
$21.00 $13.50
−
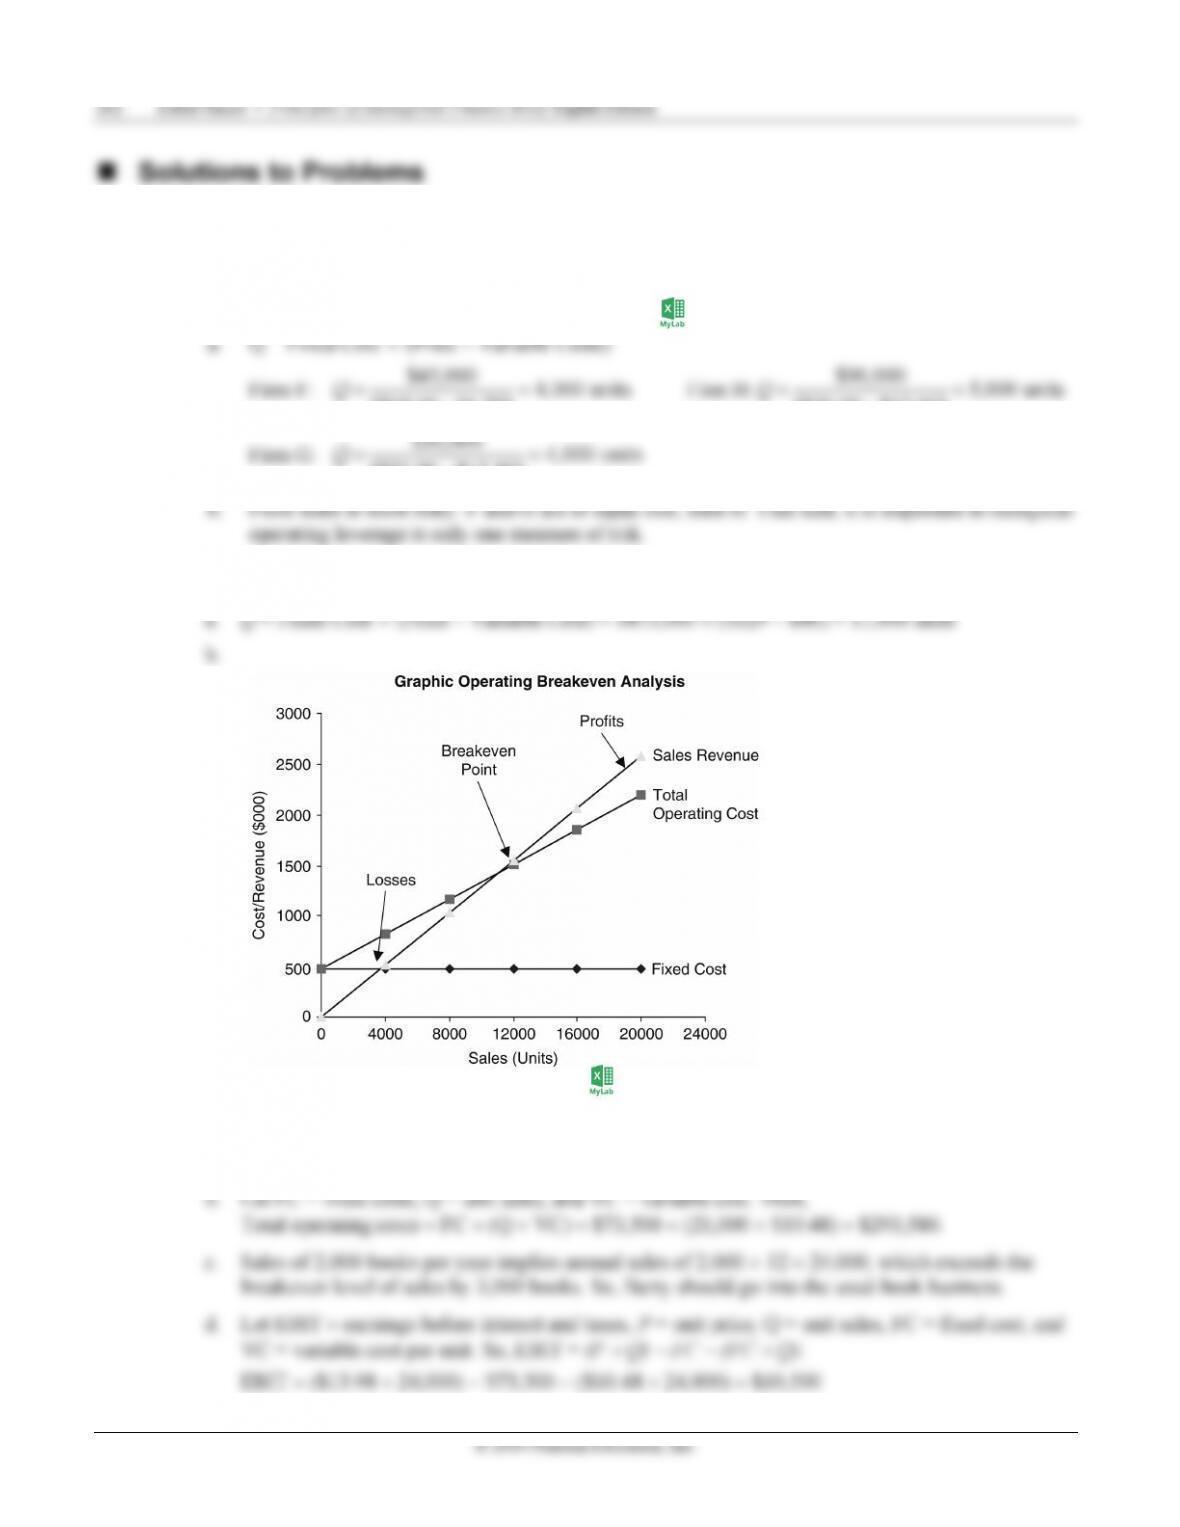
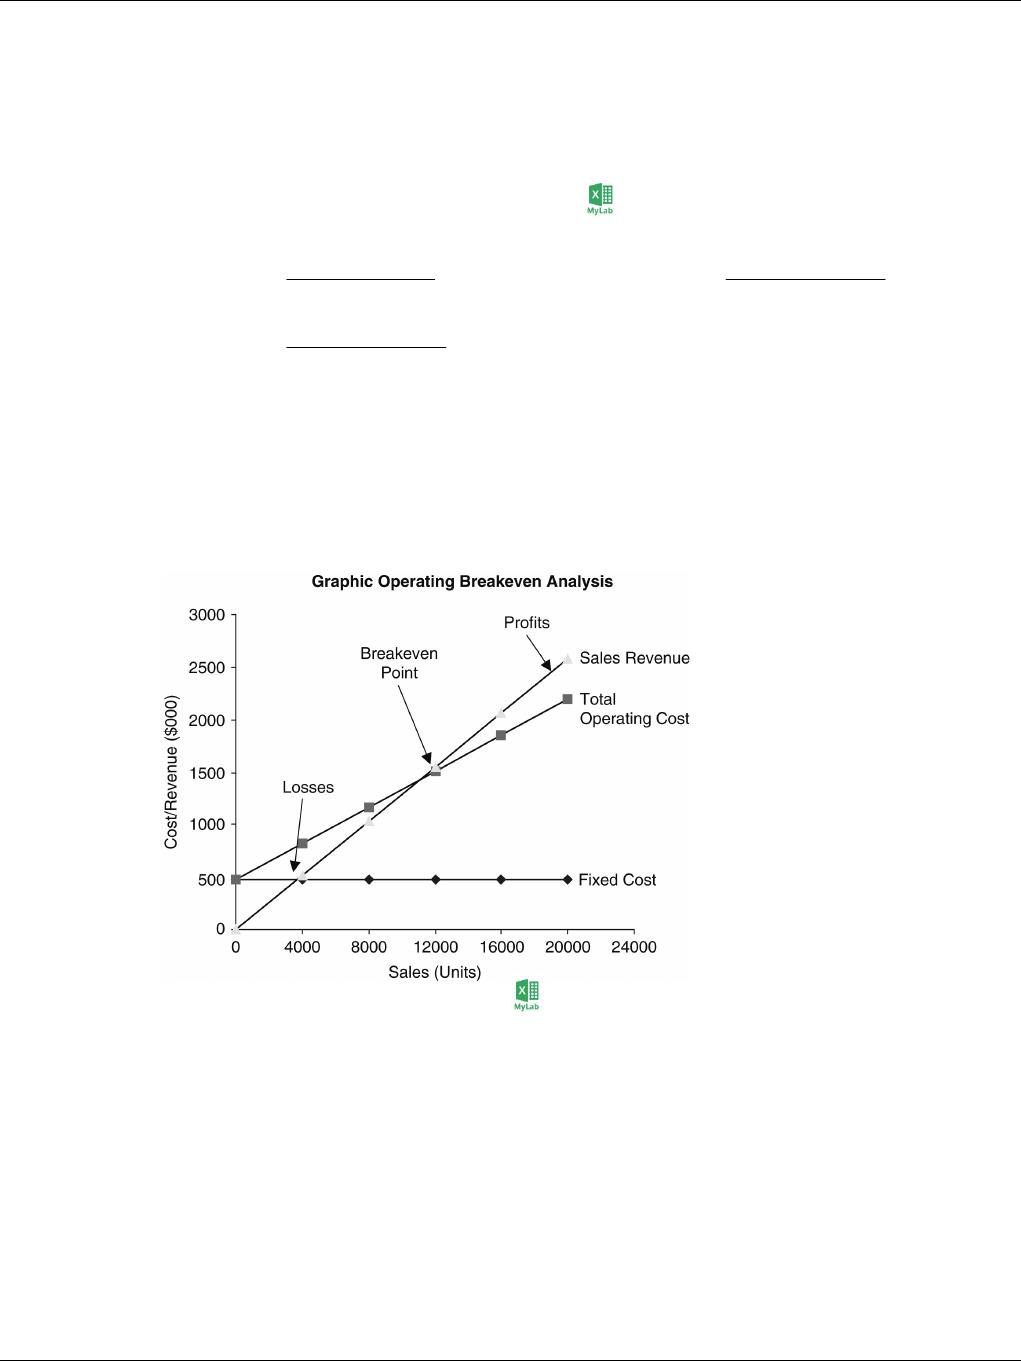
P12-3 Breakeven point: Algebraic and graphical (LG 1; Intermediate)
P12-4 Breakeven analysis (LG 1; Intermediate)
a. Let QBE = breakeven level of unit sales, FC = fixed cost, P = price, and VC = variable cost per
unit. QBE = FC ÷ (P – VC) = $73,500 ÷ ($13.98 – $10.48) = 21,000 books.

P12-5 Personal finance: Breakeven analysis (LG 1; Easy)
a. Breakeven point in months = fixed cost ÷ (monthly benefit – monthly variable costs)
P12-6 Breakeven point: Changing costs/revenues (LG 1; Intermediate)
Let QBE = breakeven level of unit sales, FC = fixed cost, P = price, and VC = variable cost per unit.
P12-7 Breakeven analysis (LG 1; Challenge)
Let Q = unit sales, FC = fixed cost, P = price, and VC = variable cost per unit.
a. QBreakeven = FC ÷ (P − VC) = $4,000 ÷ ($8.00 – $6.00) = 2,000 figurines.
b. Sales $10,000
Less:
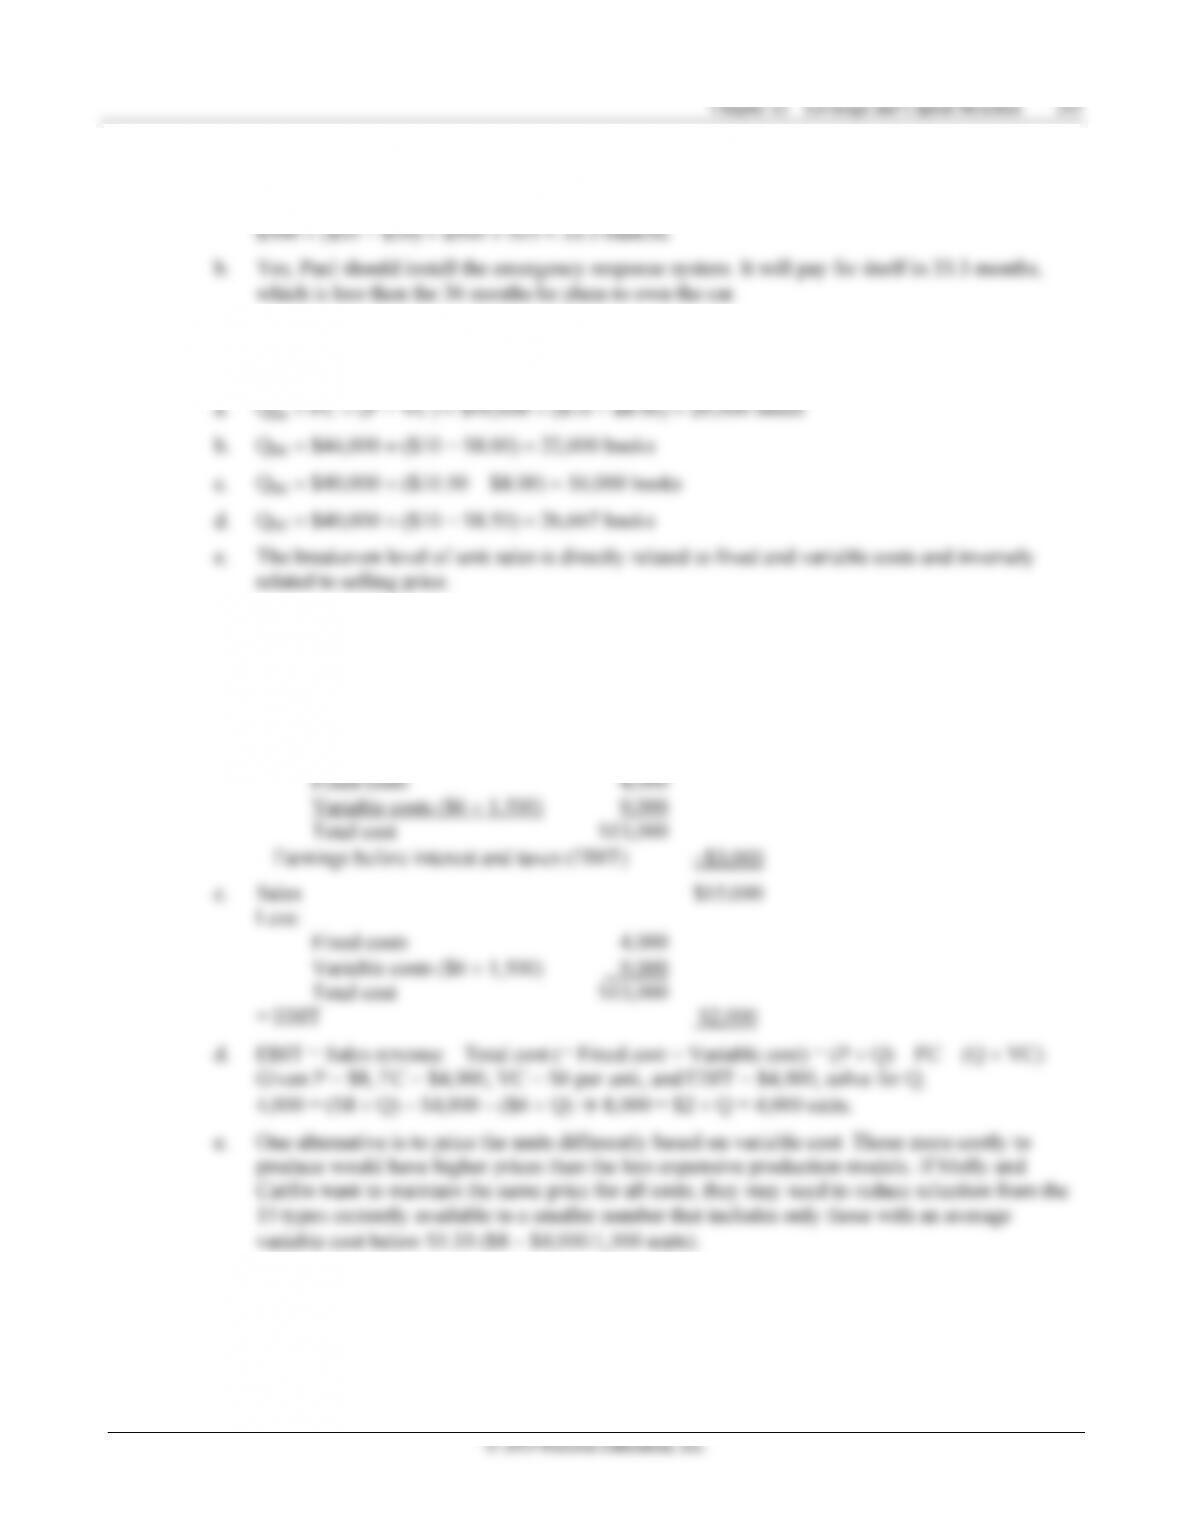
P12-8 EBIT sensitivity (LG 2; Intermediate)

264 Zutter/Smart • Principles of Managerial Finance Brief, Eighth Edition
a. and b.
8,000 Units 10,000 Units 12,000 Units
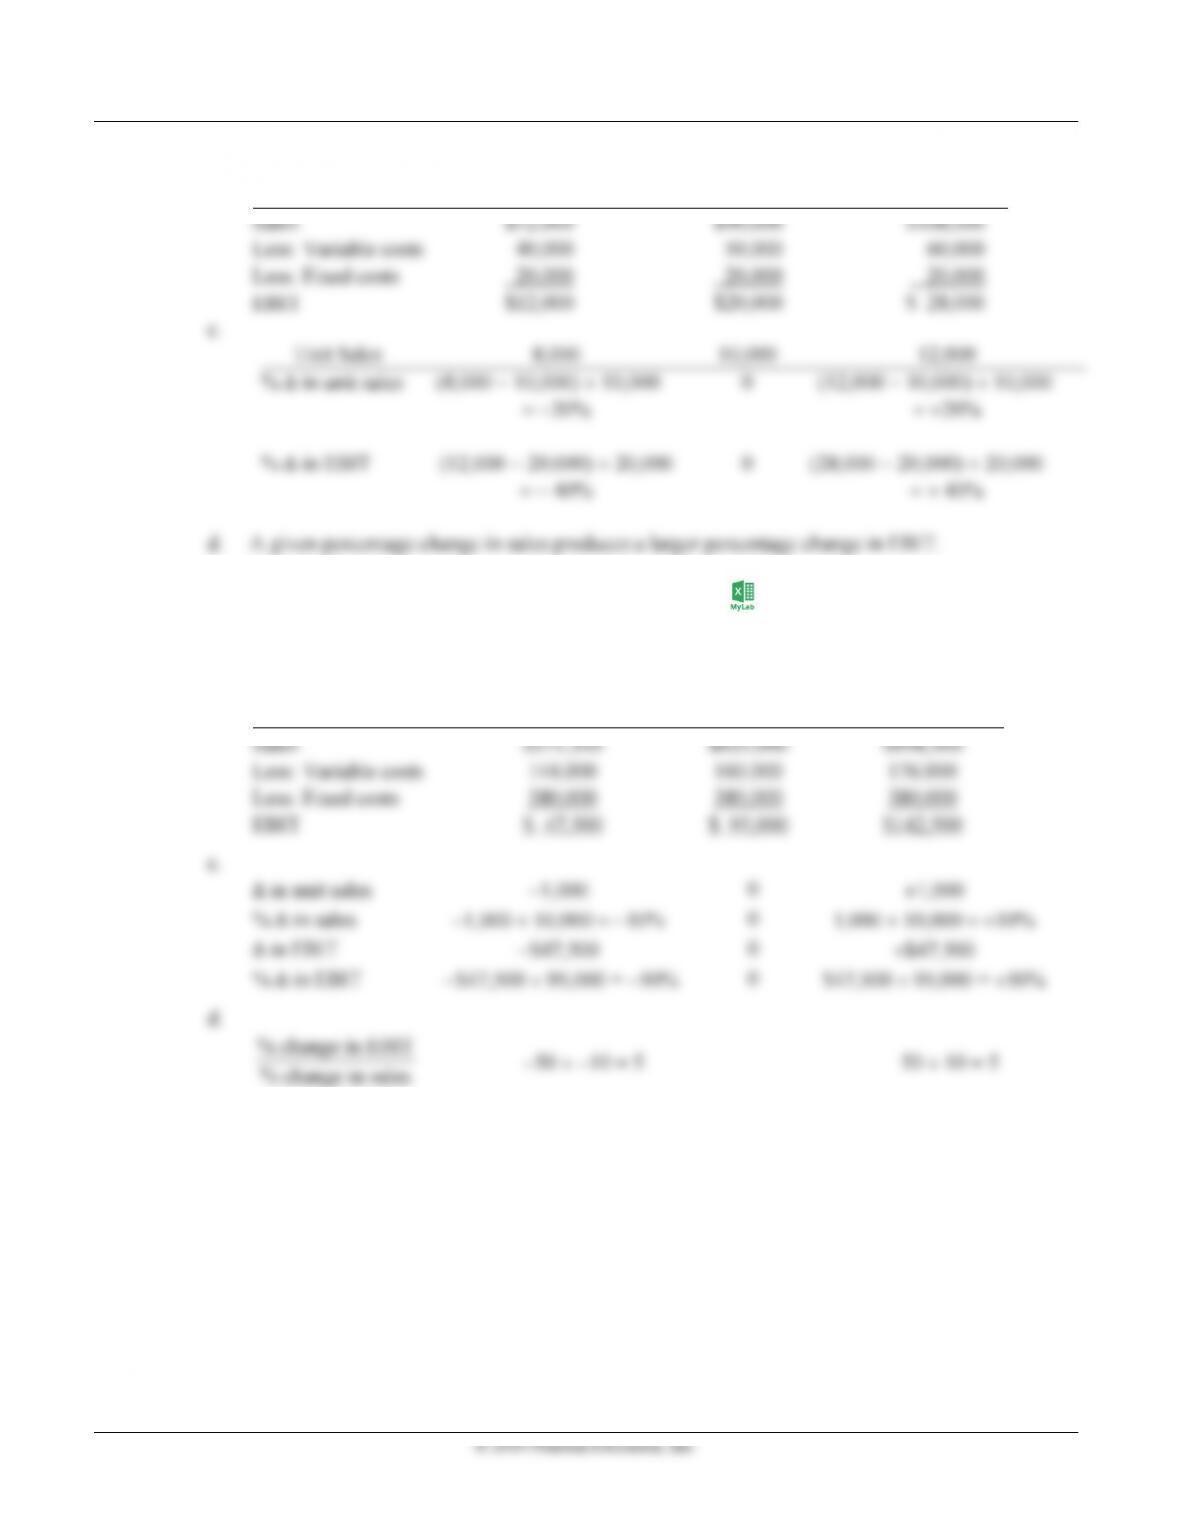
P12-9 Degree of operating leverage (DOL) (LG 2; Intermediate)
a. Let QBE = breakeven level of unit sales, FC = fixed cost, P = price, and VC = variable cost per
unit. QBE = FC ÷ (P − VC) = $380,000 ÷ ($63.50 − $16) = 8,000 units.
b.
9,000 Units 10,000 Units 11,000 Units

e
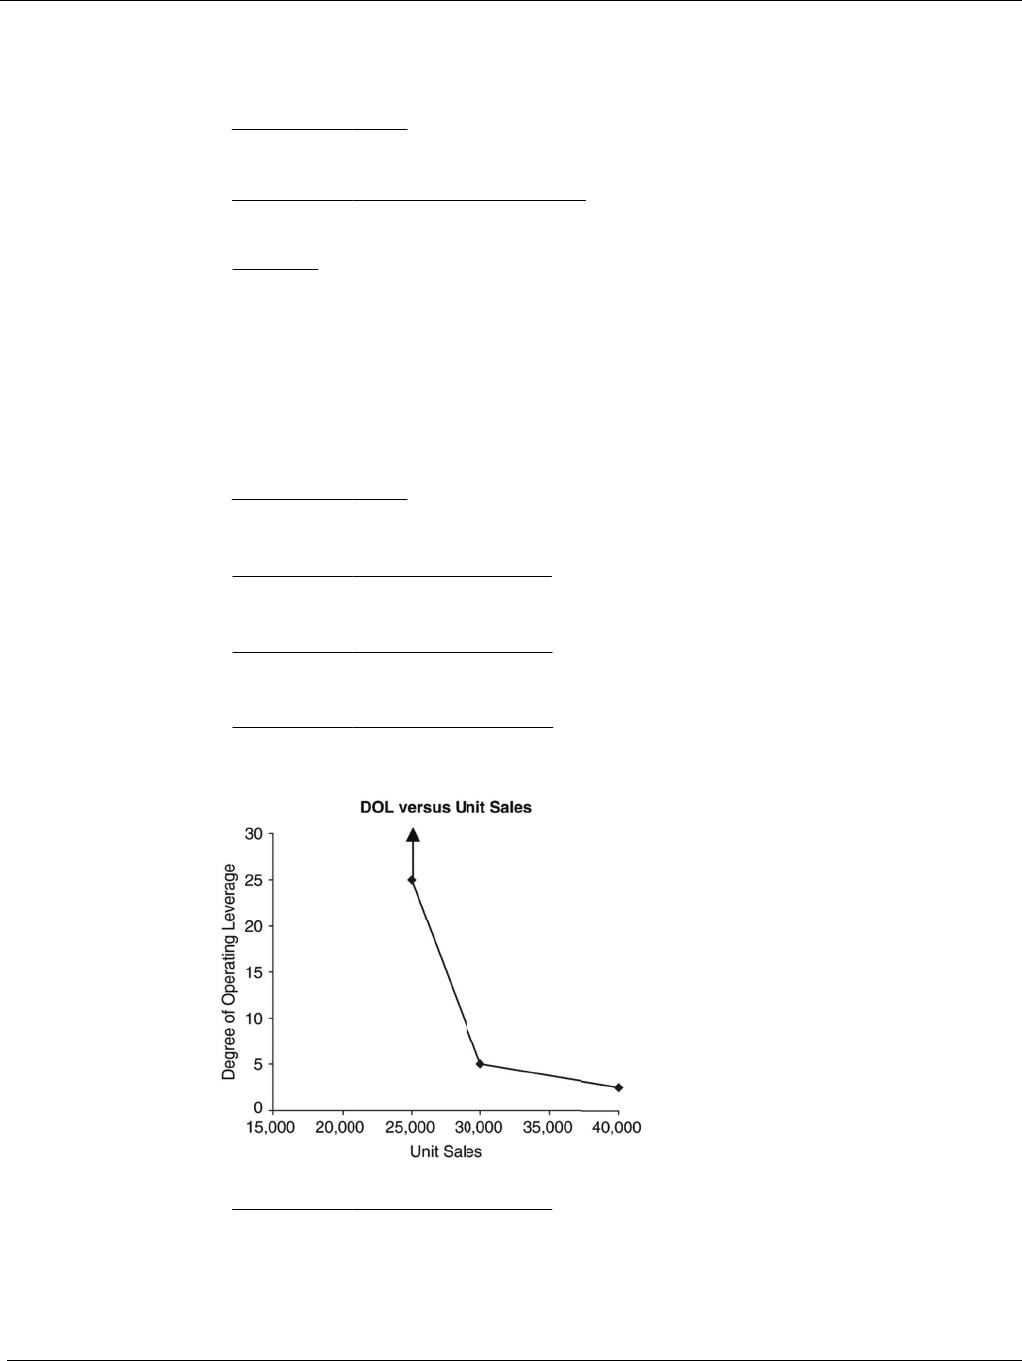
P12-10
D
L
a
b
c
d
e
u
o
D
egree of op
e
L
et Q = unit
s
a
. Breakev
e
b
. Degree
o
c
d
u
o
e
V
e
rating lever
a
s
ales, P = uni
t
e
n sales, Q
BE
o
f operating l
e
×−
[(
QP
V
=
V
e
s
V
a
ge (DOL):
G
t
price, VC =
= FC (P –
e
verage at ba
s
)]
V
C
V
e
s
,
G
raphical (L
G
variable cost
s
VC) = $72,0
0
s
e sales level
,
e
C
,
G
2; Interm
e
s, and FC =
f
0
0 ($9.75
–
,
Q, is given
b
b
e
diate)
f
ixed costs.
–
$6.75) = 24
b
y:
s
,000


P12-11 EPS calculations (LG 2; Intermediate)
a. Common earnings = EBIT – Interest – Taxes – Dividends on preferred stock
= (EBIT – Interest) × (1 – Tax rate) – Preferred dividends
P12-12 Degree of financial leverage (LG 2; Intermediate)
a.
EBIT $80,000 $120,000
Less: Interest 40,000 40,000
N
et profits before taxes $40,000 $ 80,000
N
⎢⎥
⎜⎟
−
⎝⎠
⎣⎦
T = tax rate
$80,000
N
N
==
DFL 1.25

P12-13 Personal finance: Financial leverage (LG 2; Challenge)
a.
Current DFL Initial Values Future Value % ∆
DFL = 18.2% ÷ 10% = 1.82
b. and c.
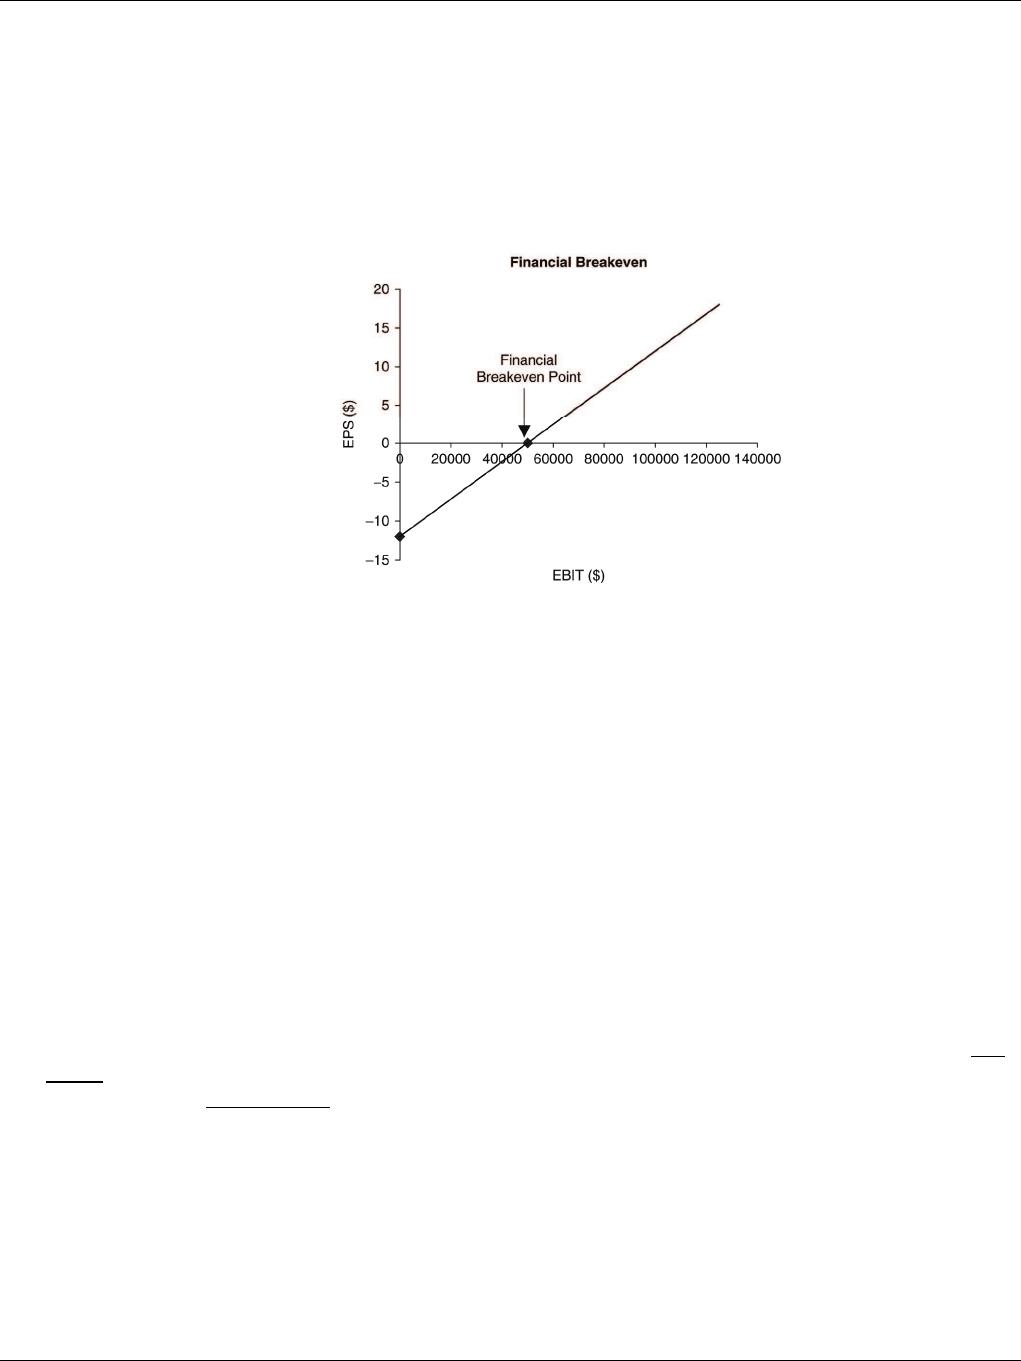
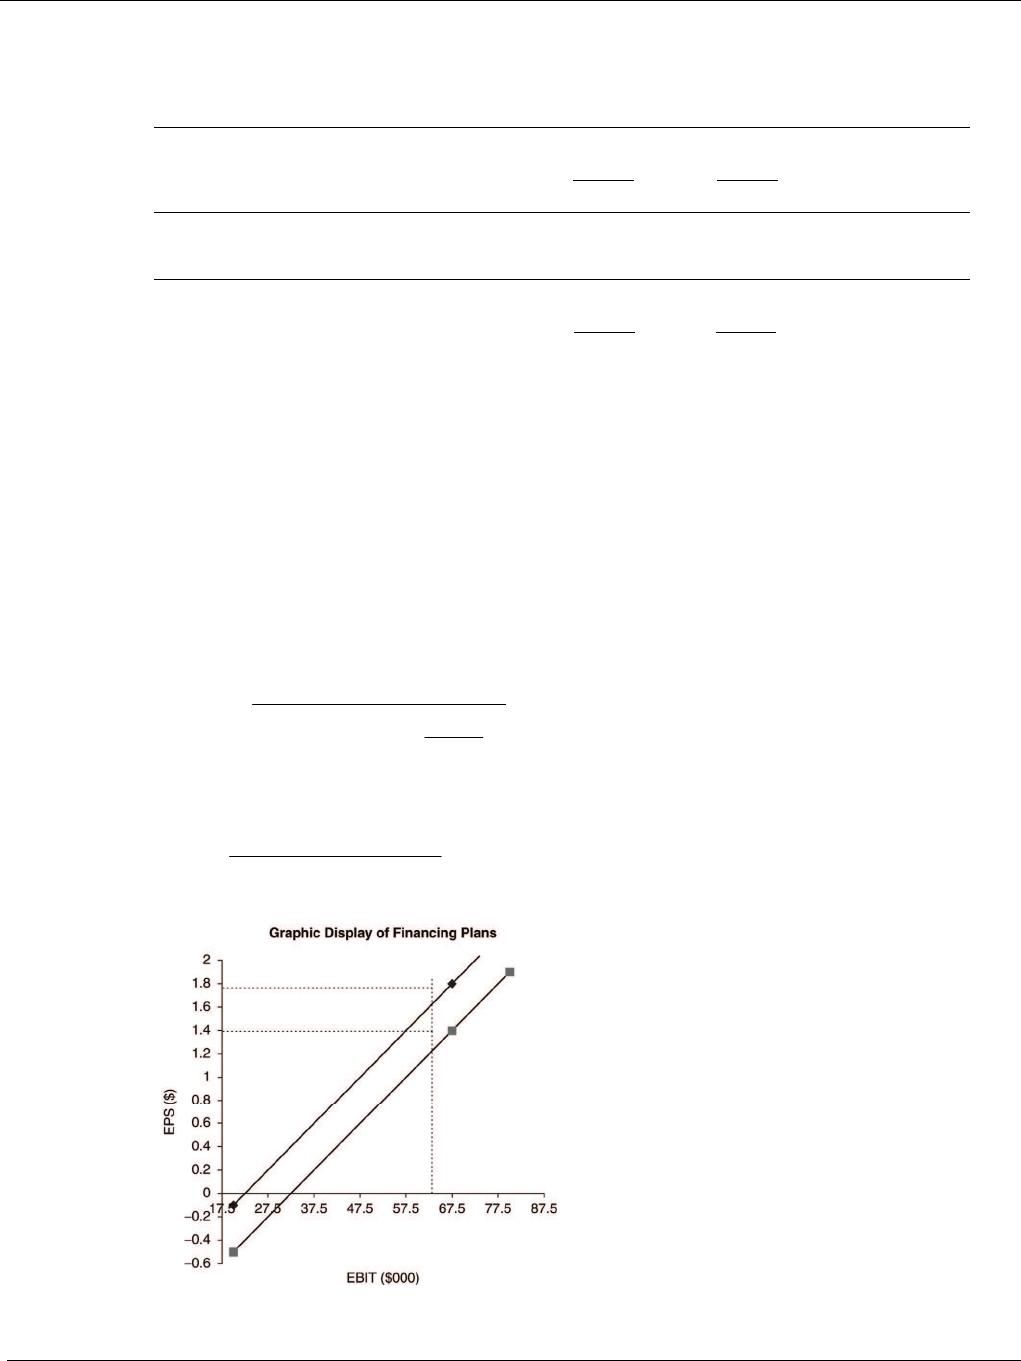
P12-14 DFL and graphic display of financing plans (LG 2, 5; Challenge)
a. Degree of financial leverage (DFL) is given by:
=⎡⎤
EBIT
DFL 1
where:
==
−−
DFL 1.5
[$67,500 $22,500 0]
b.


268 Zutter/Smart • Principles of Managerial Finance Brief, Eighth Edition
$67,500
financing
plan
15,000
−−
P12-15 Integrative: Multiple leverage measures (LG 1, 2; Intermediate)
Let Q = unit sales, P = unit price, VC = variable costs, and FC = fixed costs.
===
×− −
DOL 1.78
[400,000 ($1.00 $0.84)] $28,000 $36,000
c. Earnings before interest and taxes (EBIT) = (P × Q) − FC − (Q × VC)
EBIT = ($1.00 × 400,000) − $28,000 − (400,000 × $0.84) = $36,000
==
⎡⎤
⎛⎞
−−
⎢⎥
⎜⎟
−
DFL 1.35
$2,000
$36,000 $6,000 (1 0.4)
Note: With a 21% tax rate, DFL is 1.31.


===
DTL 2.40
P12-16 Integrative: Leverage and risk (LG 2; Intermediate)
a. Let Q = unit sales, P = unit price, VC = variable costs, and FC = fixed costs.
(
)
()
DOL at base sales level QPVC
QQ P VC FC
×−
=×− −
==
−
DFL 1.71
[$24,000 $10,000]
R
==
−
DFL 1.25
[$87,500 $17,500]
W
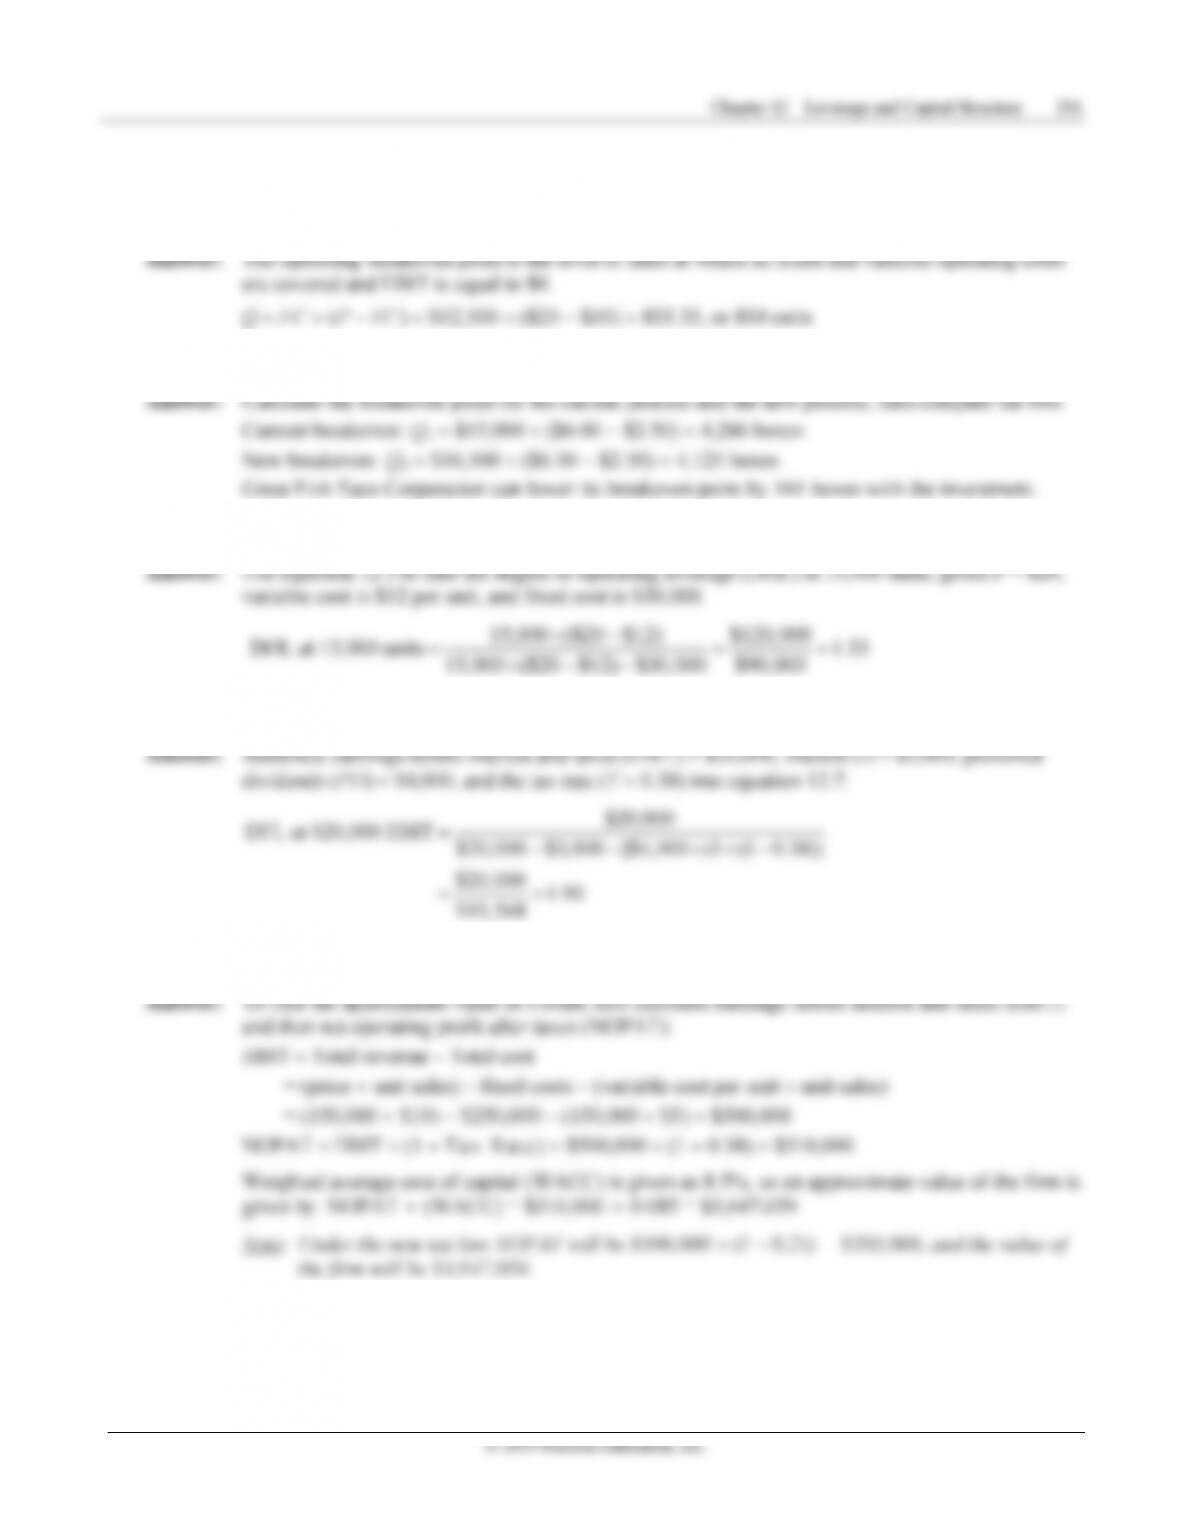
P12-17 Integrative—multiple leverage measures and prediction (LG 1, 2; Challenge)
a. Let Q = unit sales, P = unit price, VC = variable costs, and FC = fixed costs.
QBreakeven = FC ÷ (P − VC) = $50,000 ÷ ($6 − $3.50) = 20,000 latches

270 Zutter/Smart • Principles of Managerial Finance Brief, Eighth Edition
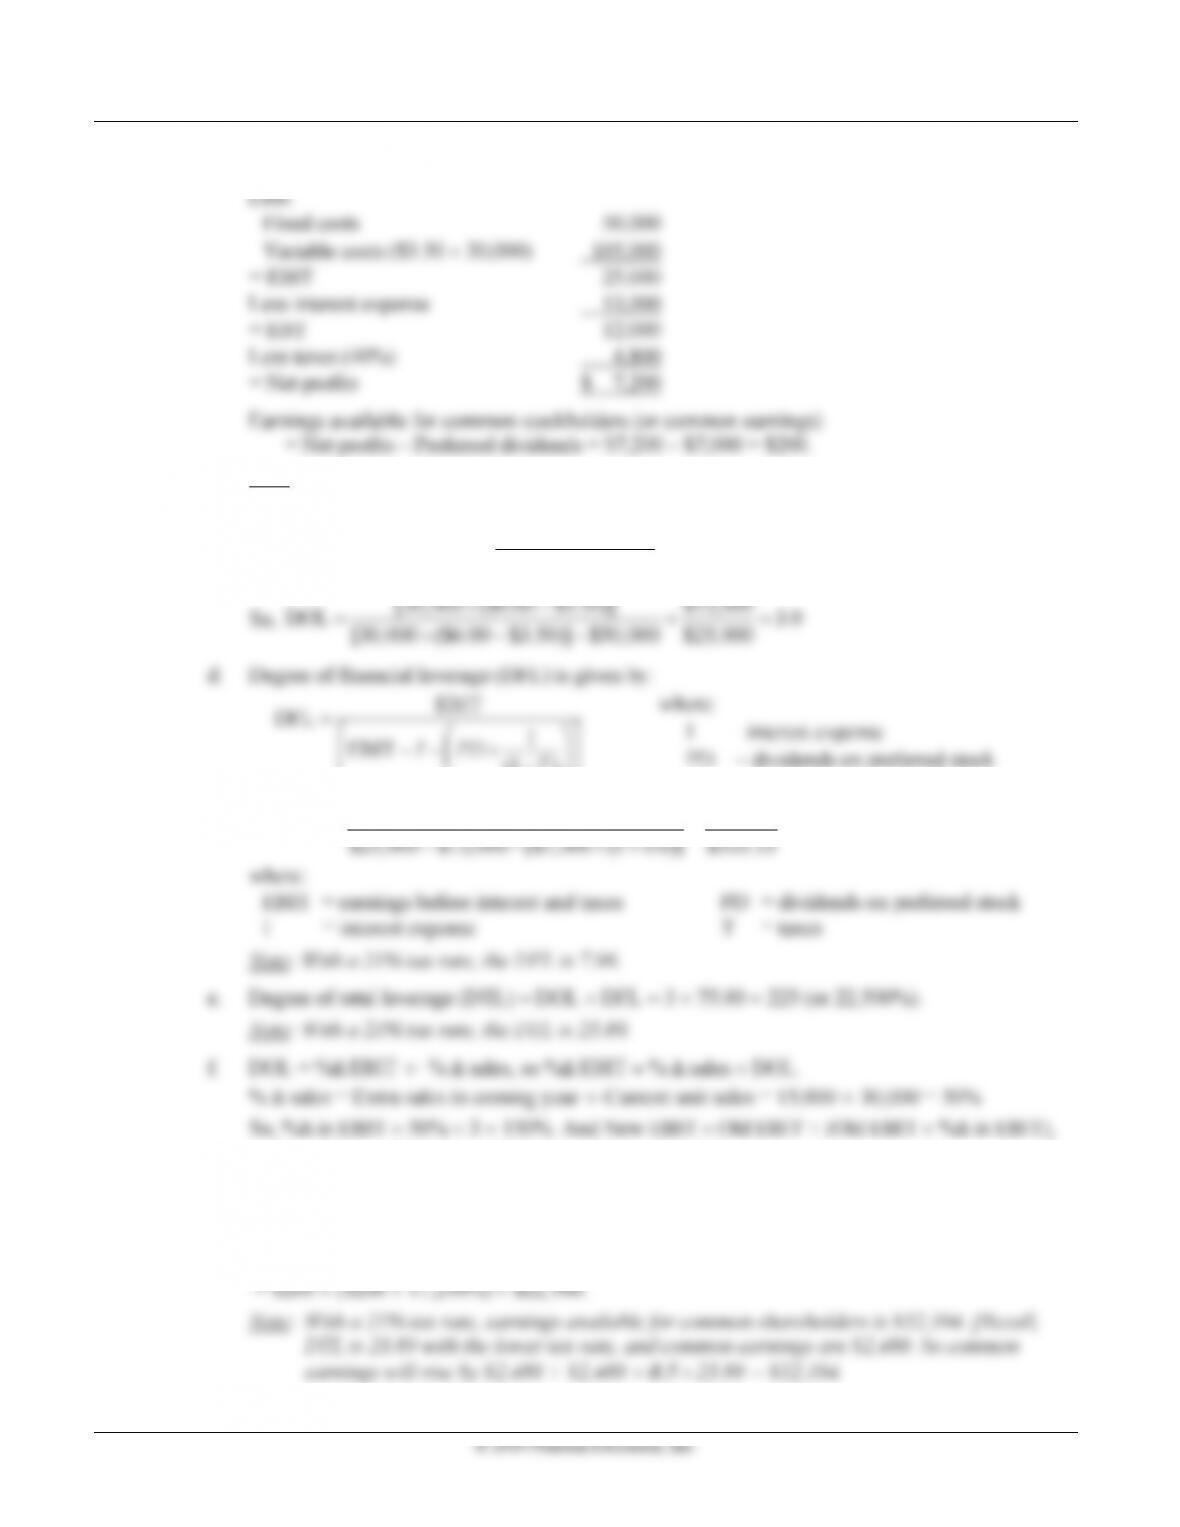
b. Sales ($6 × 30,000) $180,000
Note: If the tax rate is 21% then net profits are $9,480, and earnings available for common
stockholders is $2,480.
c.
(
)
()
DOL at base sales level QPVC
QQ P VC FC
×−
=×− −
−
⎝⎠
⎣⎦
T = tax rate
So, ===
$25,000 $25,000
DFL 75.00
so New EBIT = $25,000 + ($25,000 × 150%) = $62,500.
Now, DTL = %∆ EPS ÷ %∆ in sales = %∆ common earnings ÷ %∆ in sales because outstanding
shares did not change. So, %∆ common earnings = %∆ sales × DTL = 50% × 225% = 11,250%.
And, new common earnings
= Old common earnings + (Old common earnings × %∆ common earnings)