Australia’s Current Account
Australia’s Current Account
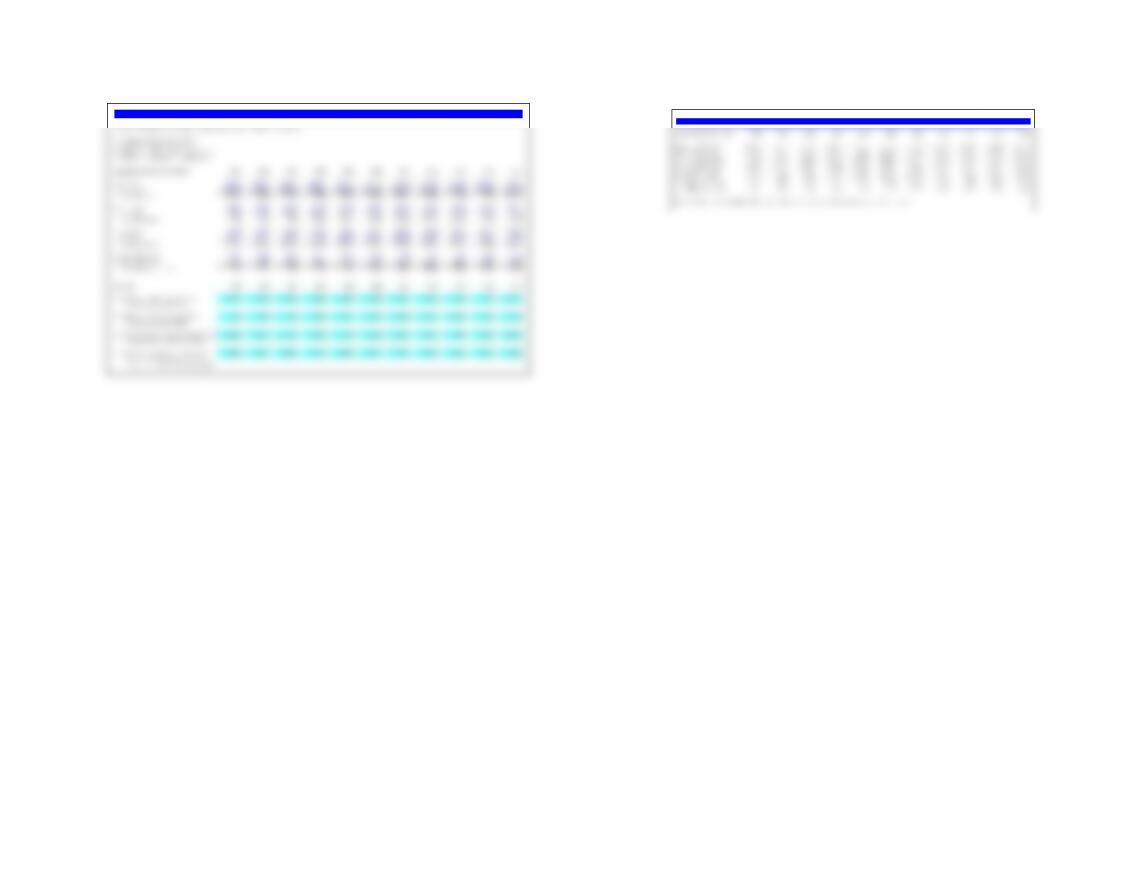
Use the following data from the International Monetary Fund to answer questions 3.1 through 3.4.
Assumptions (million US$) 2005 2006 2007 2008 2009 2010 2011 2012 2013 2014 2015
3.1 What is Australia’s balance on goods?
3.2 What is Australia’s balance on services? Goods, credit (exports) 107,011 124,913 142,421 189,057 154,777 213,782 271,719 257,950 254,180 240,704 188,345
3.3 What is Australia’s balance on goods and services? Goods, debit (imports) -120,383 -134,509 -160,205 -193,972 -159,216 -196,303 -249,238 -270,136 -249,700 -240,252 -207,658
3.4 What is Australia’s current account balance? Services, credit (exports) 31,047 33,088 40,496 45,240 40,814 46,968 51,653 53,034 53,550 54,240 49,716
Services, debit (imports) -30,505 -32,219 -39,908 -48,338 -42,165 -51,313 -61,897 -65,405 -67,977 -63,549 -57,269
Assumptions (millions of US dollars) 2005 2006 2007 2008 2009 2010 2011 2012 2013 2014 2015 Primary income: credit 16,445 21,748 32,655 37,320 27,402 35,711 47,852 47,168 46,316 46,637 38,105
Primary income: debit -44,166 -54,131 -73,202 -76,719 -65,809 -84,646 -102,400 -88,255 -85,289 -79,805 -67,842
Goods: exports 107,011 124,913 142,421 189,057 154,777 213,782 271,719 257,950 254,180 240,704 188,345 Secondary income: credit 3,333 3,698 4,402 4,431 4,997 5,813 7,510 7,271 7,109 6,962 5,853
Goods: imports -120,383 -134,509 –160,205 -193,972 –159,216 -196,303 –249,238 -270,136 –249,700 –240,252 -207,658 Secondary income: debit -3,813 -4,092 -4,690 -4,805 -5,799 -7,189 -9,723 9,635 -9,346 -8,996 -7,685
Balance on goods -13,372 -9,596 -17,784 -4,915 -4,439 17,479 22,481 -12,186 4,480 453 -19,313
Note: The IMF has recently adjusted their line item nomenclature. Exports are all now noted as credits , imports as debits .
Services: credit
31,047 33,088 40,496 45,240 40,814 46,968 51,653 53,034 53,550 54,240 49,716
Services: debit -30,505 -32,219 –39,908 -48,338 –42,165 -51,313 –61,897 -65,405 –67,977 –63,549 -57,269
Balance on services 542 869 588 -3,098 -1,351 -4,345 –10,244 -12,371 –14,427 -9,309 -7,553
Income: credit 16,445 21,748 32,655 37,320 27,402 35,711 47,852 47,168 46,316 46,637 38,105
Income: debit -44,166 -54,131 –73,202 -76,719 –65,809 -84,646 -102,400 -88,255 –85,289 -79,805 –67,842
Balance on income -27,722 -32,383 –40,547 -39,399 –38,407 -48,935 –54,548 -41,087 –38,973 –33,168 -29,736
Current transfers: credit 3,333 3,698 4,402 4,431 4,997 5,813 7,510 7,271 7,109 6,962 5,853
Current transfers: debit -3,813 -4,092 –4,690 -4,805 –5,799 -7,189 –9,723 9,635 -9,346 -8,996 -7,685
Balance on current transfers -480 –394 -288 -374 –802 -1,376 -2,213 16,906 -2,237 -2,034 -1,832
Questions 2005 2006 2007 2008 2009 2010 2011 2012 2013 2014 2015
3.1 What is Australia’s balance on goods? -13,372 -9,596 -17,784 -4,915 -4,439 17,479 22,481 -12,186 4,480 453 -19,313
(goods exports – goods imports)
3.2 What is Australia’s balance on services? 542 869 588 -3,098 -1,351 -4,345 –10,244 -12,371 –14,427 -9,309 -7,553
(services credit – services debit)
3.3 What is Australia’s balance on goods and services?
-12,830 -8,727 -17,196 -8,013 –5,790 13,134 12,237 -24,557 -9,947 –8,856 -26,866
(balance on goods + balance on services)
3.4 What is Australia’s current account balance? -41,032 -41,504 –58,031 -47,786 –44,999 -37,177 –44,524 -48,738 –51,156 –44,059 -58,434
(the sum of the four balances listed above,
goods, services, income, and current transfers)
India’s Current Account
India‘s Current Account
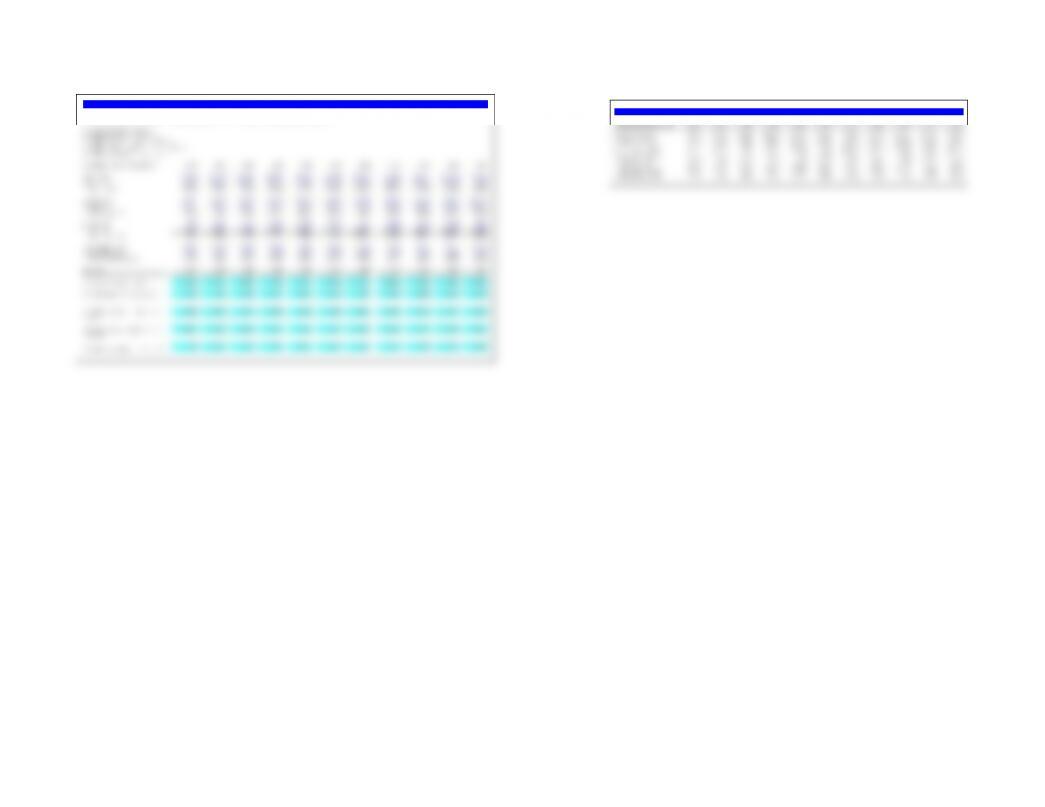
Use the following India balance of payments data from the IMF (all items are for the current account) to answer questions 3.5 through 3.9.
Assumptions (millions of US$) 2004 2005 2006 2007 2008 2009 2010 2011 2012 2013 2014
3.5 What is India‘s balance on goods?
3.6 What is India‘s balance on services? Goods, credit (exports) 77,939 102,175 123,876 153,530 199,065 167,958 230,967 307,847 298,321 319,110 329,633
3.7 What is India‘s balance on goods and services? Goods, debit (imports) -95,539 -134,692 –166,572 -208,611 –291,740 -247,908 –324,320 -428,021 –450,249 -433,760 –415,529
3.8 What is the balance on goods, services and income? Services, credit (exports) 38,281 52,527 69,440 86,552 106,054 92,889 117,068 138,528 145,525 148,649 156,252
3.9 What is India‘s current account balance? Services, debit (imports) -35,641 -47,287 -58,514 -70,175 -87,739 -80,349 -114,739 –125,041 -129,659 –126,256 -137,597
Primary income: credit 4,690 5,646 8,199 12,650 15,593 13,733 9,961 10,147 9,899 11,230 11,004
Assumptions (millions of US dollars) 2004 2005 2006 2007 2008 2009 2010 2011 2012 2013 2014 Primary income: debit -8,742 -12,296 -14,445 -19,166 -20,958 -21,272 -25,563 -26,191 -30,742 -33,013 -36,818
Secondary income: credit 20,615 24,512 30,015 38,885 52,065 50,526 54,380 62,735 68,611 69,441 69,786
Goods: exports 77,939 102,175 123,876 153,530 199,065 167,958 230,967 307,847 298,321 319,110 329,633 Secondary income: debit –822 -869 -1,299 -1,742 –3,313 -1,764 –2,270 -2,523 –3,176 -4,626 -4,183
Goods: imports -95,539 -134,692 -166,572 -208,611 -291,740 -247,908 -324,320 -428,021 -450,249 -433,760 -415,529
Balance on goods -17,600 -32,517 –42,696 –55,081 -92,675 -79,950 -93,353 -120,174 –151,928 -114,650 -85,895
Services: credit 38,281 52,527 69,440 86,552 106,054 92,889 117,068 138,528 145,525 148,649 156,252
Services: debit -35,641 -47,287 -58,514 -70,175 -87,739 -80,349 -114,739 -125,041 -129,659 -126,256 -137,597
Balance on services 2,640 5,241 10,926 16,377 18,315 12,540 2,329 13,487 15,866 22,393 18,656
Income: credit 4,690 5,646 8,199 12,650 15,593 13,733 9,961 10,147 9,899 11,230 11,004
Income: debit -8,742 -12,296 -14,445 –19,166 –20,958 -21,272 -25,563 -26,191 -30,742 -33,013 -36,818
Balance on income -4,052 -6,650 -6,245 –6,516 -5,365 -7,539 -15,602 -16,044 -20,843 -21,783 -25,815
Current transfers: credit 20,615 24,512 30,015 38,885 52,065 50,526 54,380 62,735 68,611 69,441 69,786
Current transfers: debit -822 -869 -1,299 –1,742 -3,313 -1,764 -2,270 -2,523 -3,176 –4,626 -4,183
Balance on current transfers 19,793 23,643 28,716 37,143 48,752 48,762 52,110 60,212 65,435 64,815 65,603
Questions 2004 2005 2006 2007 2008 2009 2010 2011 2012 2013 2014
3.5 What is India‘s balance on goods? -17,600 -32,517 –42,696 –55,081 -92,675 -79,950 -93,353 -120,174 -151,928 -114,650 -85,895
3.6 What is India‘s balance on services? 2,640 5,241 10,926 16,377 18,315 12,540 2,329 13,487 15,866 22,393 18,656
-14,960 -27,276 –31,770 –38,704 -74,360 -67,410 -91,024 -106,687 -136,062 -92,257 –67,240
-19,012 -33,926 –38,015 –45,220 -79,725 -74,949 -106,626 -122,731 -156,905 -114,040 -93,054
780 -10,283 -9,299 –8,077 –30,973 -26,187 -54,516 -62,519 -91,470 -49,225 -27,452
3.7 What is India‘s balance on goods and
services?
3.8 What is the balance on goods, services
and income?
3.9 What is India‘s current account balance?
China’s (Mainland) Balance of Payments
China’s (Mainland) Balance of Payments
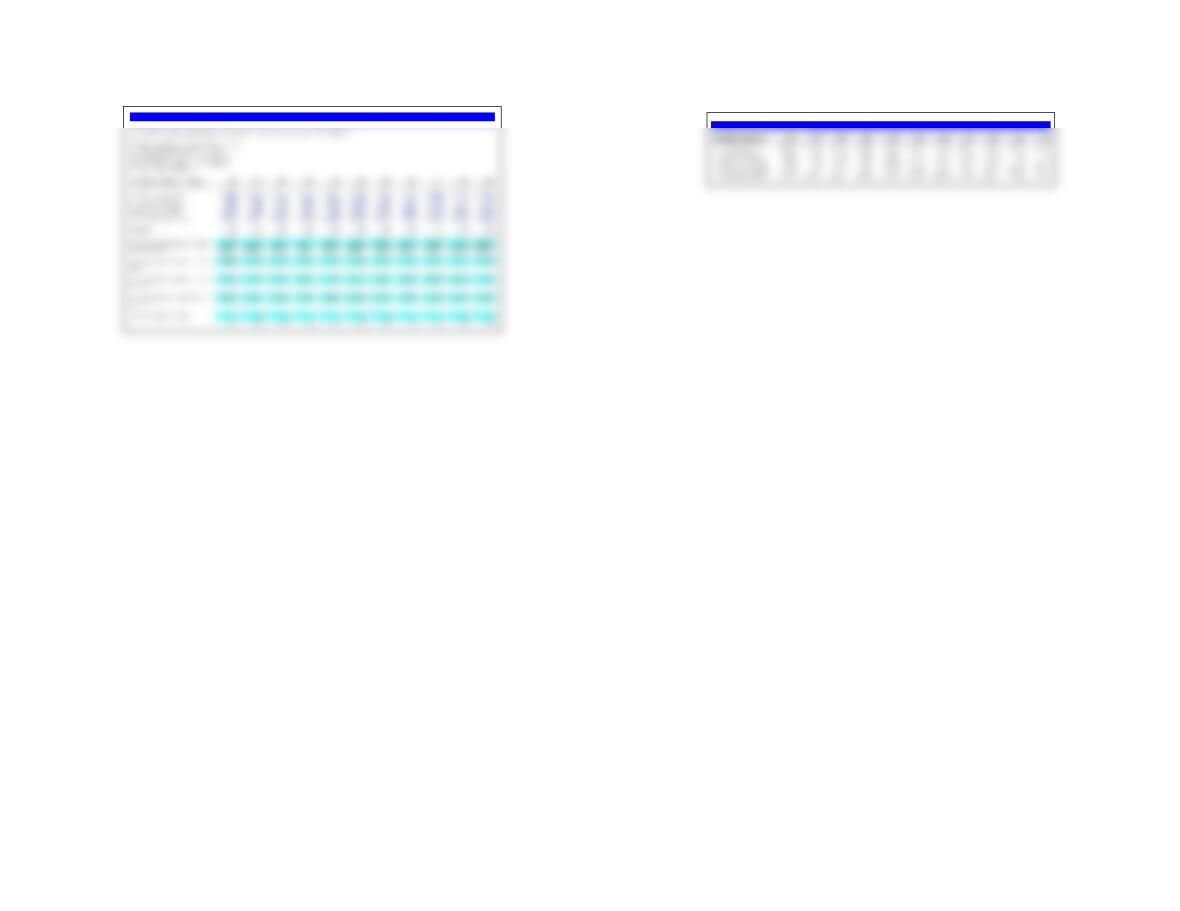
Use the following Chinese (Mainland) balance of payments data from the IMF to answer questions 3.10 through 3.13.
Assumptions (million US$) 2005 2006 2007 2008 2009 2010 2011 2012 2013 2014 2015
3.10 Is China experiencing a net capital inflow or outflow?
3.11 What is China‘s Total for Groups A and B? A. Current account balance 134,082 231,844 353,183 420,569 243,257 237,810 136,097 215,392 148,204 277,434 330,602
3.12 What is China‘s Total for Groups A through C? B. Capital account balance 4,102 4,020 3,099 3,051 3,938 4,630 5,446 4,272 3,052 -33 316
3.13 What is China‘s Total for Groups A through D? C. Financial account balance 96,944 45,285 91,132 37,075 194,494 282,234 260,024 -36,038 343,048 -51,361 -485,614
3.14 Does China’s BOP balance? D. Net errors and omissions 15,847 3,502 13,237 18,859 -41,181 –53,016 –13,768 –87,071 -62,922 -108,257 -188,245
E. Reserves and related items -250,975 -284,651 -460,651 -479,554 -400,508 -471,658 -387,799 -96,555 -431,382 -117,784 342,941
Assumptions (millions of US dollars) 2005 2006 2007 2008 2009 2010 2011 2012 2013 2014 2015
A. Current account balance 134,082 231,844 353,183 420,569 243,257 237,810 136,097 215,392 148,204 277,434 330,602
B. Capital account balance 4,102 4,020 3,099 3,051 3,938 4,630 5,446 4,272 3,052 -33 316
C. Financial account balance 96,944 45,285 91,132 37,075 194,494 282,234 260,024 -36,038 343,048 -51,361 -485,614
D. Net errors and omissions 15,847 3,502 13,237 18,859 -41,181 –53,016 –13,768 -87,071 -62,922 -108,257 -188,245
E. Reserves and related items -250,975 -284,651 -460,651 –479,554 –400,508 -471,658 -387,799 -96,555 –431,382 –117,784 342,941
Questions 2005 2006 2007 2008 2009 2010 2011 2012 2013 2014 2015
101,046 49,305 94,231 40,126 198,432 286,864 265,470 -31,766 346,100 –51,394 –485,298
“inflow” “inflow” “inflow” “inflow” “inflow” “inflow” “inflow“ “outflow” “inflow“ “outflow“ “outflow“
138,184 235,864 356,282 423,620 247,195 242,440 141,543 219,664 151,256 277,401 330,918
235,128 281,149 447,414 460,695 441,689 524,674 401,567 183,626 494,304 226,040 -154,696
250,975 284,651 460,651 479,554 400,508 471,658 387,799 96,555 431,382 117,784 -342,941
3.14 Does China‘s BOP balance? 00000000000
Yes Yes Yes Yes Yes Yes Yes Yes Yes Yes Yes
3.10 Is China experiencing a net capital
inflow or outflow?
3.11 What is China‘s Total for Groups A
and B?
3.12 What is China‘s Total for Groups A
through C?
3.13 What is China‘s Total for Groups A
through D?
Russia‘s Balance of Payments
Russia’a (Russian Federation‘s) Balance of Payments
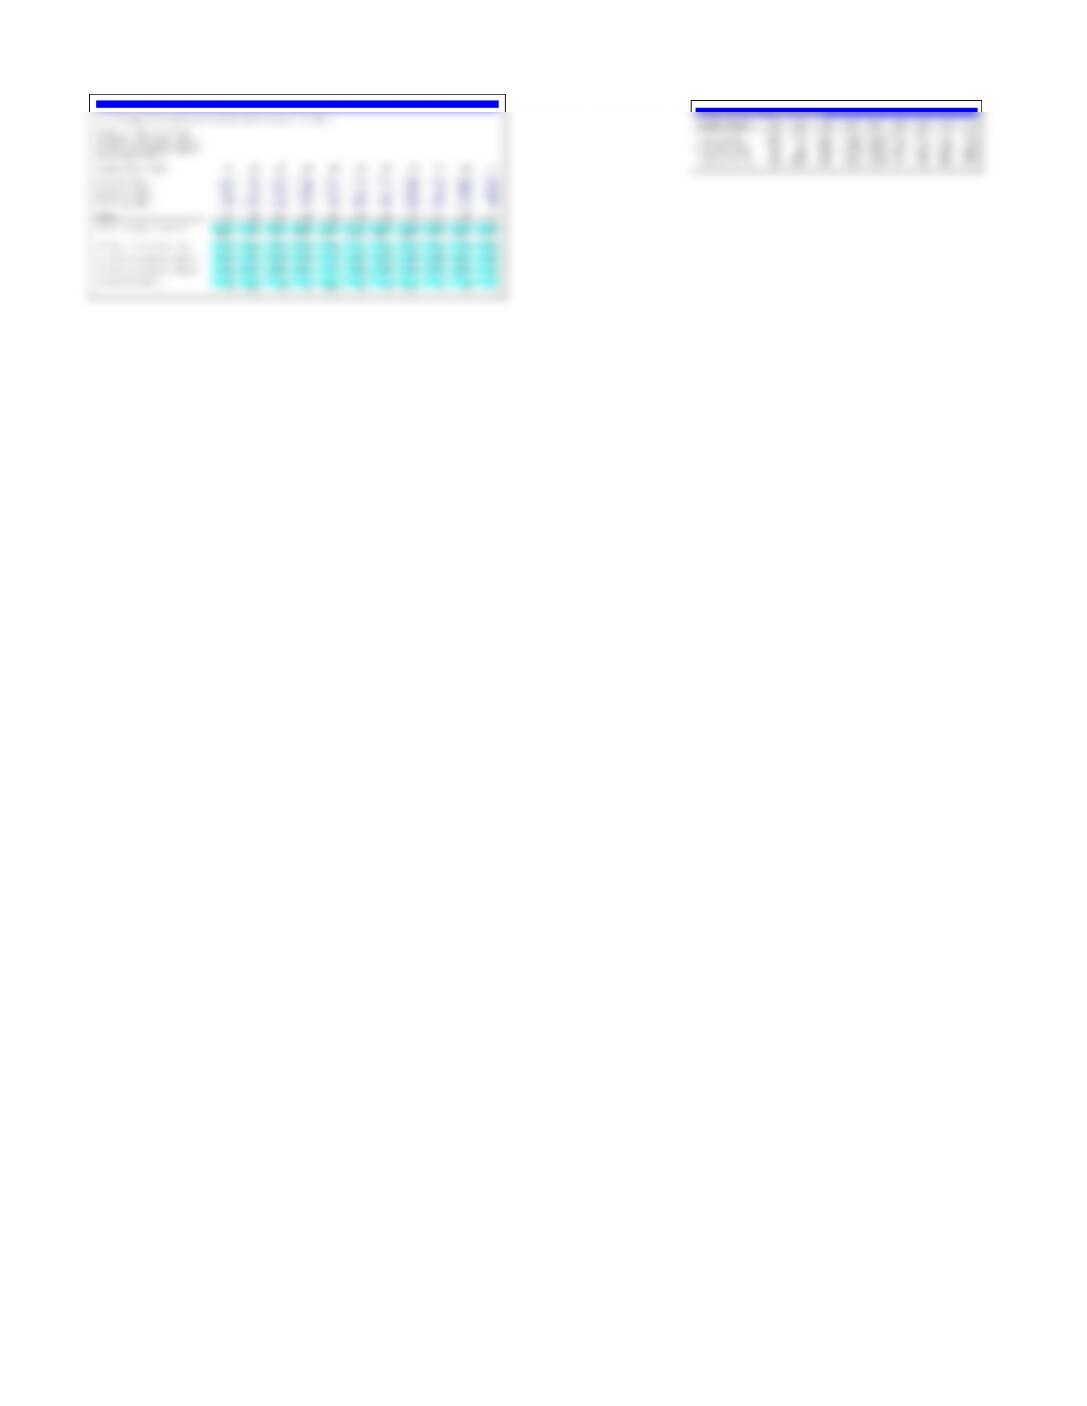
Use the following Russian (Russian Federation) balance of payments data from the IMF to answer questions 3.14 through 3.17.
Assumptions (million US$) 2005 2006 2007 2008 2009 2010 2011 2012 2013
3.15 Is Russia experiencing a net capital inflow?
3.16 What is Russia’s Total for Groups A and B? A. Current account balance 84,602 92,316 72,193 103,935 0 50,384 0 67,452 97,274 71,282 33,428
3.17 What is Russia’s Total for Groups A through C? B. Capital account balance -12,764 291 -10,641 –104 0 -12,466 0 -41 130 -5,218 –395
3.18 What is Russia’s Total for Groups A through D? C. Financial account balance 1,025 3,612 97,108 -139,705 0 –28,162 0 -21,526 -76,115 -25,675 -46,213
3.19 Does Russia’s BOP balance? D. Net errors and omissions –7,895 11,248 –9,732 –3,045 0 -6,392 0 -9,135 -8,651 -10,370 -8,898
E. Reserves and related items -64,968 -107,466 -148,928 38,919 0 -3,363 0 -36,750 -12,638 -30,020 22,078
Assumptions (millions of US dollars) 2005 2006 2007 2008 2009 2010 2011 2012 2013 2014 2015
A. Current account balance 84,602 92,316 72,193 103,935 50,384 67,452 97,274 71,282 33,428 57,513 69,000
B. Capital account balance -12,764 291 -10,641 -104 -12,466 -41 130 -5,218 -395 -42,005 -309
C. Financial account balance 1,025 3,612 97,108 -139,705 -28,162 -21,526 -76,115 -25,675 -46,213 –131,049 -70,852
D. Net errors and omissions -7,895 11,248 -9,732 -3,045 -6,392 -9,135 –8,651 -10,370 -8,898 7,995 3,864
E. Reserves and related items -64,968 -107,466 -148,928 38,919 -3,363 -36,750 -12,638 -30,020 22,078 107,546 -1,702
Questions 2005 2006 2007 2008 2009 2010 2011 2012 2013 2014 2015
3.15 Is Russia experiencing a net capital inflow? -11,739 3,903 86,467 –139,809 -40,628 -21,567 -75,985 -30,893 -46,608 –173,054 -71,162
“outflow” “inflow” “inflow” “outflow” “outflow” “outflow” “outflow” “outflow” “outflow” “outflow” “outflow”
3.16 What is Russia’s Total for Groups A and B? 71,838 92,607 61,552 103,831 37,918 67,411 97,404 66,064 33,033 15,508 68,691
3.17 What is Russia’s Total for Groups A through C? 72,863 96,219 158,660 -35,874 9,756 45,885 21,289 40,389 -13,180 -115,541 -2,162
3.18 What is Russia’s Total for Groups A through D? 64,968 107,467 148,928 -38,919 3,364 36,750 12,638 30,019 -22,078 -107,546 1,702
3.19 Does Russia’s BOP balance? 0 1 0 0 1 0 0 -1 0 0 0
Yes Nearly Yes Yes Nearly Yes Yes Nearly Yes Yes Yes
Iceland Balance of Payments
Iceland Balance of Payments
Iceland Balance of Payments. Use the following Iceland balance of payments data from the IMF to answer questions 3.18 through 3.21.
Assumptions (billion US$) 2008 2009 2010 2011 2012 2013 2014 2015
3.20 Is Iceland experiencing a net capital inflow?
3.21 What is Iceland’s Total for Groups A and B? A. Current account balance -4,149 -669 -308 -605 -937 888 616 709
3.22 What is Iceland’s Total for Groups A through C? B. Capital account balance -12 -11 -11 -13 -10 -11 -14 -11
3.23 What is Iceland’s Total for Groups A through D? C. Financial account balance 7,367 -21,039 -11,967 -7,348 1,047 -942 3,010 70,111
3.24 Does Iceland‘s BOP balance? D. Net errors and omissions -4,619 6,571 2,263 2,839 –1,091 197 -23 368
E. Reserves and related items 1,413 15,148 10,023 5,127 991 -132 -3,588 -71,177
Assumptions (billions of US dollars) 2008 2009 2010 2011 2012 2013 2014 2015
A. Current account balance -4,149 -669 -308 -605 -937 888 616 709
B. Capital account balance -12 -11 -11 -13 -10 -11 -14 -11
C. Financial account balance 7,367 –21,039 -11,967 -7,348 1,047 -942 3,010 70,111
D. Net errors and omissions -4,619 6,571 2,263 2,839 –1,091 197 -23 368
E. Reserves and related items 1,413 15,148 10,023 5,127 991 -132 -3,588 –71,177
Questions 2008 2009 2010 2011 2012 2013 2014 2015
3.20 Is Iceland experiencing a net capital inflow? 7,356 –21,050 -11,978 -7,361 1,037 -952 2,996 70,100
“inflow” “outflow“ “outflow” “outflow“ “inflow” “outflow“ “inflow“ “inflow“
3.21 What is Iceland’s Total for Groups A and B? -4,161 -680 -320 -618 -947 877 602 698
3.22 What is Iceland’s Total for Groups A through C? 3,206 –21,719 -12,286 -7,966 100 -65 3,612 70,809
3.23 What is Iceland’s Total for Groups A through D? -1,413 –15,148 –10,023 -5,127 -991 132 3,588 71,177
3.24 Does Iceland‘s BOP balance? 0 0 0 0 0 0 0 0
Yes Yes Yes Yes Yes Yes Yes Yes

Assumptions Values
Initial spot exchange rate, $/fc 2.00
Price of exports, dollars ($) 20.0000
Price of imports, foreign currency (fc) 12.0000
Quantity of exports, units 100
Quantity of imports, units 120
Percentage devaluation of the dollar 18.00%
Price elasticity of demand, imports (0.900)
a. What is the pre-devaluation trade balance?
Revenues from exports, $ $2,000
Expenditures on imports, fc 1,440
Expenditures on imports, $ $2,880
Pre-devaluation trade balance ($880)
b. Resulting trade balance immediately after devaluation?
Revenues from exports, $ $2,000
Expenditures on imports, fc 1,440
New spot exchange rate, after devaluation 2.36
Expenditures on imports, $ $3,398
Post-devaluation trade balance (currency contract period) ($1,398)
Problem 3.22 Trade Deficits and J-Curve Adjustment Paths
Assume the United States has the following import/export volumes and prices. It undertakes a
major “devaluation” of the dollar, say 18% on average against all major trading partner
currencies. What is the pre-devaluation and post-devaluation trade balance?