8
C H A P T E R
Location Strategies
DISCUSSION QUESTIONS
1. FedEx’s key location concept is the central hub concept, with
Memphis selected for several reasons, including its being in the
middle of the country and having very few hours of bad weather
closures.
LO 8.1: Identify and explain seven major factors that affect loca-
tion decisions
AACSB: Application of knowledge
2. The major reason for U.S. firms to locate overseas is often
LO 8.1: Identify and explain seven major factors that affect loca-
tion decisions
5. Different weights can be given to different factors. Personal
preferences are included. For example, if management wants to
locate where cultural attractions abound, it can load that factor,
which will bias against most small towns.
◼ Wage rates
◼ Productivity
◼ Transportation costs
◼ Language
◼ Tariffs
◼ Taxes
◼ Attitude toward foreign investors/incentives
◼ Legal system
◼ Ethical standards
◼ Cultural issues
◼ Proximity to raw materials/customers
◼ Land/construction costs
LO 8.1: Identify and explain seven major factors that affect loca-
tion decisions
AACSB: Application of knowledge
10. Franchise operations may add new units per year; Exxon,
122 CHAPTER 8 LO CAT I ON ST R A T E G I E S
12. The center-of-gravity method assumes that cost is directly
proportional to both distance and volume shipped. For service
facilities, revenue is assumed to be directly proportional to prox-
imity to markets.
LO 8.5: Use the center-of-gravity method
13. Locational break-even analysis has three steps:
◼ Step 1: Determine fixed and variable cost for each location.
LO 8.2: Compute labor productivity
16. Service location techniques: regression models to determine
importance of various factors, factor rating method, traffic counts,
demographic analysis of drawing area, purchasing power analysis of
area, center–of–gravity method, and geographic information system.
LO 8.6: Understand the differences between service- and indus-
trial-sector location analysis
17. The distributor is more concerned with transportation and
ETHICAL DILEMMA
Location is a major issue in the U.S. today. Almost every
community is seeking new jobs, especially from foreign firms like
Mercedes. As Mercedes was definitely coming to the U.S. any–
way, the bidding wars are nonproductive from a central economy
perspective. There are many implications to the local citizenry,
especially because they pay the bills if the financial successes
predicted are not accurate. Votes are usually not taken as these
3. Observe the graph. If the number of shipments from New
York doubles, how does this affect the center of gravity?
The center of gravity moves north and east.
4. The center of gravity does not necessarily find the site with
the minimum total weighted distance. Use the scrollbars to move
the trial location and see if you can improve (lower) the distance.
64, 97 (with a total weighted distance of 299,237).
5. If you have Solver set up in Excel, from Excel’s main menu,
CHAPTER 8 LOC AT I ON ST R A T EGI E S 123
8.2 Myanmar $0.45 + $1.50 = $1.95
China $0.44 + $1.00 = $1.44
Montana $1.20 + $0.25 = $1.45
China is most favorable, but Montana is almost tied.
8.3 Thailand: 2,000 baht/200 = 10 baht/unit,
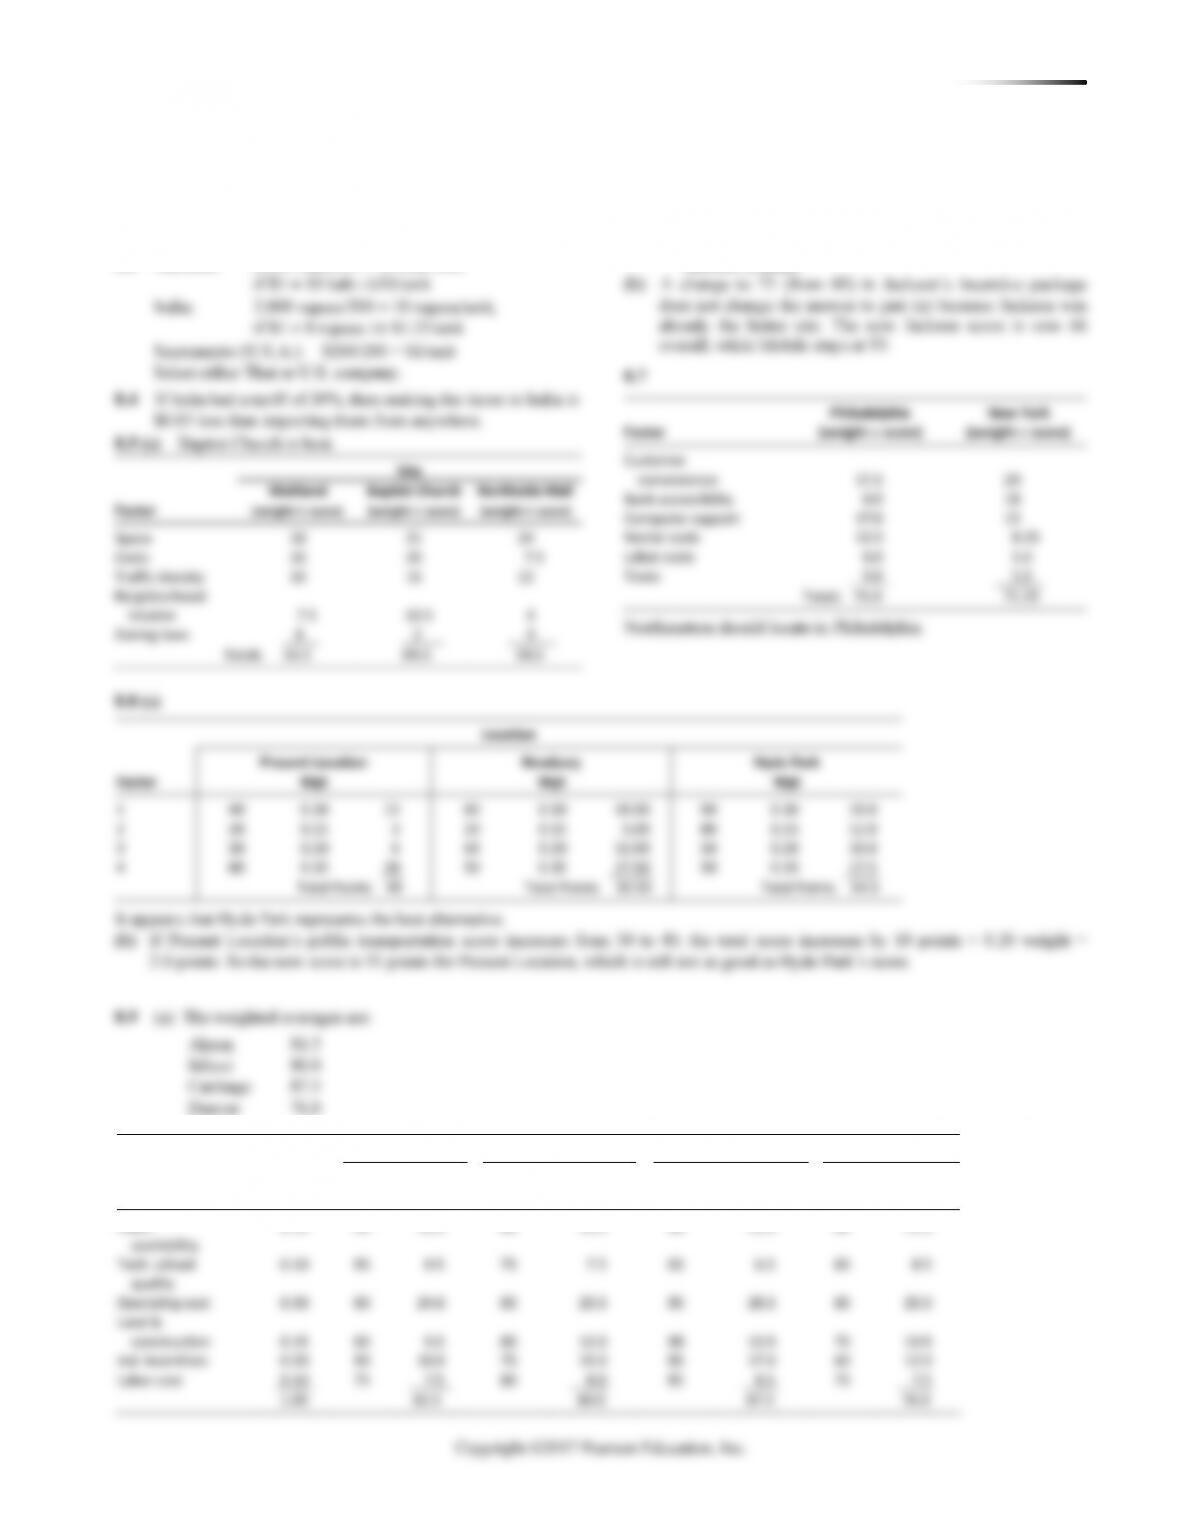
(b) The totals are now Maitland, 52.5; Baptist Church, 70.5; and
Northside Mall, 56.5. Baptist Church’s location is even more preferred.
8.6 (a) Mobile = 0.4(80) + 0.3(20) + 0.2(40) + 0.1(70) = 53
Jackson = 0.4(60) + 0.3(50) + 0.2(90) + 0.1(30) = 60
Jackson is better.
124 CHAPTER 8 LO CAT I ON ST R A T E G I E S
(b) Carthage is preferred (87.5 points) in the initial scenario.
Tech. school
0.10
95
75
65
85
quality
Operating cost
construction
Ind. incentives
Labor cost
0.30
75
22.5
80
24.0
85
25.5
75
22.5
8.10 (a)
Location A
Factor
Weight
Rating
Weighted Score
1
2
3
4
5
6
1
2
3
4
5
6
Factor
Weight
Rating
Weighted Score
1
2
3
4
5
6
Technology
0.2
Level of education
0.1
Political/legal
1.2
Social
Economic
0.2
Note that raw weights were used in computing these
weighted scores (we just multiplied “weight” times “rating”).
Relative weights could have been used instead by taking each
factor weight and dividing by the sum of the weights (i.e., 19).
Akron
Biloxi
Carthage
Denver
Factor
Weight
Score
Weight
Score
Score
Weight
Score
Score
Weight
Score
Score
Weight
Score
Labor
0.15
90
13.5
80
12.0
90
13.5
80
12.0
availability
Denver 74.0
CHAPTER 8 LOC AT I ON ST R A T EGI E S 125
8.12 (a) Given the factors and weightings presented, the
following table suggests that Great Britain be selected:
Factor
Weight
The
Netherlands
Great
Britain
Italy
Belgium
Greece
1
Stability of
0.2
1.0
1.0
0.6
1.0
0.8
government
2
Degree to
0.2
0.8
1.0
0.6
0.8
0.6
which the
population can
converse in
English
3
Stability of
0.1
0.5
0.4
0.3
0.4
0.3
the monetary
system
4
Communications
0.1
0.4
0.5
0.3
0.4
0.3
infrastructure
5
Transportation
0.1
0.5
0.5
0.3
0.5
0.3
infrastructure
6
Availability of
0.1
0.3
0.4
0.5
0.3
0.5
historic/
cultural sites
7
Import
0.1
0.4
0.4
0.3
0.4
0.4
restrictions
8
Availability of
0.1
0.4
0.4
0.3
0.4
0.3
suitable
quarters
1.00
4.3
4.6
3.2
4.2
3.5
(b) If English is not an issue, as illustrated in the following
table, Great Britain, The Netherlands, and Belgium
should all be considered further:
Factor
Weight
The
Netherlands
Great
Britain
Italy
Belgium
Greece
1
Stability of
0.2
1.0
1.0
0.6
1.0
0.8
government
3
Stability of the
0.1
0.5
0.4
0.3
0.4
0.3
monetary
system
4
Communications
0.1
0.4
0.5
0.3
0.4
0.3
infrastructure
5
Transportation
0.1
0.5
0.5
0.3
0.5
0.3
infrastructure
6
Availability of
0.1
0.3
0.4
0.5
0.3
0.5
historic/
cultural sites
7
Import
0.1
0.4
0.4
0.3
0.4
0.4
restrictions
8
Availability of
0.1
0.4
0.4
0.3
0.4
0.3
suitable
quarters
0.8
3.5
3.6
2.6
3.4
2.9
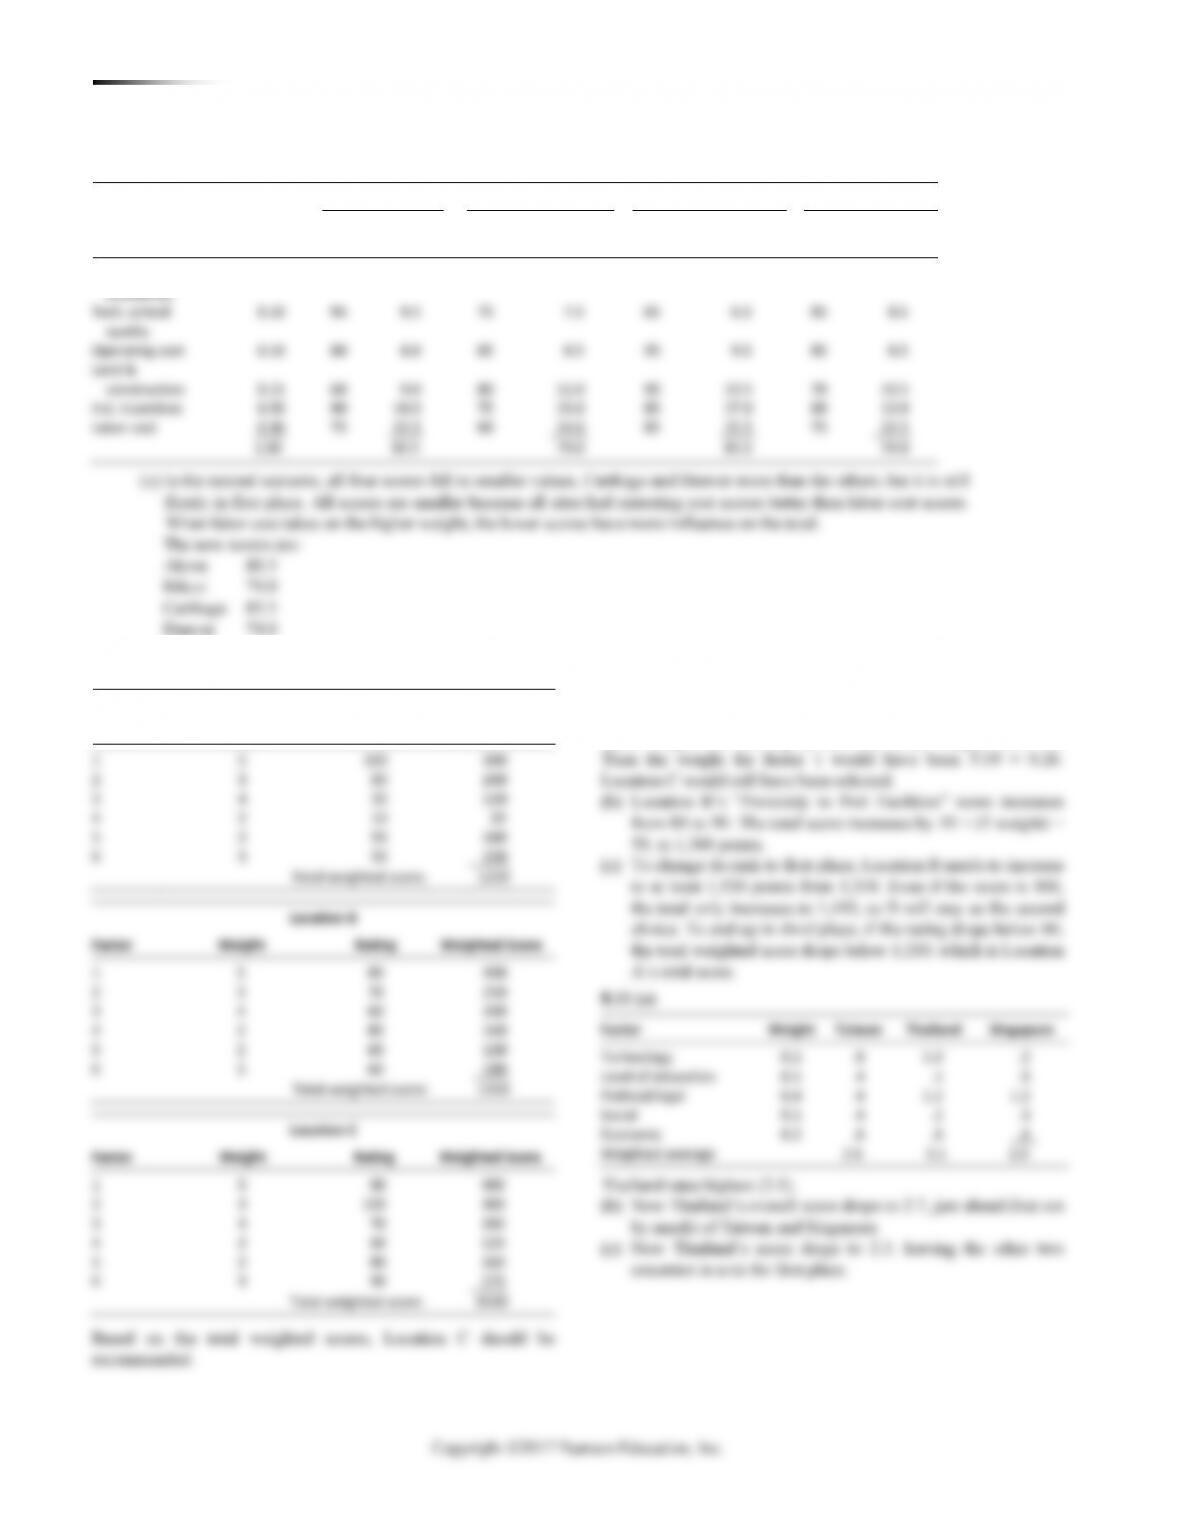
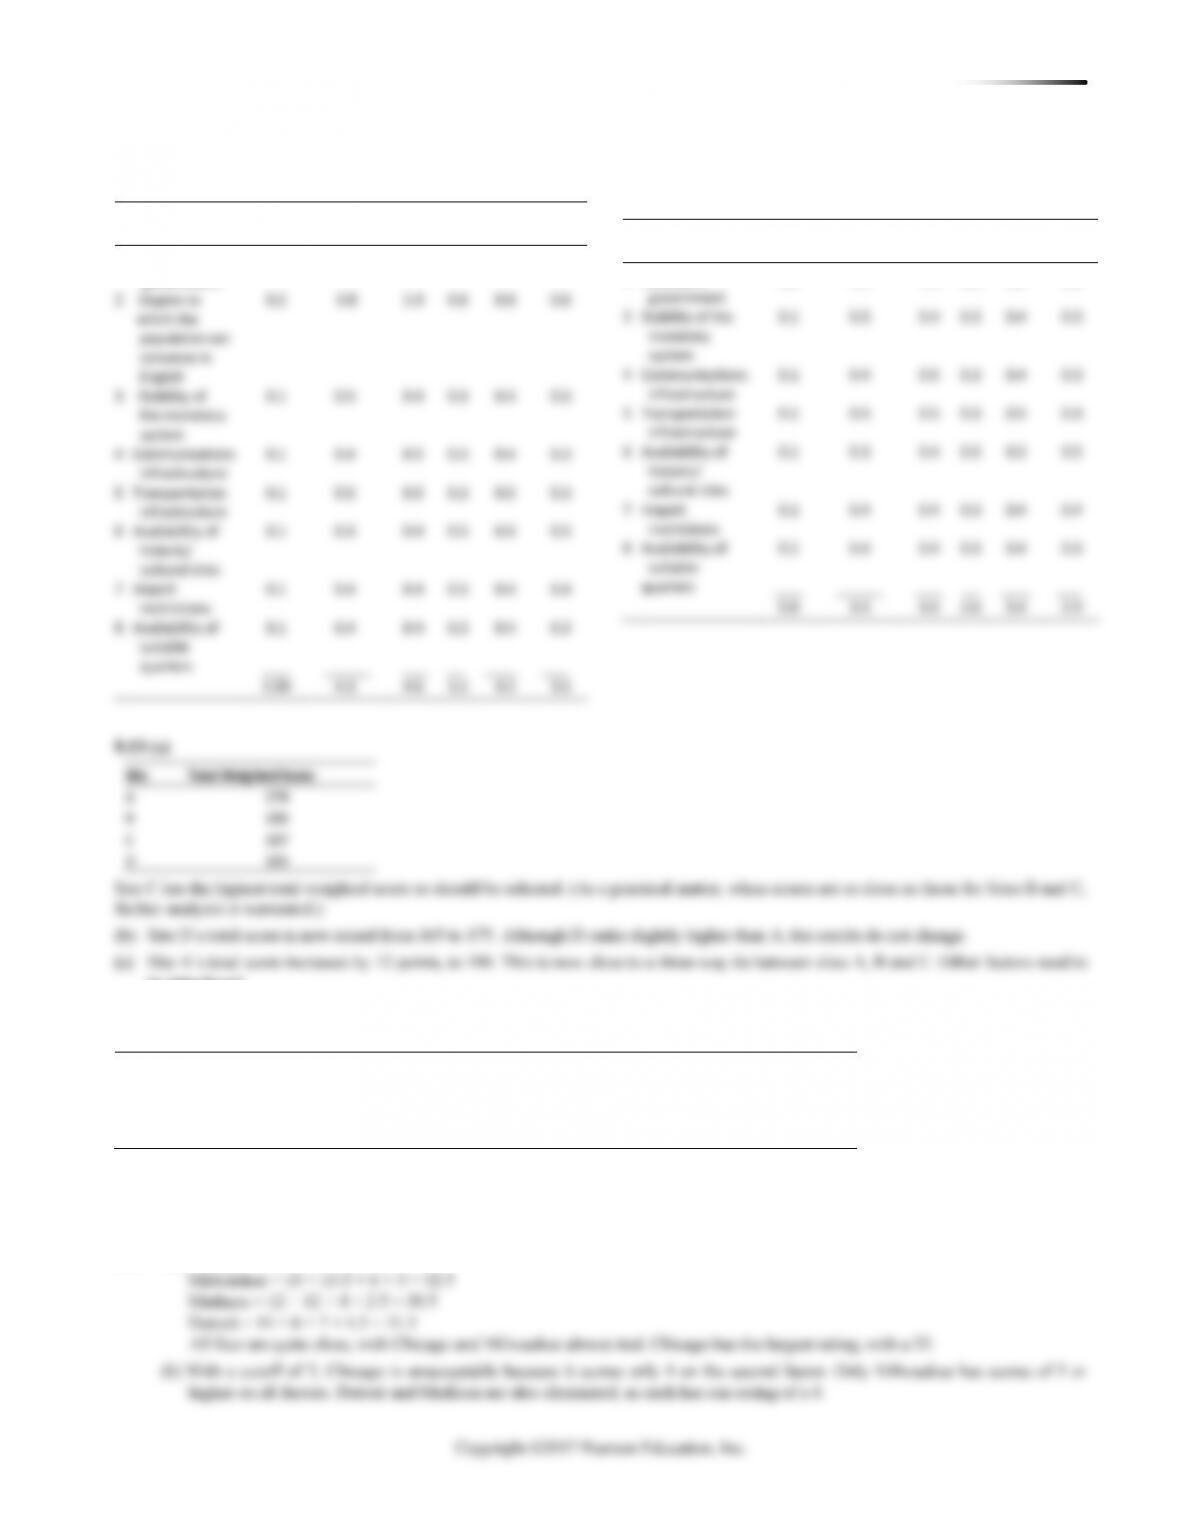
8.13 (a)
Site
Total Weighted Score
A
174
B
185
C
187
D
165
Site C has the highest total weighted score so should be selected. (As a practical matter, when scores are as close as those for Sites B and C,
further analysis is warranted.)
(b) Site D’s total score is now raised from 165 to 175. Although D ranks slightly higher than A, the results do not change.
(c) Site A’s total score increases by 12 points, to 186. This is now close to a three-way tie between sites A, B and C. Other factors need to
be introduced.
8.14 (a)
Germany:
0.05(5) + 0.05(4) + 0.2(5) + 0.2(5) + 0.2(1) + 0.1(4) + 0.1(1) + 0.1(2) = 3.35
Italy:
0.05(5) + 0.05(2) + 0.2(5) + 0.2(2) + 0.2(4) + 0.1(2) + 0.1(4) + 0.1(3) = 3.45
Spain:
0.05(5) + 0.05(1) + 0.2(5) + 0.2(3) + 0.2(1) + 0.1(1) + 0.1(4) + 0.1(1) = 2.7
Greece:
0.05(2) + 0.05(1) + 0.2(2) + 0.2(5) + 0.2(3) + 0.1(1) + 0.1(3) + 0.1(5) = 3.05
Italy is highest.
(b) Spain’s cost would drop, but the result would not change with a 4 since Spain is already lowest. No score will change Spain’s last
place.
8.15 (a) Chicago = 16 + 6 + 7 + 4 = 33
126 CHAPTER 8 LO CAT I ON ST R A T E G I E S
Copyright ©2017 Pearson Education, Inc.
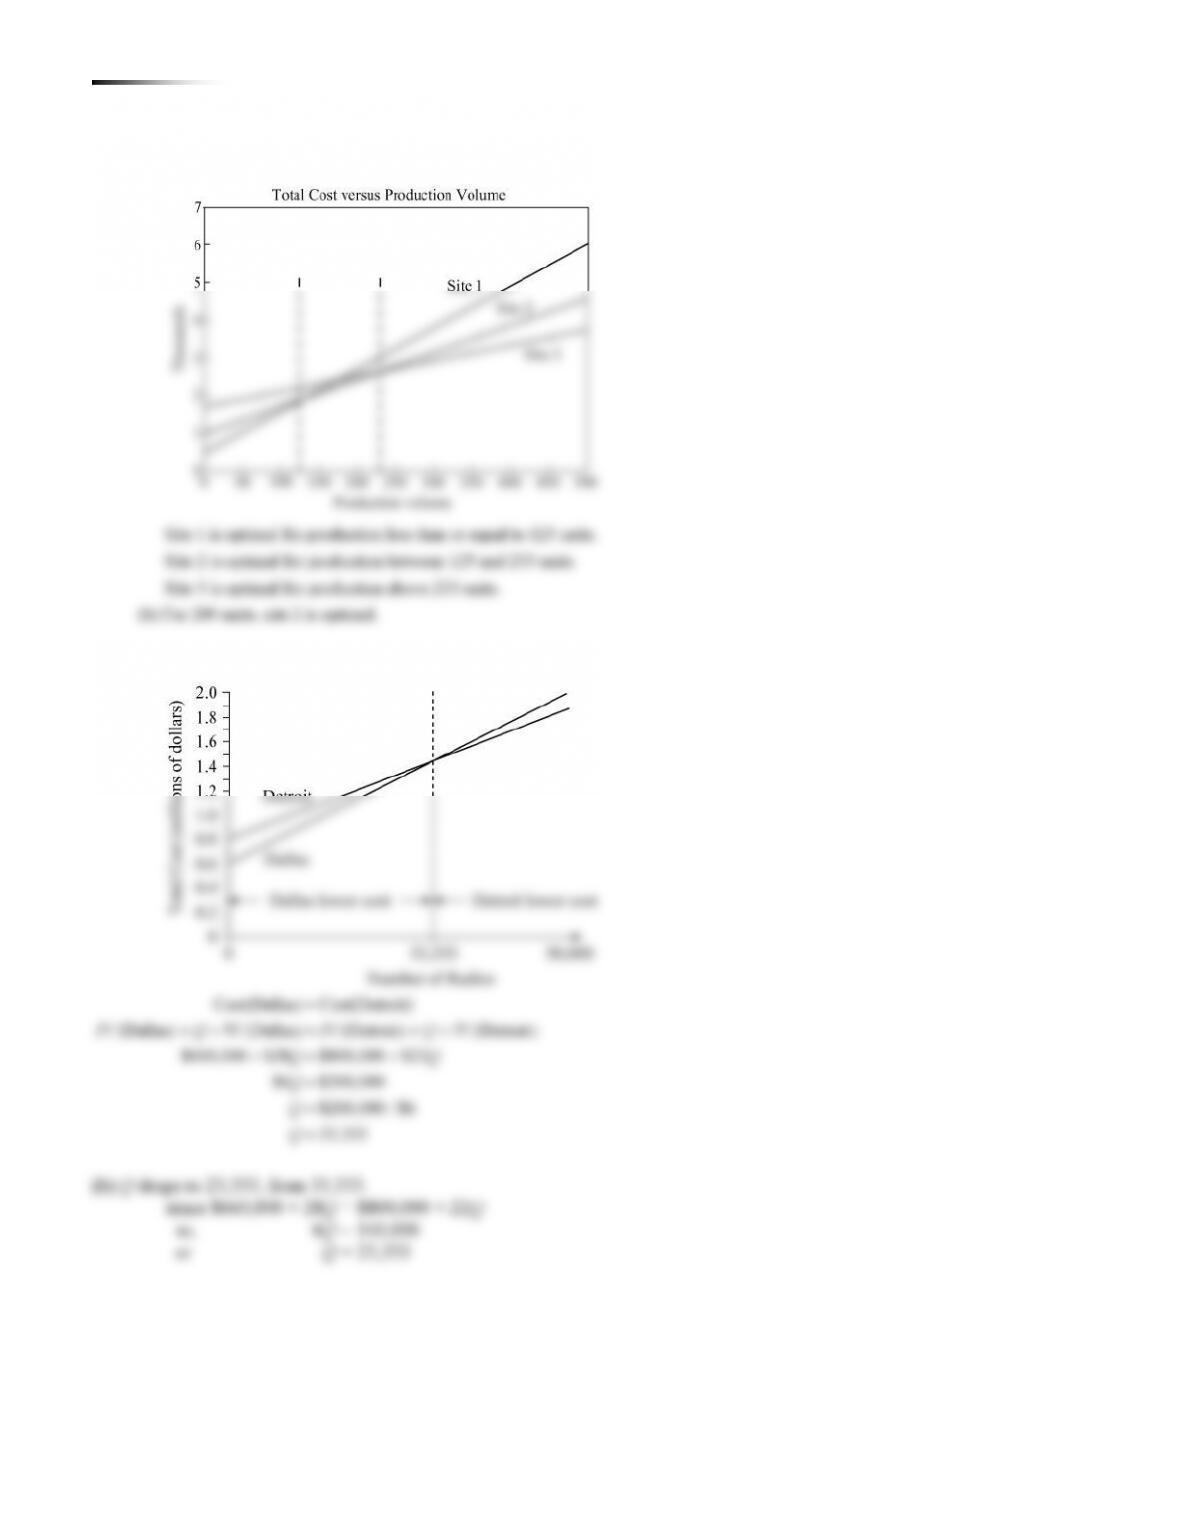
8.16 (a) The following figure indicates the volume range for which each site is optimal.
8.17 (a) See the figure below:
CHAPTER 8 LOC AT I ON ST R A T EGI E S 127
8.18 (a)
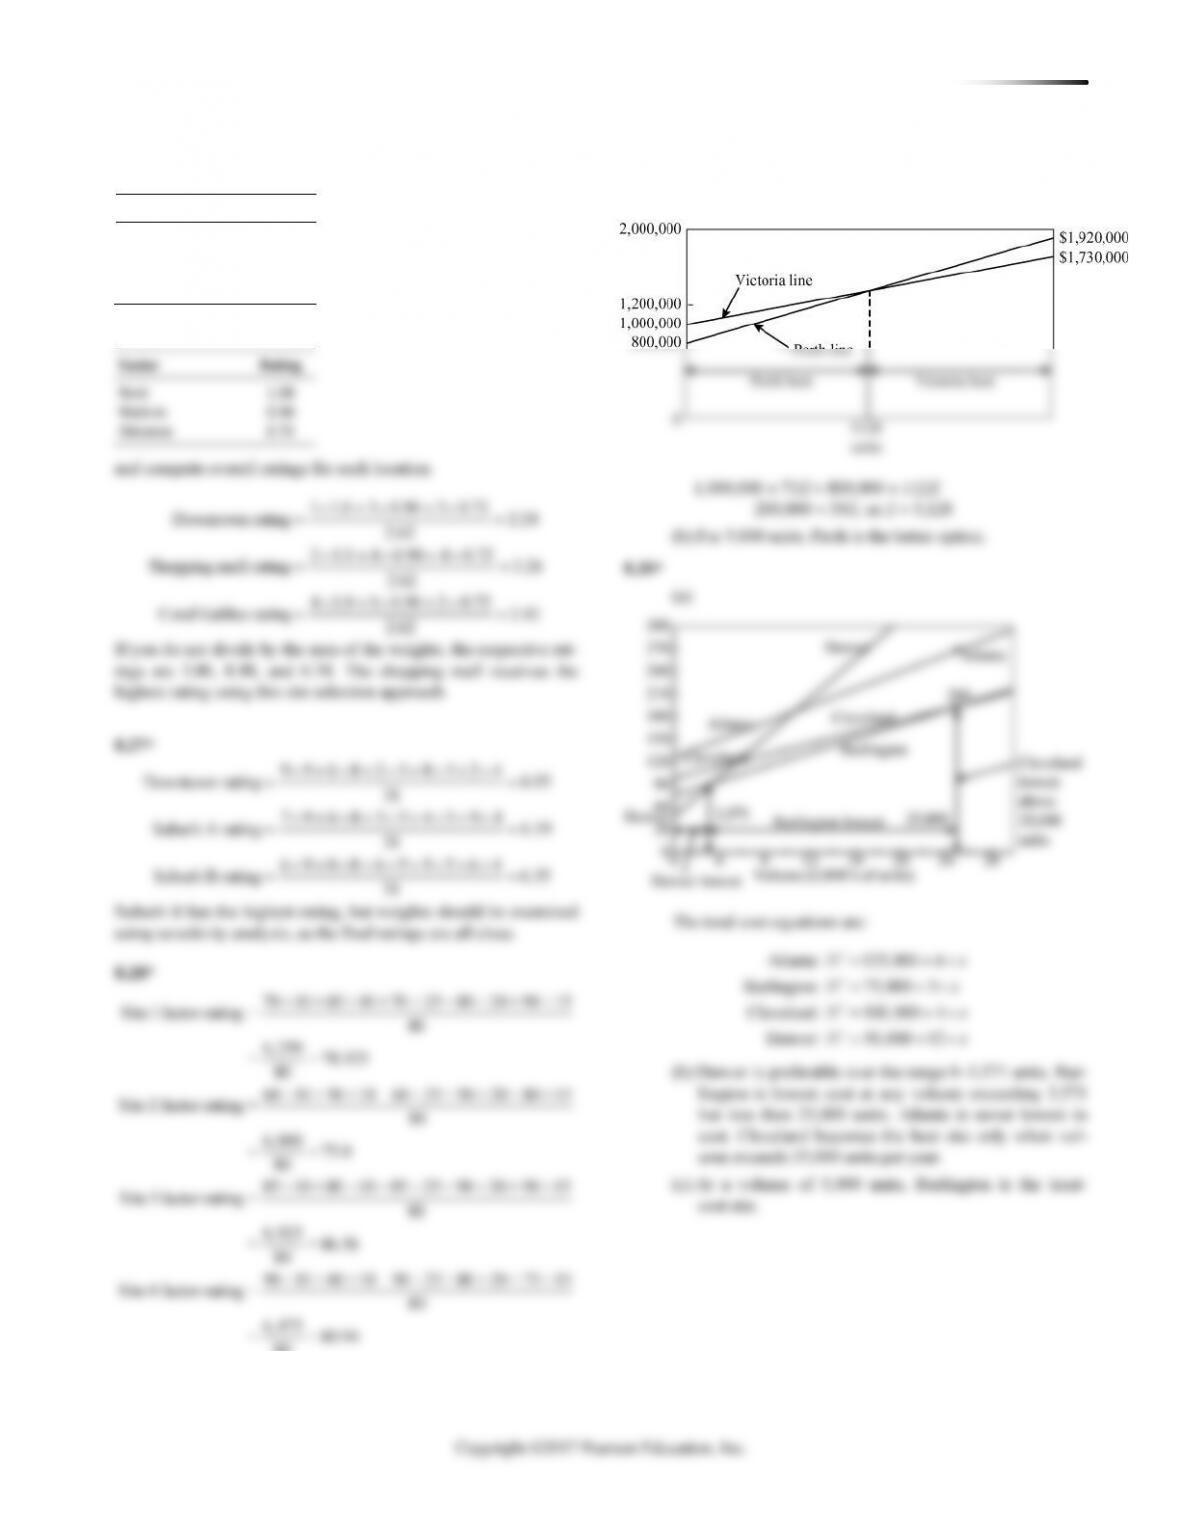
8.19 (a) Crossover is where ProfitBonham = ProfitMcKinney;
or –800,000 + 15,000X = –920,000 + 16,000X
Crossover is at 120 units.
Bonham
McKinney
Profit 800,000 + (29,000 14,000)
800,000 + 15,000
Profit 920,000 + (29,000 13,000)
920,000 + 16,000
X
X
X
X
= − −
=−
= − −
=−
(b, c) McKinney is preferable beyond 120 units, Bonham
below 120 units.
(d) Bonham has break even at about 53 units; McKinney
about 58, so both are beyond break even at the crossover.
8.20 (a)
5 5 6 10 4 15 9 5 7 15 3 10 2 5
5 10 15 5 15 10 5
335 5.15
65
10 5 8 10 9 15 5 5 9 15 2 10 6 5
5 10 15 5 15 10 5
475 7.31
65
x
y
C
C
+ + + + + +
=+ + + + + +
==
+ + + + + +
=+ + + + + +
==
The proposed new hub should be near (5.15, 7.31).
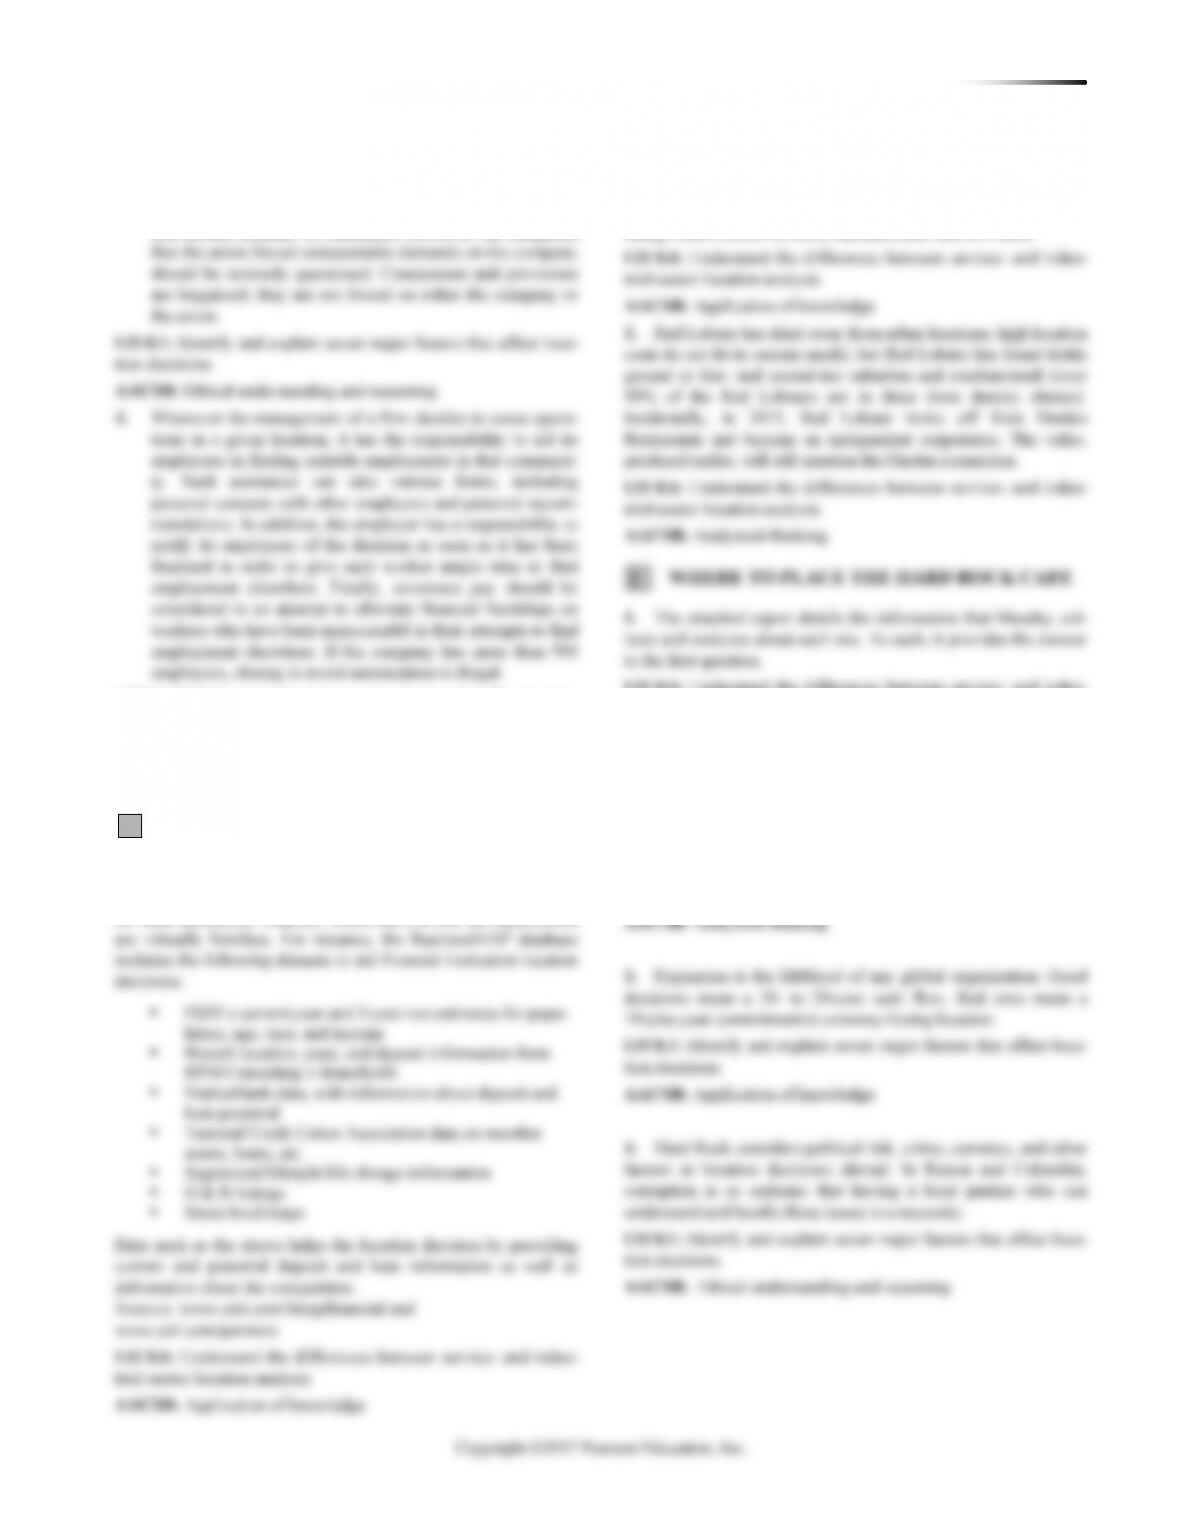
8.21
3 9.2 3 7.3 5 7.8 3 5.0 3 2.8
3 5.5 3 5.0 3 3.8
26
154.8 5.95
26
3 3.5 3 2.5 5 1.4 3 8.4 3 6.5 3 2.4
3 3.6 3 8.5
26
113.2 4.35
26
x
y
C
C
+ + + + +
+ +
=
==
+ + + + + +
+
=
==
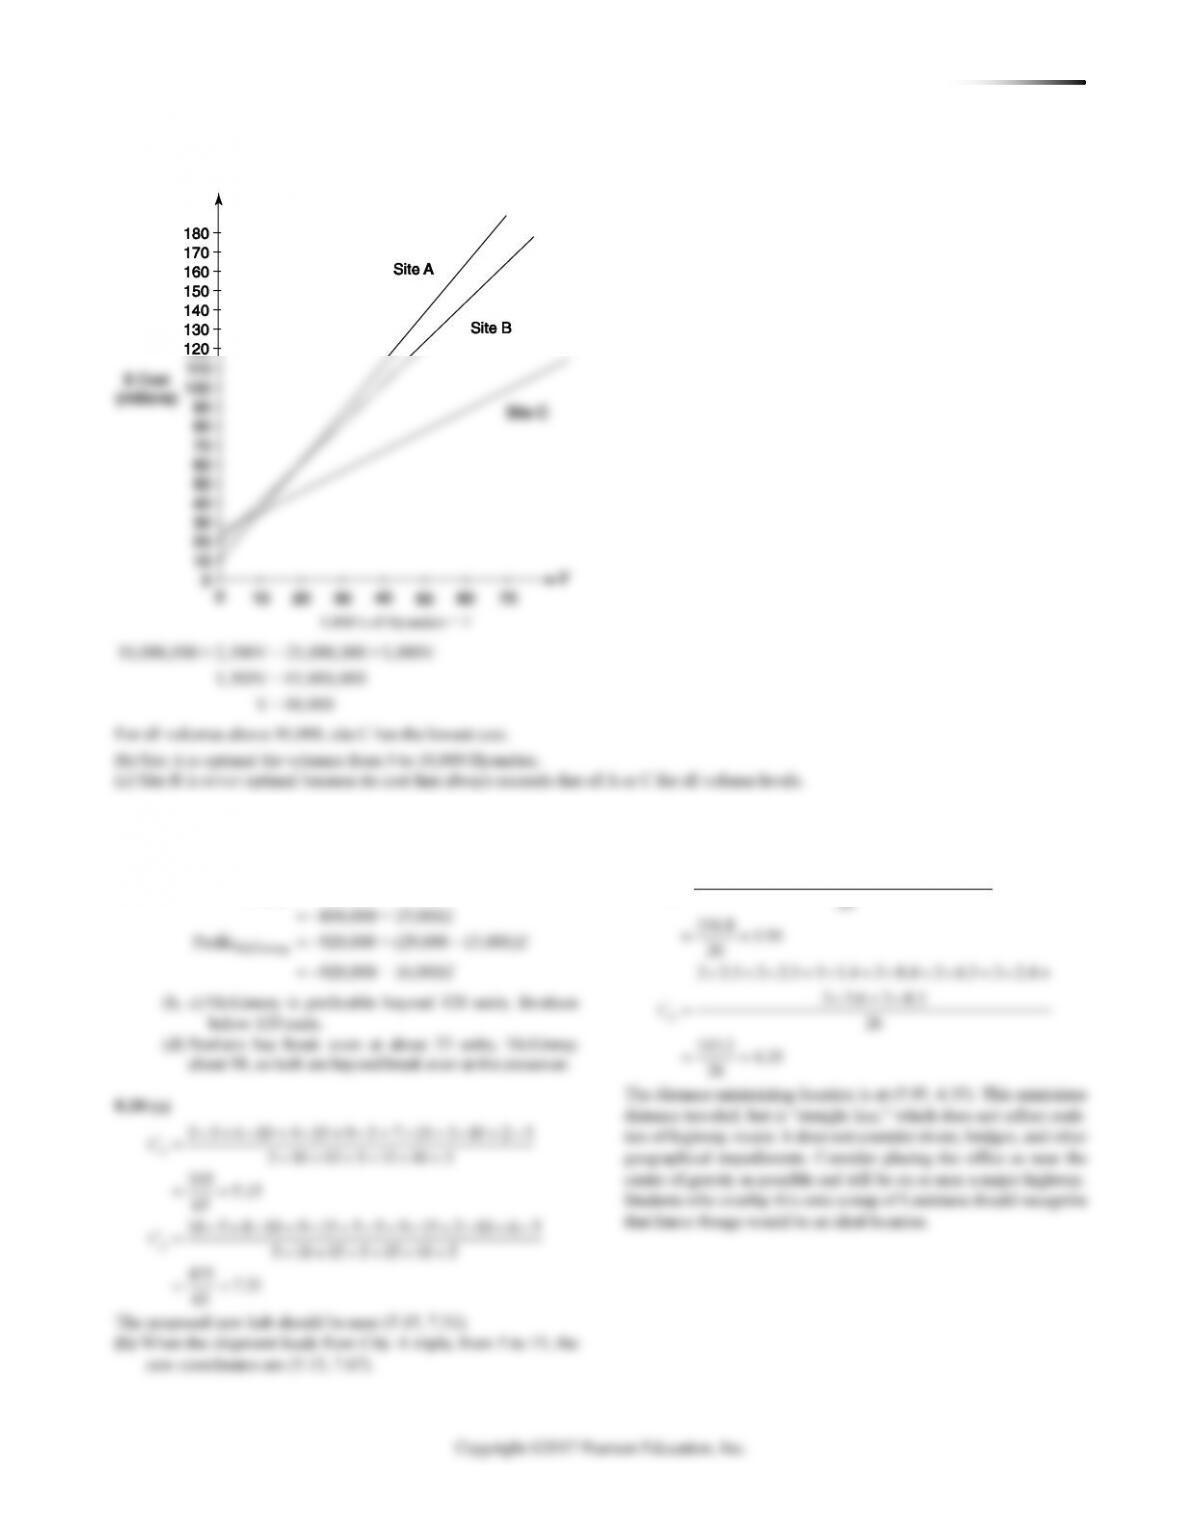
The distance-minimizing location is at (5.95, 4.35). This minimizes
distance traveled, but is “straight line,” which does not reflect reali–
ties of highway routes. It does not consider rivers, bridges, and other
geographical impediments. Consider placing the office as near the
center of gravity as possible and still be on or near a major highway.
Students who overlay this onto a map of Louisiana should recognize
that Baton Rouge would be an ideal location.
128 CHAPTER 8 LO CAT I ON ST R A T E G I E S
8.22
Site
A
20(5) + 16(2) + 16(3) + … + 5w7 = 298 + 5w7
B
20(4) + 16(3) + 16(4) + … + 4w7 = 330 + 4w7
C
20(4) + 16(4) + 16(3) + … + 3w7 = 344 + 3w7
D
20(5) + 16(1) + 16(2) + … + 3w7 = 300 + 3w7
◼ Availability of land and its price
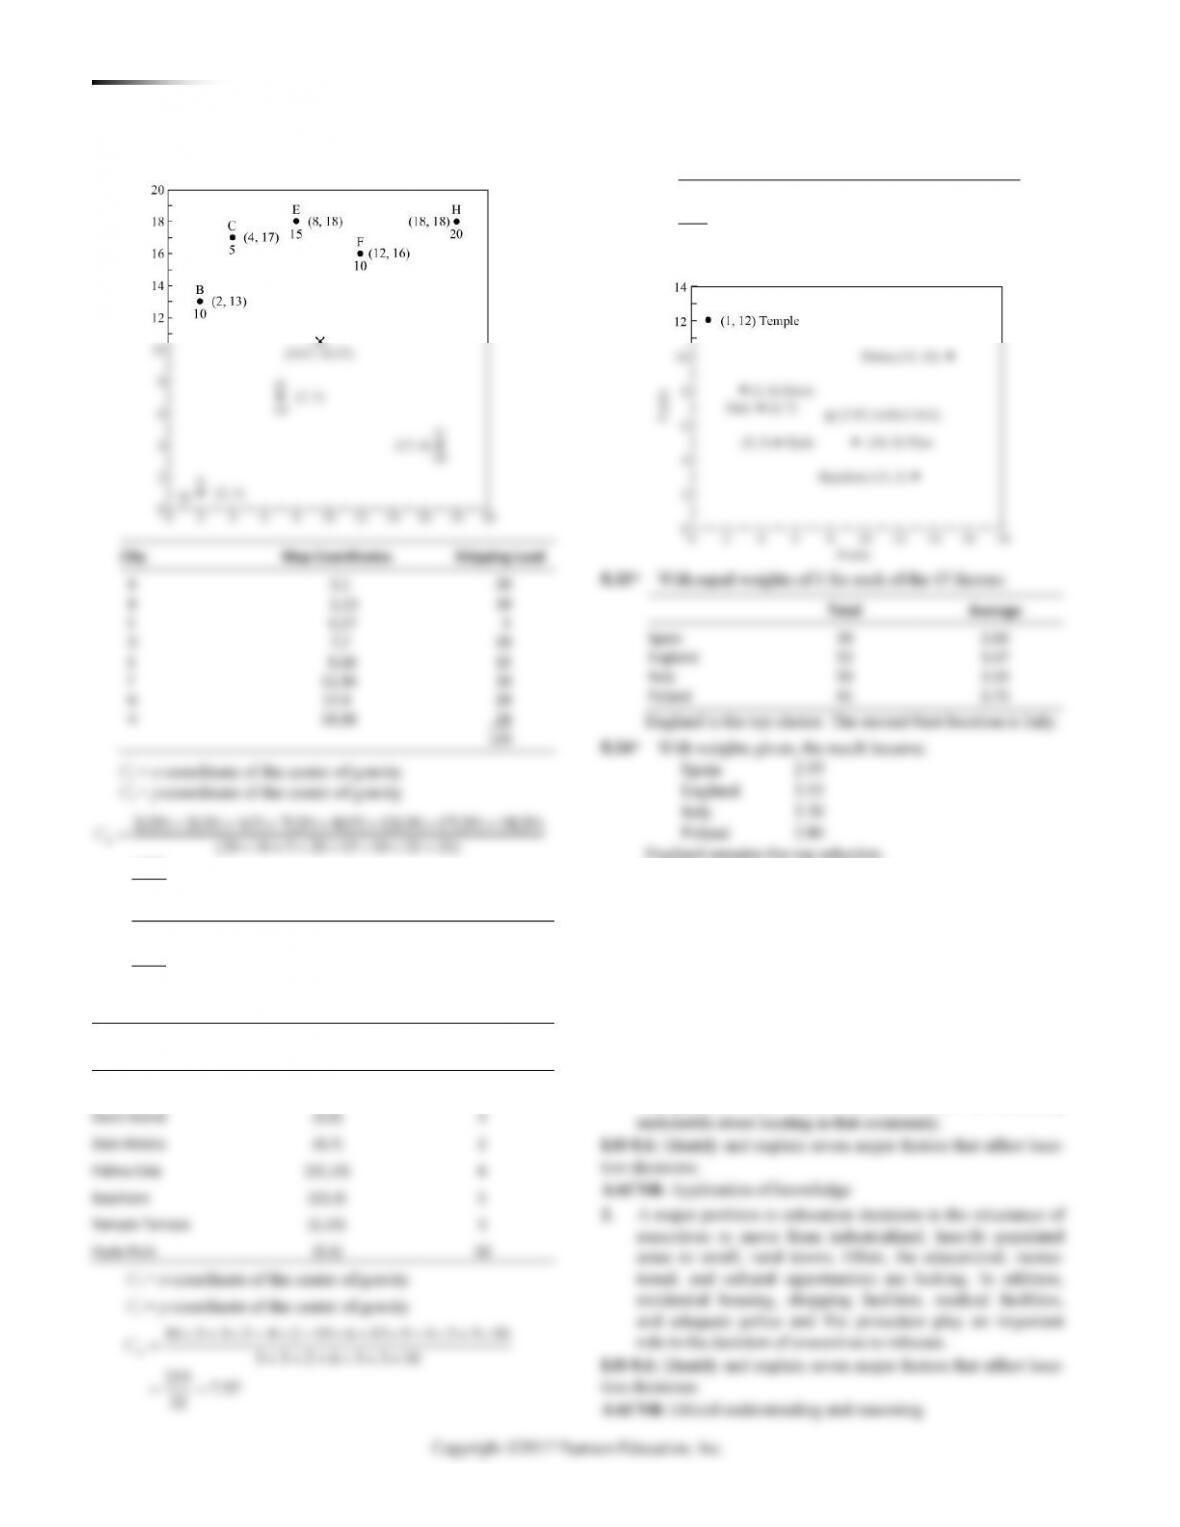
8.23 (a)
x
C
= x-coordinate of the center of gravity Cy = y-coordinate
of the center of gravity
x
x
y
C
C
C
+ + + +
++
=+ + + + +
+
==
=
[25(2,000) 25(5,000) 55(10,000) 50(7,000)
80(10,000) 70(20,000) 90(14,000)]
[2,000 5,000 10,000 7,000 10,000
20,000 14,000]
4,535,000 66.69
y
C
+ + + + +
+
==
[2,000 5,000 10,000 7,000 10,000
20,000 14,000]
2,055,000 30.22
68,000
y-coordinate numerator increases (by 45(2,000) + 50(2,000))
to 2,245,000.
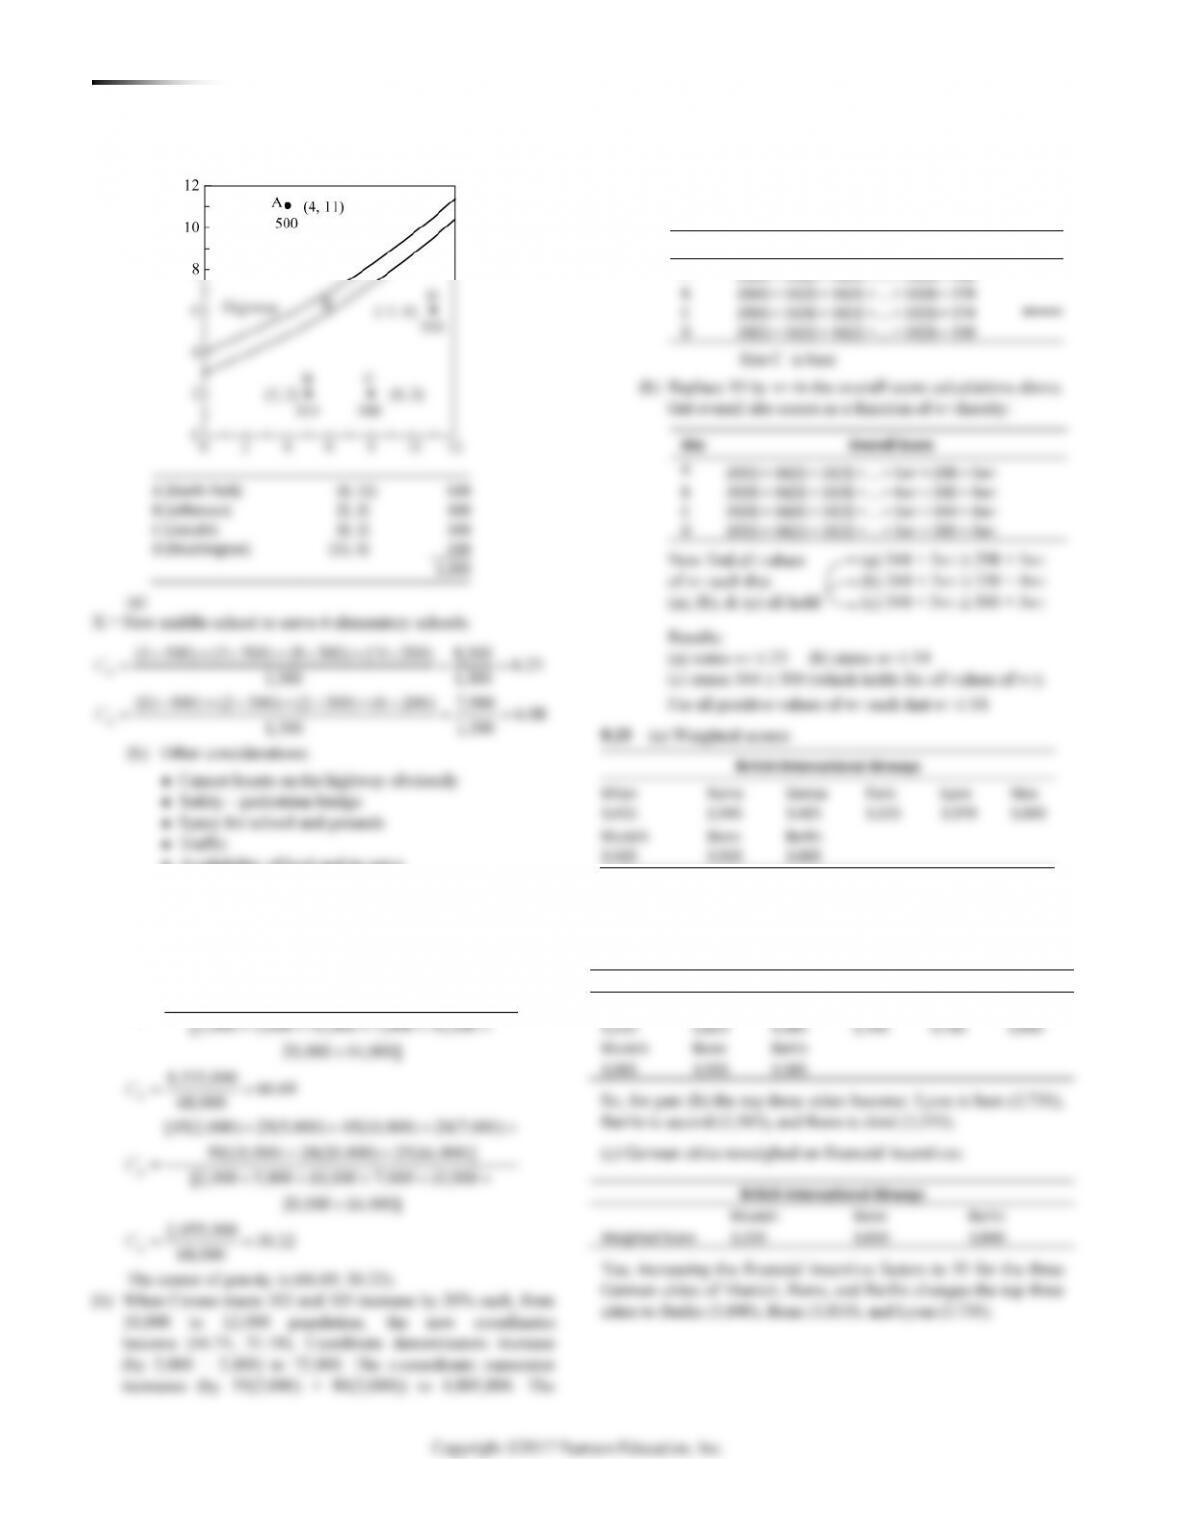
8.24 (a) Calculate the overall site scores for each site:
Site
Overall Score
A
20(5) + 16(2) + 16(3) + … + 10(5) = 348
B
20(4) + 16(3) + 16(4) + … + 10(4) = 370
C
20(4) + 16(4) + 16(3) + … + 10(3) = 374
D
20(5) + 16(1) + 16(2) + … + 10(3) = 330
Site C is best
(b) Replace 10 by w7 in the overall score calculations above.
Get overall site scores as a function of w7 thereby:
3,425
3,915
3,665
So, for part (a) the top three cities become: Lyon is best (3,970),
Bonn is second (3,915), and Berlin is third (3,665).
(b) Weighted scores with hangar weights modified:
British International Airways
Milan
Rome
Genoa
Paris
Lyon
Nice
3,215
2,825
3,345
2,795
3,730
3,460
Munich
Bonn
Berlin
3,065
3,555
3,585
British International Airways
Munich
Bonn
Berlin
Weighted Score
3,320
3,810
3,840
CHAPTER 8 LOC AT I ON ST R A T EGI E S 129
8.26* To aid in this analysis, we assign a rating to each “grade”:
Grade
Rating
A
4
B
3
C
2
D
1
and to each “factor”:
Rent
Walk-in
80
Site 3 has the highest rating factor, 86.56, and should be selected.
8.29*
(a)
130 CHAPTER 8 LO CAT I ON ST R A T E G I E S
8.31*
+ + + + + +
=+ + + + + +
==
y
C5 3 8 3 7 2 10 6 3 5 12 3 5 10
3 3 2 6 5 3 10
214 6.69
32
The proposed new facility should be near (7.97, 6.69).
CHAPTER 8 LOC AT I ON ST R A T EGI E S 131
1
3. Matters of economics are certainly justifiable reasons to
relocate. If a firm can generate more revenue, operate more
efficiently, and experience lower costs at another site, reloca-
tion should certainly be considered. However, the allegation
LO 8.1: Identify and explain seven major factors that affect location
decisions
AACSB: Ethical understanding and reasoning
VIDEO CASE STUDIES
LOCATING THE NEXT RED LOBSTER
RESTAURANT
1. MapInfo has 72 clusters that provide socioeconomic profil-
ing. These profiles (PSYTE) provide interesting reading and data
for class discussion. MapInfo would tell you that the applications
2. Many differences can be identified in an assignment or class
discussion, but restaurants want disposable income, while retail—
depending on the type of retail—wants high traffic, and manufac-
turing wants a focus on costs, infrastructure, and low taxes.
LO 8.6: Understand the differences between service- and indus-
trial-sector location analysis
AACSB: Analytical thinking
2. The ratings of the four cities are
A = 80.5, B = 64.5, C = 71.5, and D = 79.5. So City A is a close
first choice over City D. In reality, they are so close that other
considerations may be included, or sensitivity analysis on scores
or weights performed.
LO 8.3: Apply the factor-rating method
132 CHAPTER 8 LO CAT I ON ST R A T E G I E S
HARD ROCK REPORT (CONT’D)
4. Attendance
5. Future Bookings
6. Expansion Plans
7. Major Conventions
Attractions
◼ Entertainment (Including location, seats, attendance)
1. Theaters (Including live performance space)
8. Size of Bar
9. Outside Dining Facilities
HARD ROCK CAFE
STANDARD MARKET REPORT (OFFSHORE)
Executive Summary
Introduction
◼ Purpose
◼ Product Type (e.g., franchise or company owned, cafe,
hotel, casino)
◼ Overview of City/Market (e.g., set context) including
6. Future Development
◼ Convention Center (Trend analysis, if possible)
1. Size
2. National Ranking
3. Days Booked per annum
CHAPTER 8 LOC AT I ON ST R A T EGI E S 133
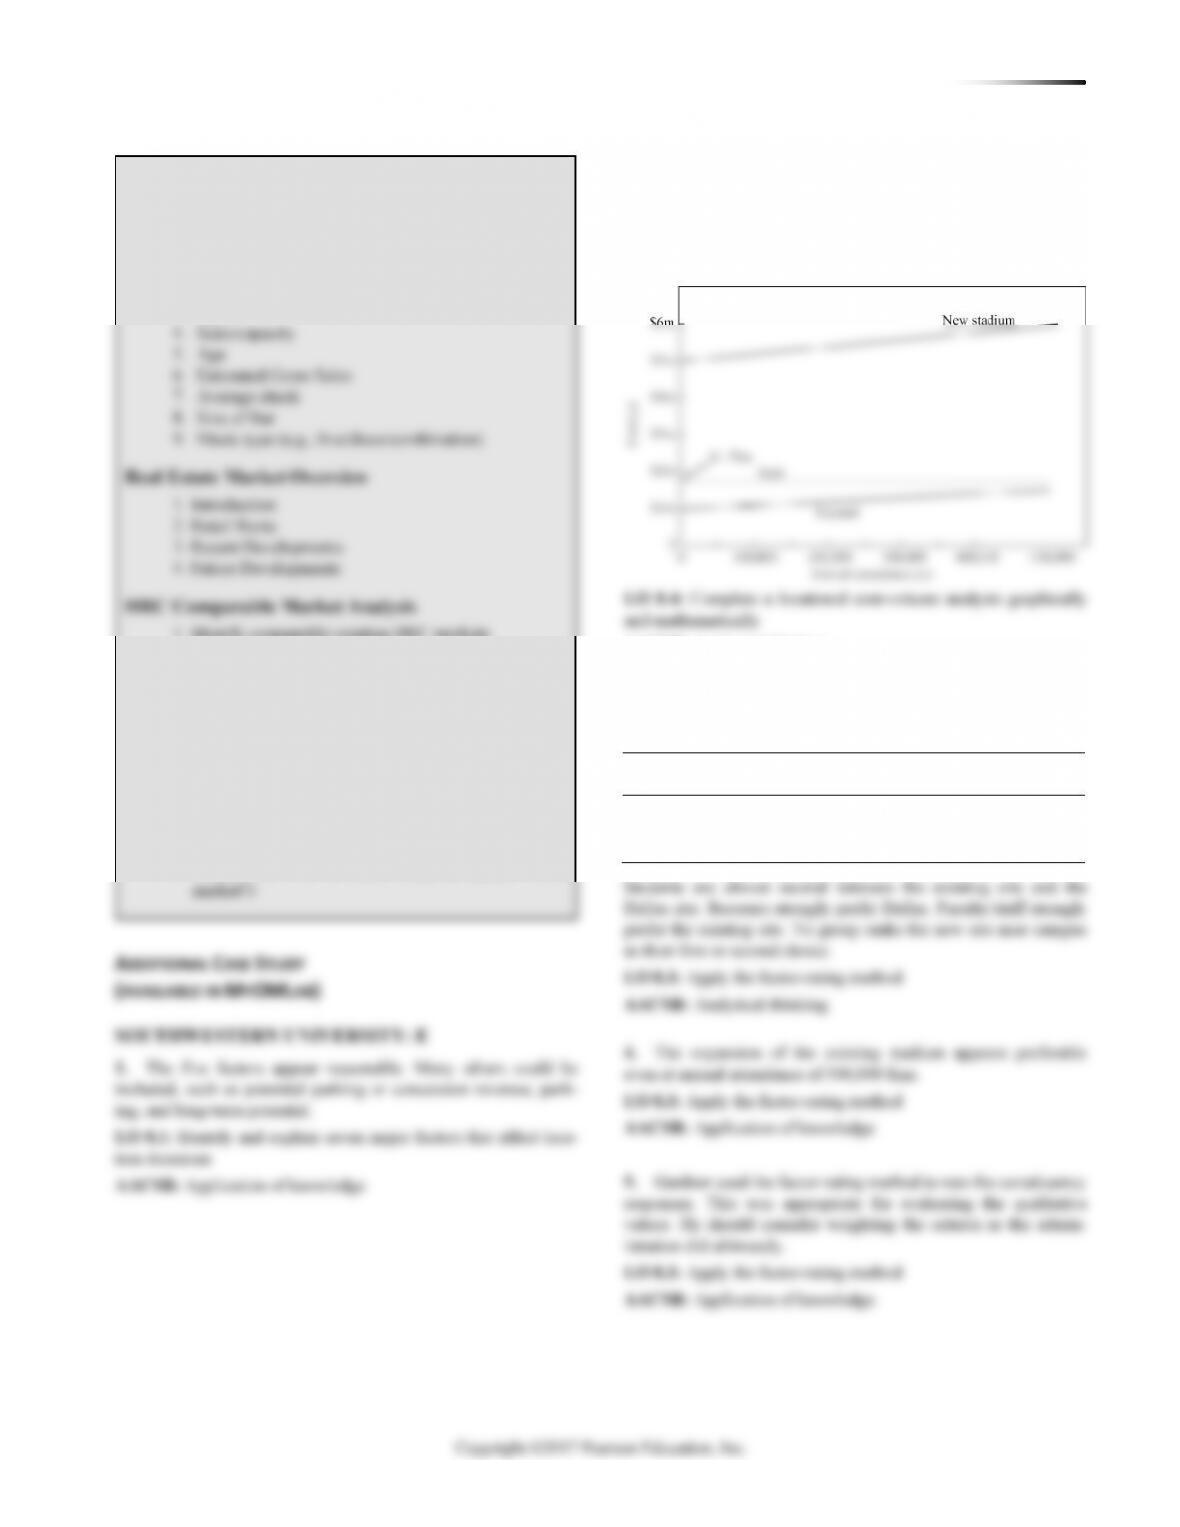
2. Option 1 Expand y = $1,000,000 + $1x
Option 2 New stadium y = $5,000,000 + $2x
Option 3 Rent y = $1,000,000 + $750,000 + $1x
$10 15,000 students 5 games
AACSB: Analytical thinking
3. Based on the survey data, rating “comfort” and “national
image” as 1s, “convenience” as a 2, and “cost” and “guaranteed
availability” as 4s, the results (using A = 4, B = 3, C = 2, D = 1,
F = 0 for grades):
Sum of Rating’s (Weighted Averages in Parentheses)
Existing Site
New Site
Dallas Cowboys Site
Students
36 (3)
21 (1.75)
35 (2.92)
Boosters
34 (2.83)
23 (1.92)
47 (3.92)
Faculty/staff
43 (3.58)
23 (1.92)
35 (2.92)
Greenville
2.3239
McAlester
2.1746
Norman
2.1597
Paris
2.2572
Sherman
1.1183
Wichita Falls
2.6212
Total
16.7426
Weighted Total
7,767.13
HARD ROCK REPORT (CONT’D)
Nightclubs (A selection of clubs/casinos etc. in key
areas of the target market)
1. Name
2. Location
3. Type
1. Identify comparable existing HRC markets
2. Explain similarities (e.g. regional population, visitors,
hotel rooms, seasonality, etc.)
3. Prepare city P&L spreadsheet analysis
Conclusion
1. Estimate of Gross Food & Beverage Revenue for
market in General with backup and comparables
2. Estimate of Gross Merchandise Revenue for market
in General with backup and comparables
3. Preferred locations
4. Sizzle (How will we make ourselves special in this