7
S U P P L E M E N T
Capacity and Constraint Management
DISCUSSION QUESTIONS
1. Design capacity is the theoretical maximum output of a
system in a given period under ideal conditions. Effective capacity
2. Effective capacity is the capacity a firm can expect to achieve
zation
4. Effective capacity takes into account planned resource
unavailability (e.g., scheduled breaks). Actual output starts with
5. Doubling capacity of a bottleneck only moves the bottleneck
somewhere else; every system has at least one bottleneck. There
LO S7.3: Perform bottleneck analysis
7. Theory of constraints is the body of knowledge that deals
8. The fundamental assumptions of break-even analysis are:
LO S7.4: Compute break-even
AACSB: Reflective thinking
9. Revenue data, when plotted, do not fall on a straight line
Leading is preferred when a firm cannot afford to lose customers
11. NPV determines the discounted or time value of money,
comparing cost and income streams over periods of time. Process
AACSB: Reflective thinking
expanding capability.
5. When one set of constraints is overcome, go back to Step 1 and
13. Techniques for dealing with bottlenecks include offloading
tracting may expand the volume of units processed but not speed
SUPPLEMENT 7 CA P A CI T Y A N D CO N S TR A I N T MANA G E M E N T 111
ACTIVE MODEL EXERCISES
1. Due to an anticipated decrease in demand the firm is considering
work on weekdays. What will be the capacity if they select this
S7.6 Design: 93,600 0.95 = 88,920
S7.7 Where:
Actual output = 1,450 students
112 SUPPLEMENT 7 CA P A C I T Y A N D CO N S T R A I N T MA N A G E M E N T
(c) Weekly capacity = (60 min/hr)(8 hr/day)(6 days/wk) /
S7.14 (a) Workstation C is the bottleneck, at 20 min/unit
(Two different Part 1’s can be worked on by Workstation A and
S7.15 (a) Converting each capacity to a process time,
Sawing = Sanding = 60 min/hr ÷ 6 units/hr = 10 min/unit;
(c) Throughput time (time for a unit to go through the system) =
Maximum of (10 + 10 + 30 + 85.71, or 25 + 30 + 85.71) = Maxi-
S7.16 Break-even:
500 2,000 units
F
S7.17 (a) Proposal A break-even in units is:
===
Fixed cost $70,000 $70,000 7,000 units
– 20 – 10 10PV
S7.18 (a) Proposal A break-even in dollars is:
12
20
0.40
1–1–
V
P
0.50
S7.19 Set Proposal A = Proposal B
(8) – 50,000 (10) – 70,000
(8) 20,000 (10)
20,000 10 – 8
XX
XX
XX
=
+=
=
SUPPLEMENT 7 CA P A CI T Y A N D CO N S TR A I N T MANA G E M E N T 113
Break-even is given by:
S7.23 Option A: Stay as is
Option B: Add new equipment
( )
( )
( )
Units Price – – = Profit
Profit = 30,000 1.00 – 0.50 – 14,000
= $1,000
Profit = 50,000 1.00 – 0.60 – 20,000
= $0
A
B
VF
S7.24 Option A: Stay as is
Option B: Add new equipment, raise selling price
( )
( )
( )
Units Price – – = Profit
Profit = 30,000 1.00 – 0.50 – 14,000
= $1,000
Profit = 45,000 1.10 – 0.60 – 20,000
= $2,500
A
B
VF
S7.25 Where:
– 2.50 – 1.75
PV
(b) Revenue at the break-even quantity for the manual
process:
=
=
==
$
50,000 2.50 $125,000 and
37,500
1–
37,500 $125,000
1.75
1– 2.50
BEP V
P
(c) Break-even quantity for the mechanized process:
where: F = 75,000 P = 2.50 V = 1.25
==
−
75,000 60,000 bags
2.50 1.25
X
BEP
(d) Revenue at the break-even quantity for the mechanized
process:
(e) Monthly profit or loss of the manual process if they
(g) They should be indifferent to the process selected at
75,000 bags.
− = −
=
.75 37,500 1.25 75,000
75,000
XX
X
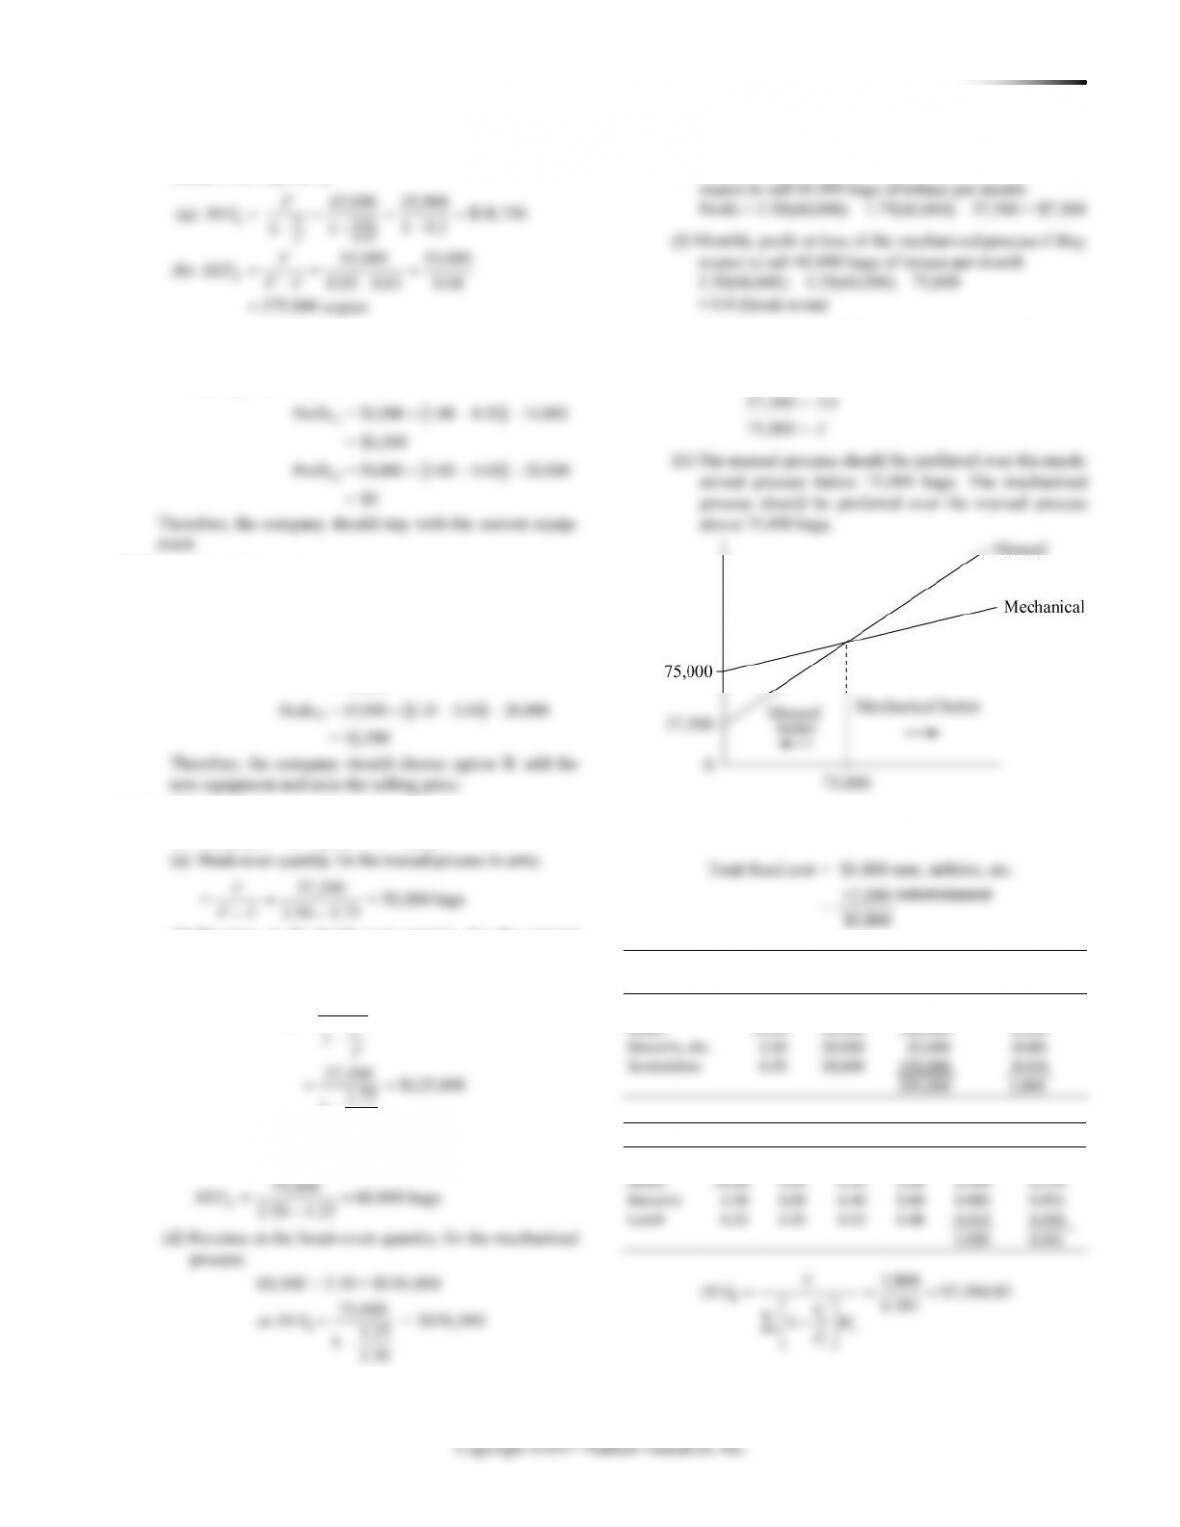
(h) The manual process should be preferred over the mech-
anized process below 75,000 bags. The mechanized
process should be preferred over the manual process
S7.26 (a) Break-even volume:
= $3,800
Selling
Price
Volume
Revenue
Percent of
Total Revenue
Drinks
1.50
30,000
45,000
0.153
Meals
10.00
10,000
100,000
0.339
Desserts, etc.
2.50
10,000
25,000
0.085
Sandwiches
6.25
20,000
125,000
0.423
295,000
1.000
P
V
V/P
1–V/P
Wi
1–(V/P)Wi
Drinks
1.50
0.75
0.50
0.50
0.153
0.077
Meals
10.00
5.00
0.50
0.50
0.339
0.170
Desserts
2.50
1.00
0.40
0.60
0.085
0.051
Lunch
6.25
3.25
0.52
0.48
0.423
0.203
1.000
0.501
$
3,800 $7,584.83
0.501
1ii
i
F
BEP
VW
P
= = =
−
$
60,000 × 2.50 = $150,000
75,000
or = $150,000
1.25
1– 2.50
BEP =
114 SUPPLEMENT 7 CA P A C I T Y A N D CO N S T R A I N T MA N A G E M E N T
(b) Number of meals per day at break even = 9
Selling
Price
Fraction
of Total
Revenue
Dollar
Volume
BE Units
per
Month
BE Units
per
Day
Drinks
1.50
0.153
1,160.48
774→
26
Meals
10.00
0.339
2,571.26
258→
9
Desserts, etc.
2.50
0.085
644.71
258→
8
Sandwiches
6.25
0.424
3,208.28
514→
18
S7.27 (a) Break-even volume, where total fixed cost = labor
(at $250) + booth rental (at 5 $50) = $500.
986.19 × 0.25
= = 140.9 servings
$1.75
20 12 8SP VC = = =
−−
(b) Proposal B break even in units is:
Fixed cost 70,000 70,000 7,000 units
20 10 10SP VC = = =
−−
S7.29* (a) Proposal A break even in dollars is:
Fixed cost 50,000 50,000 $125,000
S7.31* (a) Proposal A: Profit at 8,500 units
Profit = ( ) SP VC X F−−
@ 8,500 for Proposal A:
(20 12)8,500 50,000 = 18,000
@ 8,500 for Proposal B:
(20 10)8,500 70,000 = 15,000
−−
−−
Proposal A is best.
S7.31* (b) Proposal B: Profit at 15,000 units
@ 15,000 units for Proposal A:
(20 12)15,000 50,000 = $70,000
(20 10)15,000 70,000 = $80,000
−−
−−
Proposal B is best.
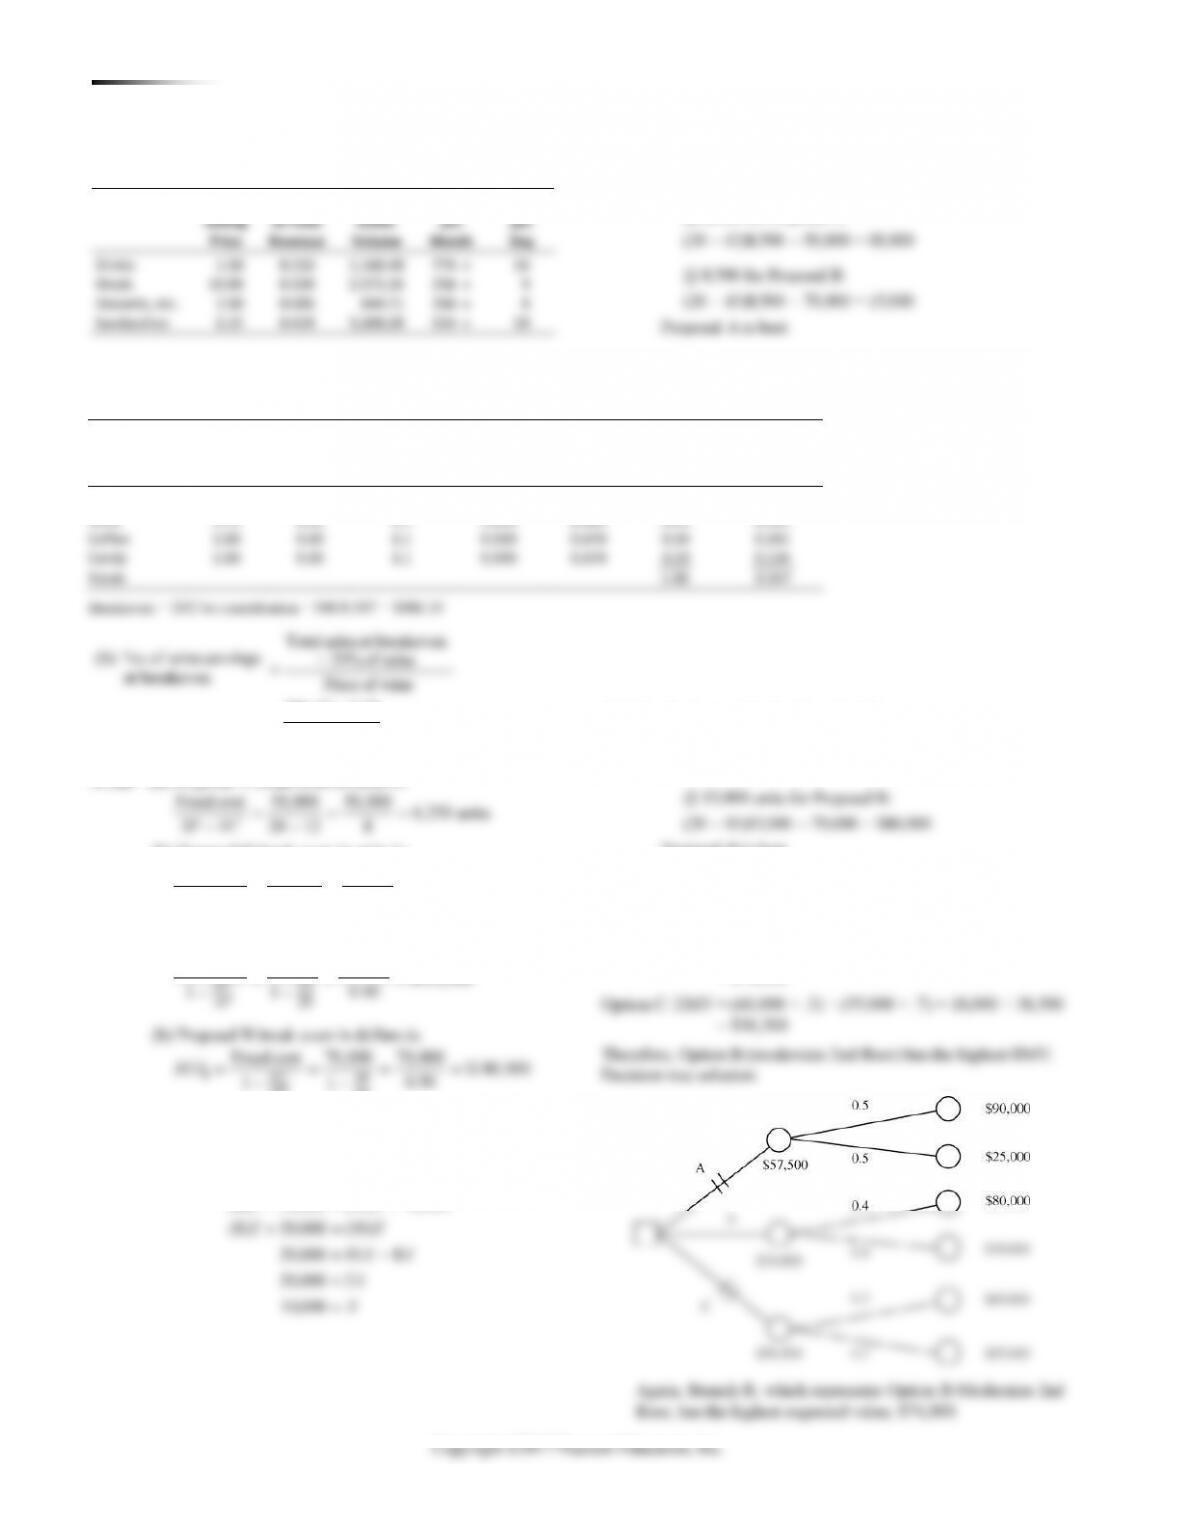
S7.32
Option A: EMV = (90,000 × .5) + (25,000 × .5) = 45,000 + 12,500
= $57,500
Option B: EMV = (80,000 × .4) + (70,000 × .6) = 32,000 + 42,000
Item
(P)
Selling
Price
(V)
Variable
Cost
Var. Cost
Factor (%)
Total
Var. Cost
1– (V/P)
Estimated
Percent
Revenue
Contribution
Weighted
Revenue
Soft drinks
1.00
0.65
1.1
0.715
0.285
0.25
0.071
Wine
1.75
0.95
1.1
1.045
0.403
0.25
0.101
Coffee
1.00
0.30
1.1
0.330
0.670
0.30
0.201
Candy
1.00
0.30
1.1
0.330
0.670
0.20
0.134
Totals
1.00
0.507
Breakeven = TFC/wt contribution = 500/0.507 = $986.19
SUPPLEMENT 7 CA P A CI T Y A N D CO N S TR A I N T MANA G E M E N T 115
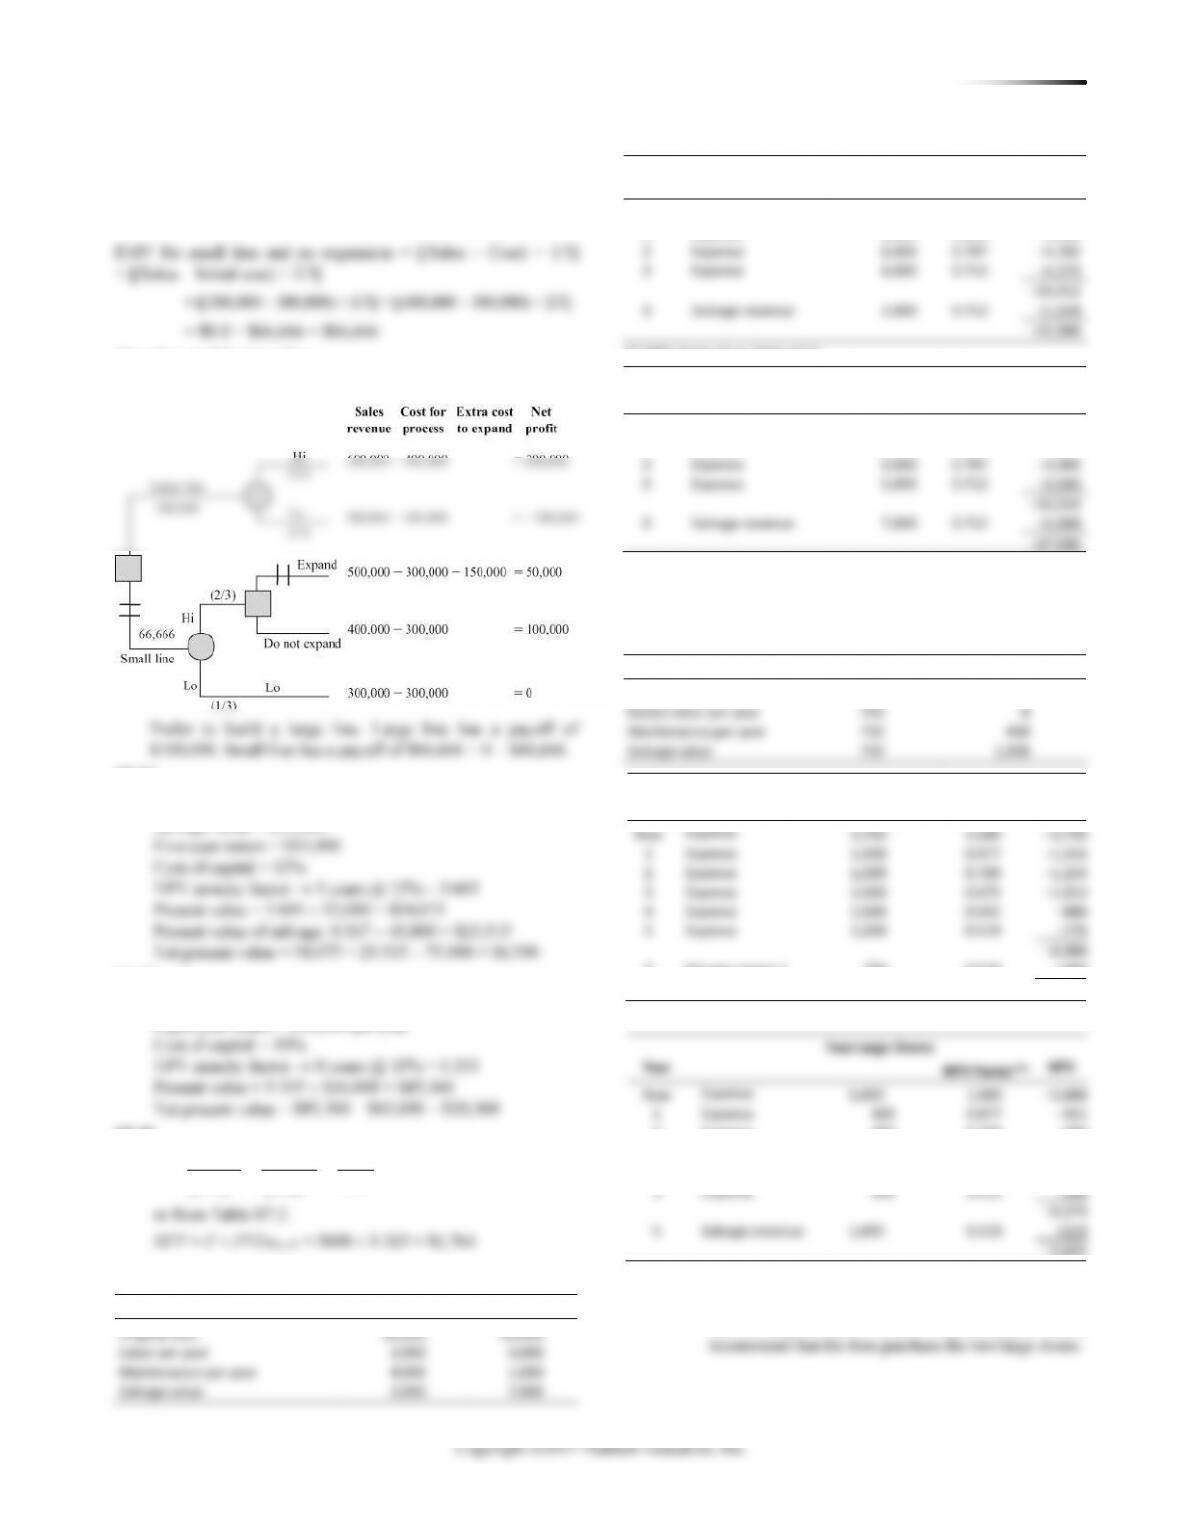
S7.33
EMV for large line = [(Sales – Cost) × 2/3] + [(Sales – Cost) × 1/3]
= (200,000 × 2/3) + (–100,000 × 1/3) = $100,000
2
Expense
6,000
0.797
–4,782
3
Expense
6,000
0.712
–4,272
–24,412
3
Salvage revenue
2,000
0.712
+1,424
Therefore, build a large line.
Decision tree solution:
Excess labor per year
Maintenance per year
S7.34
Initial investment = $75,000
Now
1.000
1
Expense
0.877
2
Expense
0.769
3
Expense
0.675
4
Expense
0.592
5
Expense
0.519
S7.35
Initial investment = $65,000
Two Large Ovens
NPV
Now
5,000
Expense
Expense
Expense
Expense
Expense
Salvage revenue
1,000
+519
Year
Machine A
NPV Factor**
NPV
Now
Expense
10,000
1.000
–10,000
1
Expense
6,000
0.893
–5,358
** NPV factor from Table S7.2.
Year
Machine B
NPV Factor**
NPV
Now
Expense
20,000
1.000
–20,000
1
Expense
5,000
0.893
–4,465
2
Expense
5,000
0.797
–3,985
3
Expense
5,000
0.712
–3,560
–32,010
3
Salvage revenue
7,000
0.712
+4,984
–27,026
** NPV factor from Table S7.2.
NPV for Machine A is –$22,988; NPV for Machine B is –$27,026.
Therefore, Machine A should be recommended.
S7.38
Expense
Three Small Ovens
Two Large Ovens
Original cost
3,750
5,000
Year
Three Small Ovens
NPV Factor**
NPV
5
Salvage revenue
750
0.519
+389
–8,511
** NPV factor from Table S7.2.