6
C H A P T E R
Managing Quality
DISCUSSION QUESTIONS
1. Higher quality leads to greater demand, greater market share,
LO 6.1: Define quality and TQM
AACSB: Reflective thinking
4. Measurement, analysis, and knowledge management
7. Results
Source: 2013-2014 Criteria for Performance Excellence, http://
3. Of Deming’s 14 points, “finding problems” is certainly one of
common goals and stick with them—“constancy of purpose”—is
4. Seven concepts for an effective TQM program: continuous
The 14 points were Deming’s way of showing how he implement-
5. Deming (14 points, leadership and training; good workers
cannot overcome bad processes), Crosby (Quality is Free—the
cost of poor quality is underestimated), and Juran (top manage-
6. The seven tools of TQM are:
◼ Check sheets
◼ Scatter diagrams
7. If there is fear, people will not bring up problems. If there is
AACSB: Reflective thinking
8. A university can seek to control the quality of its graduates by:
◼ Employing appropriate evaluation devices (quizzes,
9. Philip B. Crosby believed that quality is free because, on bal-
10. Quality robustness, quality loss function, and target-oriented
quality.
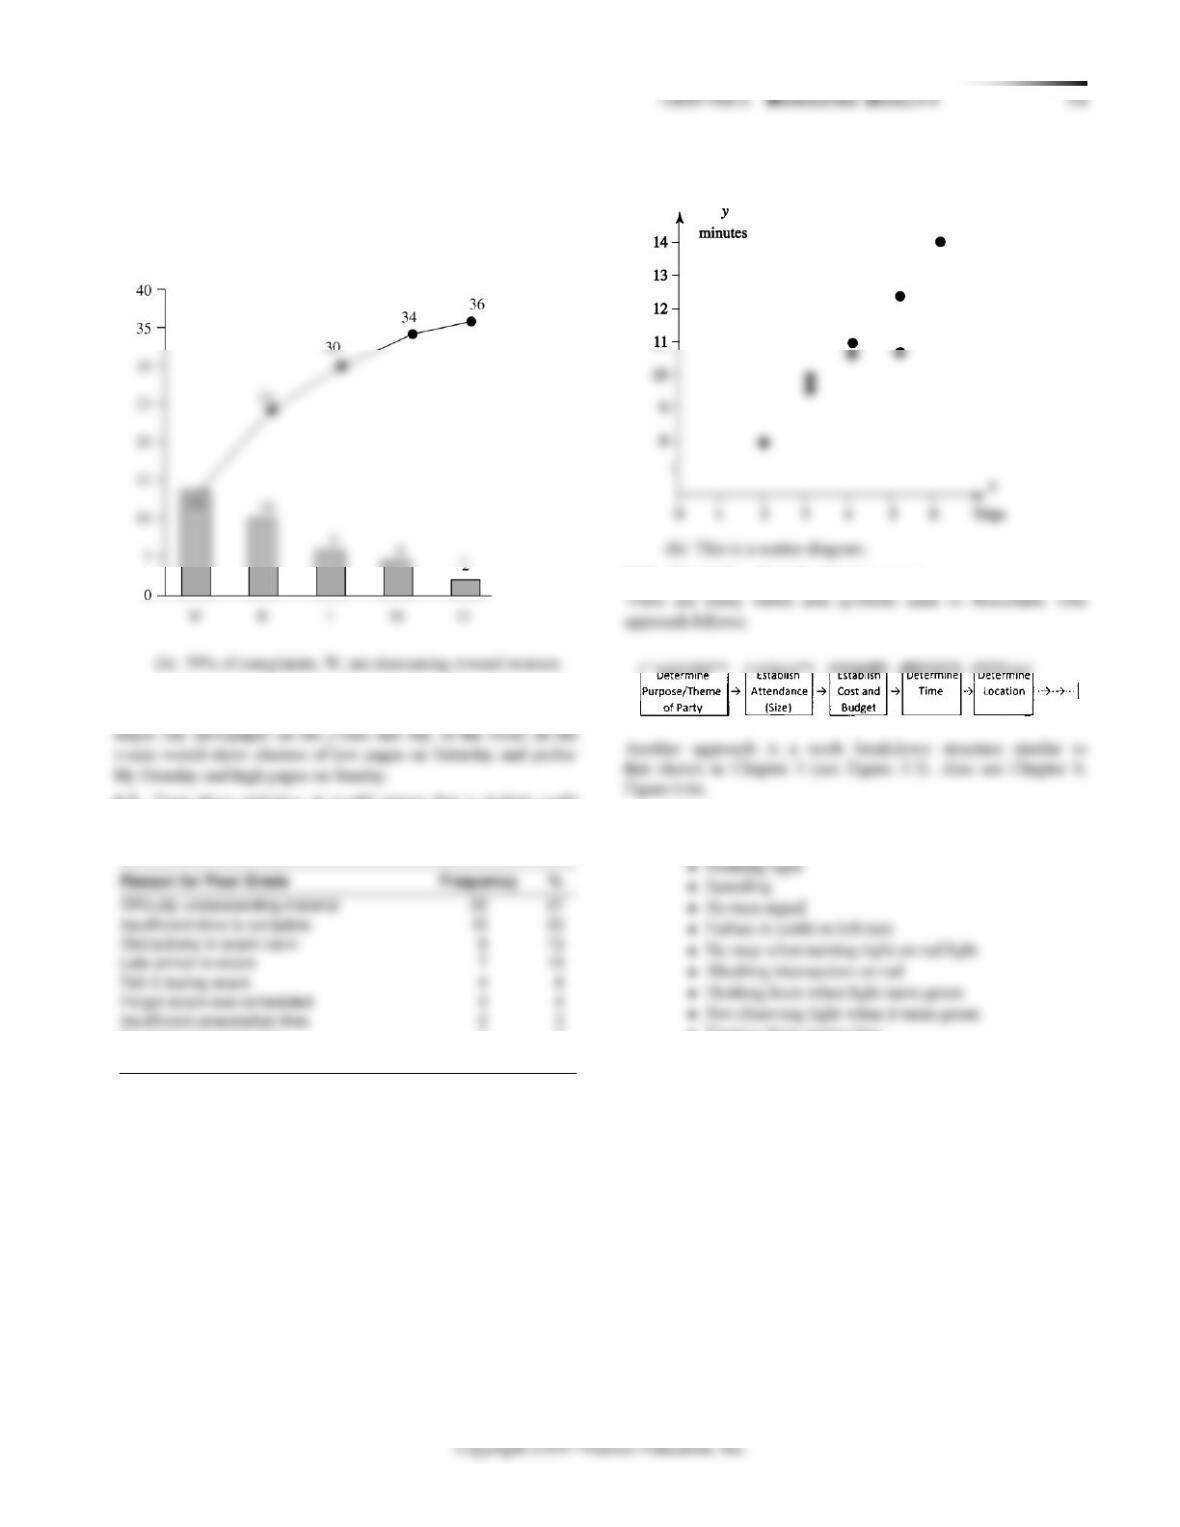
11. A Pareto chart’s purpose is to identify the critical problems
76 CHAPTER 6 MAN A G I N G QU A L I T Y
Location: 2nd
Time of Day
and Forrester
Poor Driving
Habit
7:00–7:20 A.M.
10:00–10:20 A.M.
5:00–5:20 P.M.
7:30–7:50 P.M.
Total
Running light
14
Speeding
13
No turn signal
8
Failure to yield on
8
left turn
No stop when
8
turning right on red
light
Blocking
10
Honking horn
12
when light turns
green
Not observing light
6
when it turns green
Turning from
2
wrong lane
through light but
Other
11
Check sheet might look like the following:
The frequency counts for this set of observations is shown on the
right. The check sheet can be used to discuss the differences in
driving habits at different times of the day.
(b) The check sheet results can be sorted into a descending
frequency table.
Sorted Frequency Table
Poor Driving Habit
Frequency
Running light
14
Speeding
13
Honking horn when light turns green
12
Other
11
Blocking intersection on red
10
Failure to yield on left turn
8
No stop when turning right on red light
8
No turn signal
8
Not observing light when it turns green
6
Appear to go through light but stop suddenly
4
Turning from wrong lane
2
CHAPTER 6 MAN A G I N G QU A L I T Y 77
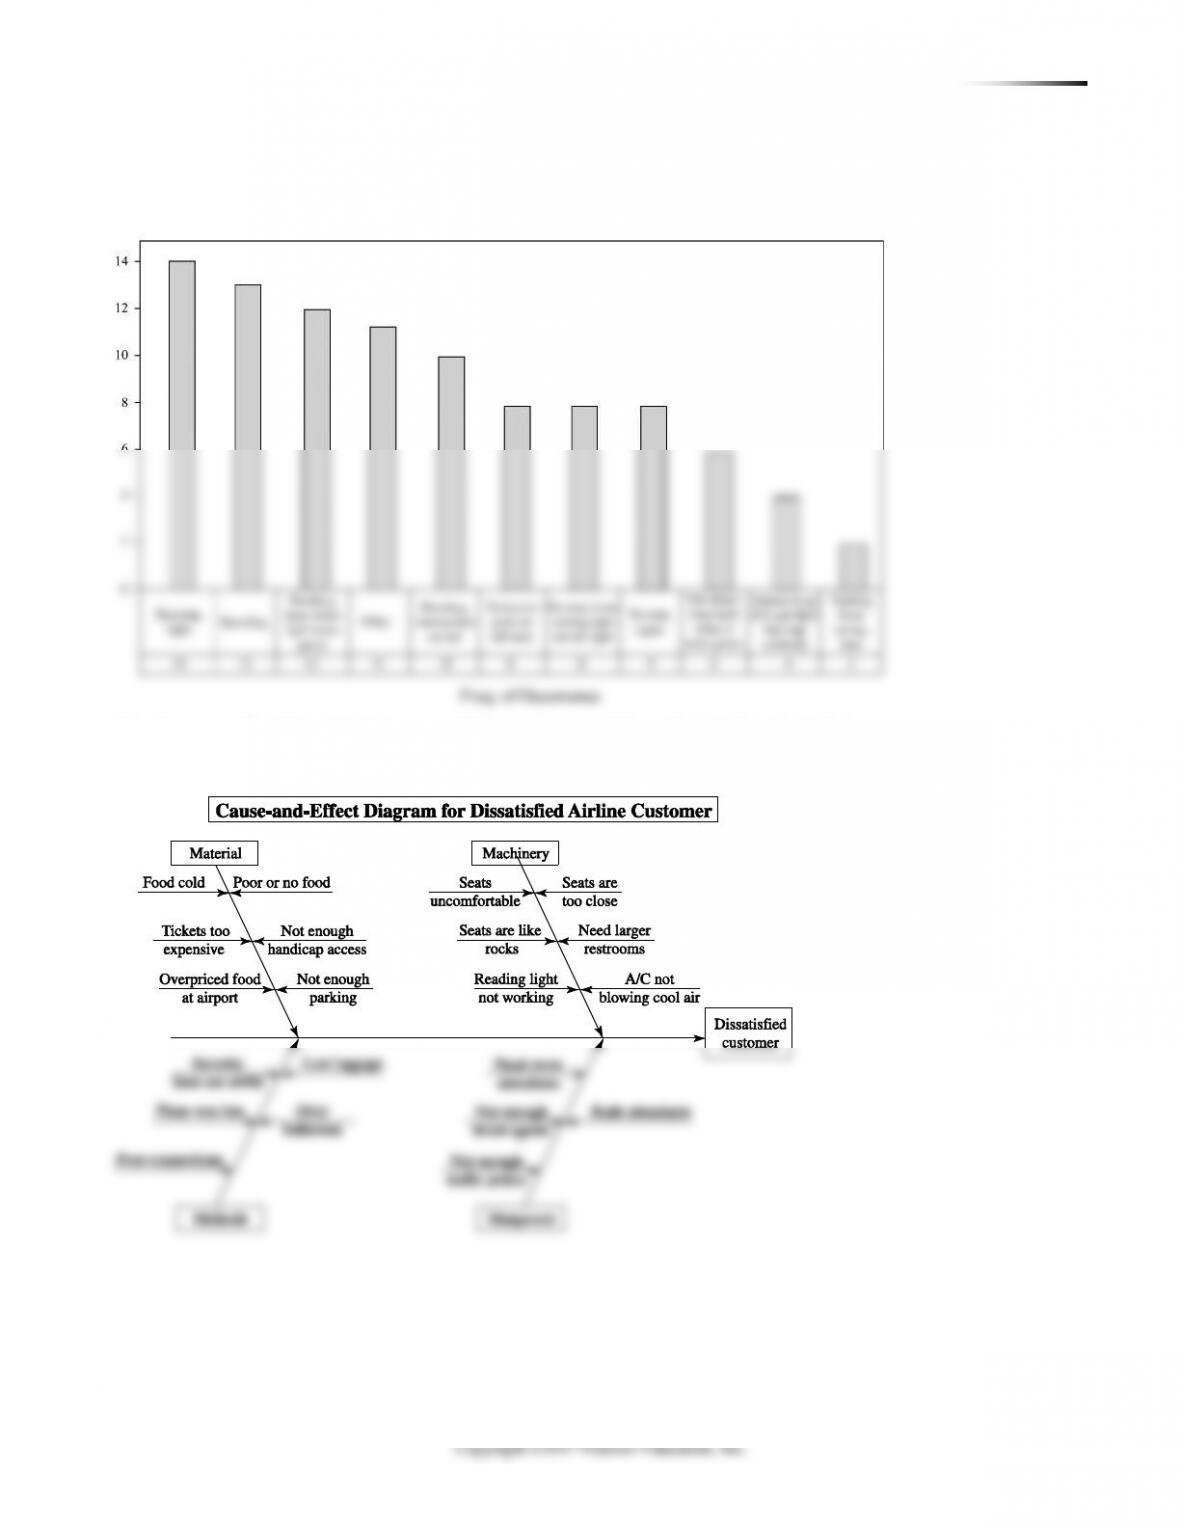
A Pareto chart like the one shown below can illustrate the major habits that dominate the behavior. Note: A classic
Pareto chart would also include a cumulative probability line.
6.8 Cause-and-effect diagram (also known as a fishbone chart or an Ishikawa diagram) for a dissatisfied
airline customer:
Freq. of Occurrence
78 CHAPTER 6 MAN A G I N G QU A L I T Y
Copyright ©2017 Pearson Education, Inc.
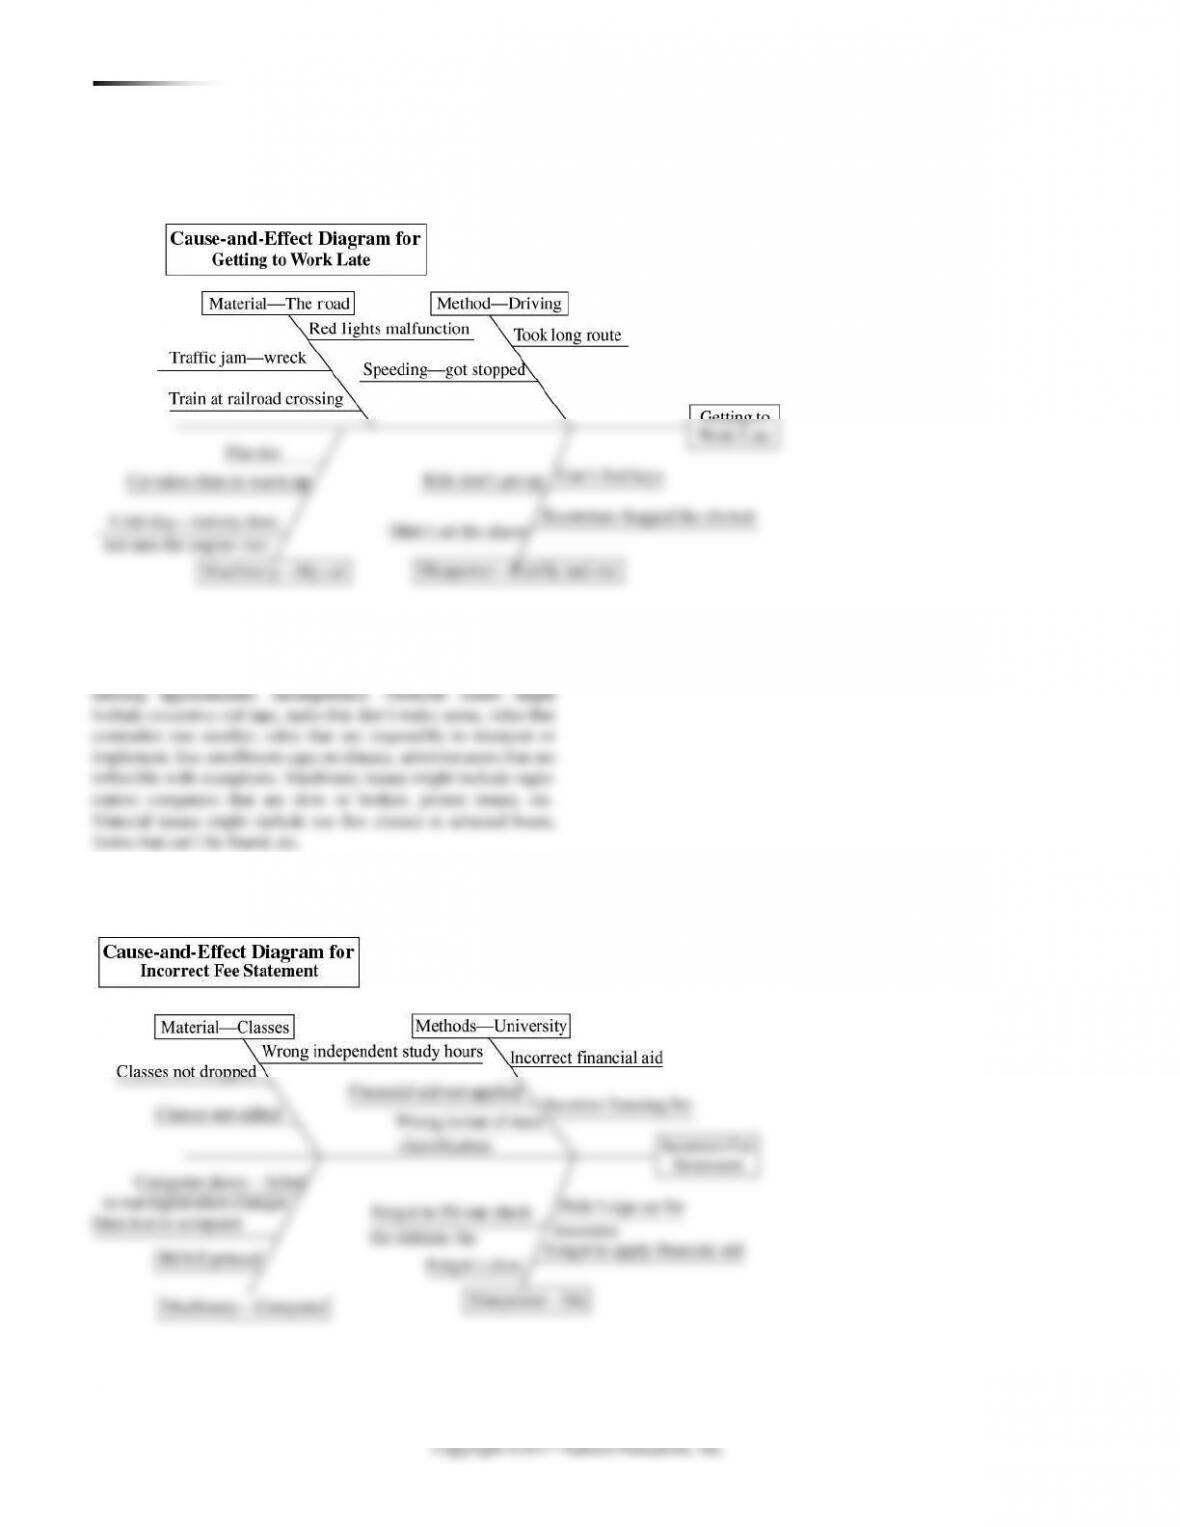
6.10 Student answers will depend upon how broadly they define
“registration.” (Is fee payment included? Is academic advising
included?) Manpower issues might include rudeness, lateness,
6.11 A potential chart might look like that shown below. Each
student will brainstorm different bones in the chart, depending on
the particular experiences and systems of the situation.
6.9 Depending on the type of student body, the response could
vary. A typical chart might look like the following:
Copyright ©2017 Pearson Education, Inc.
6.14