Unlock document.
This document is partially blurred.
Unlock all pages and 1 million more documents.
Get Access
3
C H A P T E R
Project Management
DISCUSSION QUESTIONS
include:
◼ When will the entire project be completed?
◼ Which are the critical activities or tasks in the project; that
is, the activities that will delay the entire project if com-
5. WBS is a hierarchical subdivision of effort required to
6. A Gantt chart is a visual device that shows the duration of tasks
in a project. It is a low-cost means of ensuring that (1) all activities
10. Activity times used in PERT are assumed to be described by
a beta probability distribution. Given optimistic (a), pessimistic
(b), and most likely (m) completion times, average or expected
time is given by:
16 CHAPTER 3 PRO J E C T MA N A G E M E N T
12. The critical path is the shortest time possible for the completion
13. Dummy activities have no time duration. They are inserted
14. They are (1) optimistic time (a), an estimate of the minimum
time an activity will require; (2) most likely time (m), an estimate of
15. No. In networks, there is no possibility that crashing a non-
critical task can reduce the project duration. Only critical tasks
17. Slack: the amount of time an activity can be delayed and not
affect the overall completion time of the whole project. Slack can
18. If there are a sufficient number of tasks along the critical path,
sum of the variances of all activities on the critical path.
normal distribution.
20. Waterfall approach: the project progresses smoothly, in a
projects run so late and so overbudget?
Students are expected to read about such projects and come
This protects the organization from a total loss should the massive
project never be completed.
1. Both A and H are critical activities. Describe the difference
between what happens on the graph when you increase A vs.
2. Activity F is not critical. By how many weeks can you in-
3. Activity B is not critical. By how many weeks can you in-
4. What happens when you increase B by 1 more week after it
CHAPTER 3 PRO J E C T MA NA G E M E N T 17
END-OF-CHAPTER PROBLEMS (problems with asterisks appear in MyOMLab only)
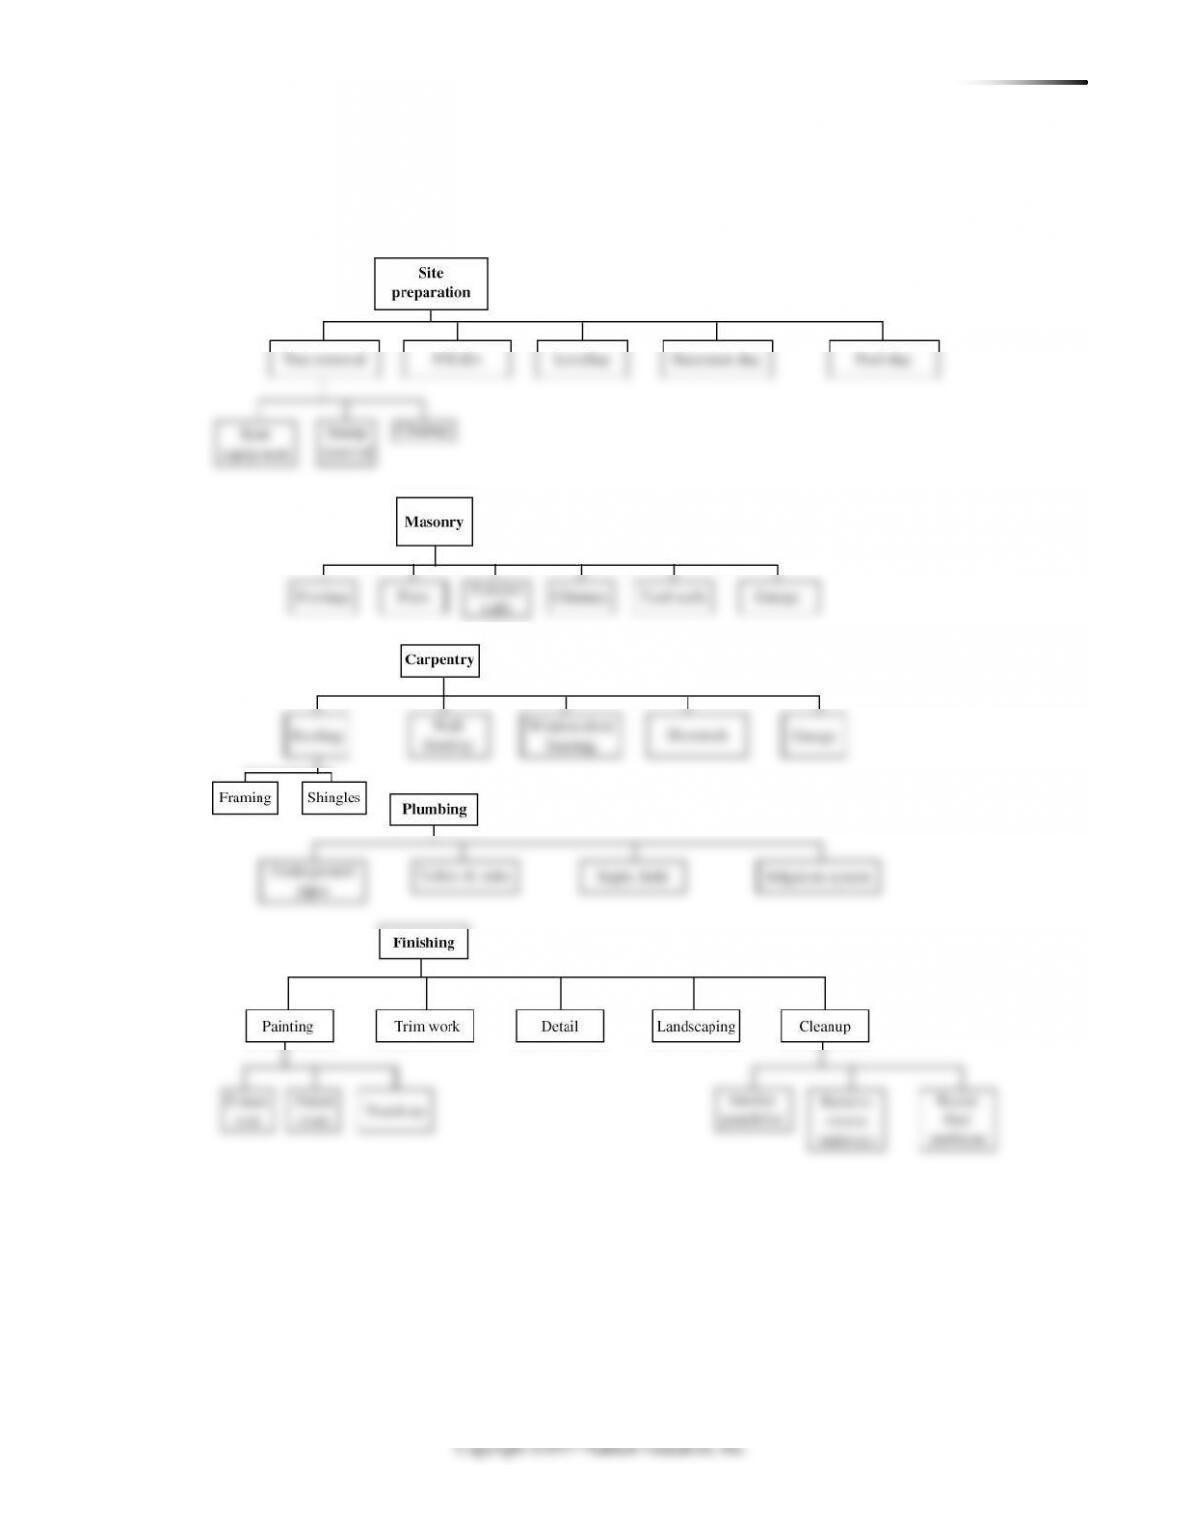
3.1 Some possible Level 3[(a)] and Level 4[(b)] activities for the house appear for each Level 2 activity below.
18 CHAPTER 3 PRO J E C T MA N A G E M E N T
3.2 Here are some detailed activities to add to Lawson’s WBS:**
1.1.1
Set initial goals for fund-raising
1.1.2
Set strategy including identifying sources and
solicitation
1.1.3
Raise the funds
1.2.1
Identify voters’ concerns
1.2.2
Analyze competitor’s voting record
1.3.3
Hire a staff
1.3.4
Hire media consultants
1.4.1
Identify filing deadlines
1.4.2
File for candidacy
1.5.1
Train staff for audit planning
NJ (2001): p. 722.
3.3
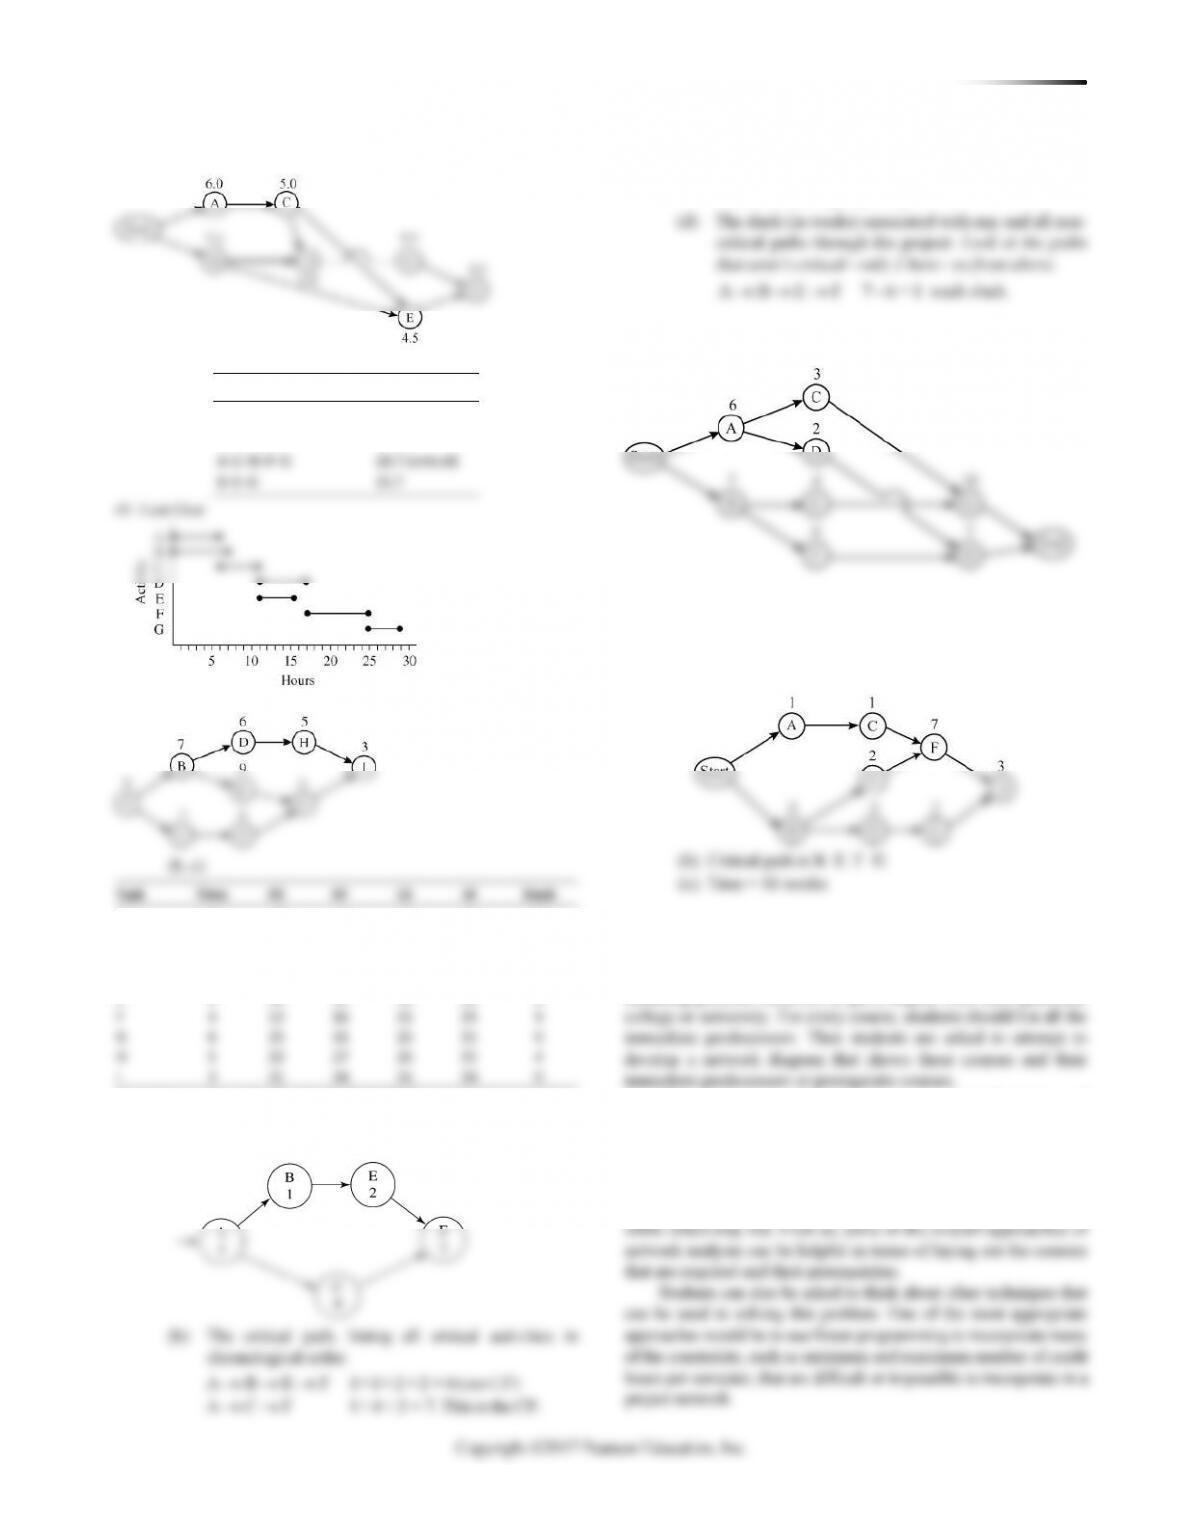
3.4 (a) AON network:
(b) AOA network:
3.5
3.6
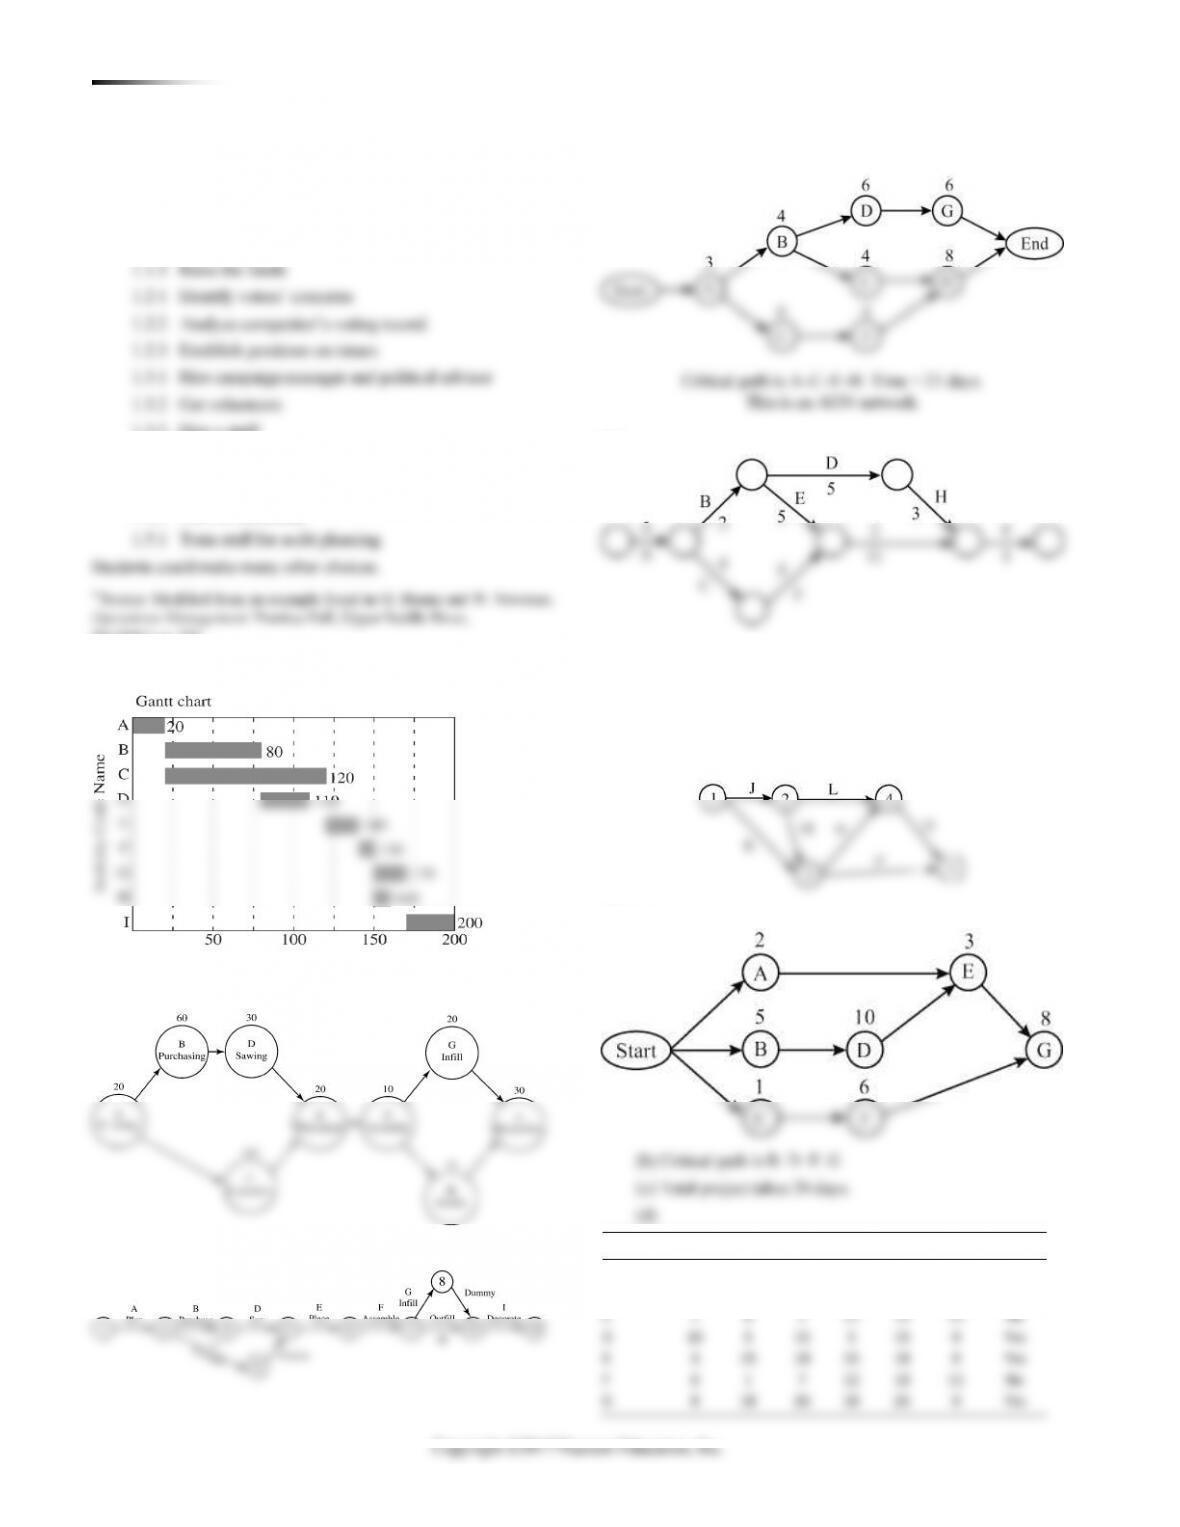
Critical path is A–C–F–G–I. Time = 21 days.
This is an AOA network.
3.7 The paths through this network are J–L–O, J–M–P,
J–M–N–O, K–P, and K–N–O. Their path durations are 23, 18, 22,
13, and 17. J–L–O is the critical path; its duration is 23 weeks.
3.8 (a)
Activity
Time
ES
EF
LS
LF
Slack
Critical
A
2
0
2
13
15
13
No
B
5
0
5
0
5
0
Yes
C
1
0
1
11
12
11
No
D
10
5
15
5
15
0
Yes
E
3
15
18
15
18
0
Yes
F
6
1
7
12
18
11
No
G
8
18
26
18
26
0
Yes
Hours
CHAPTER 3 PRO J E C T MA NA G E M E N T 19
3.9 (a)
(b, c) There are four paths:
Path
Time (hours)
A–C–E–G
19.5
B–D–F–G
24.9
A–C–D–F–G
28.7 (critical)
B–E–G
15.7
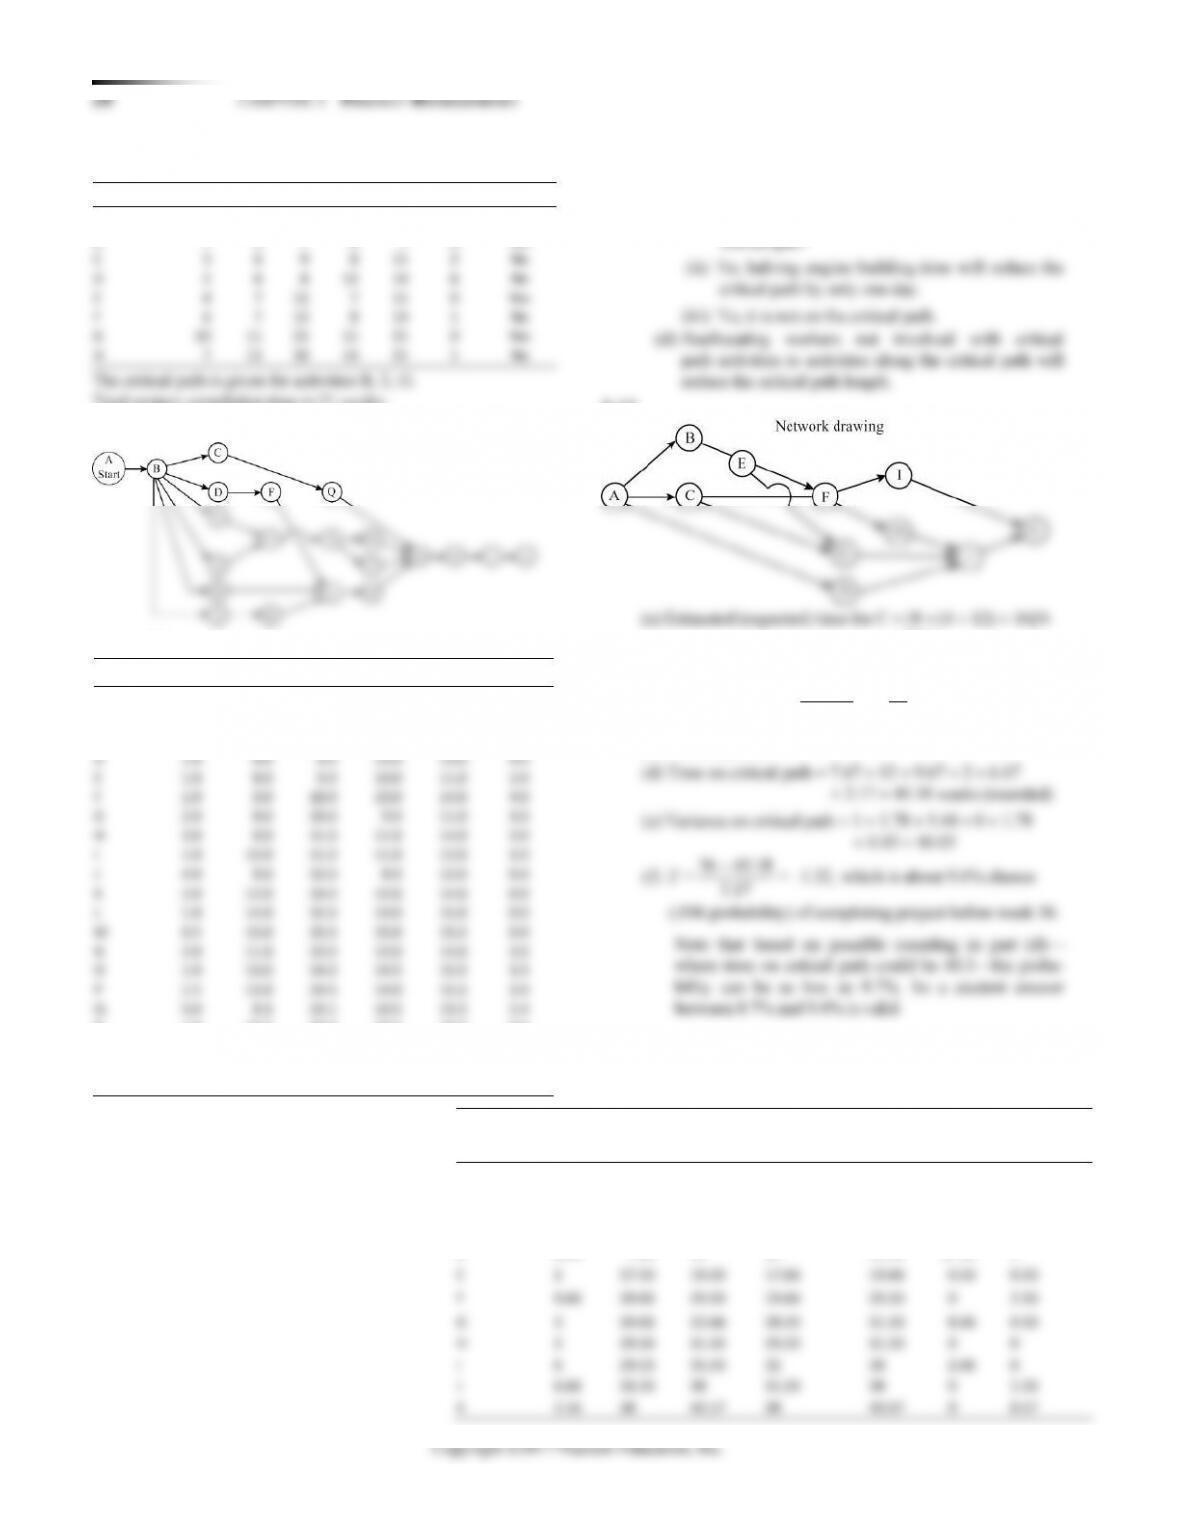
3.10 (a)
(c) The project duration (in weeks):
7 (This is the length of CP.)
3.12
Note: Activity times are shown as an aid for Problem 3.15. They are not
required in the solution to Problem 3.12.
3.13* (a)
CHAPTER 3 PRO J E C T MA NA G E M E N T 21
3.18
Activity
a
m
b
+ 4 +
t= 6
a m b
=−ba
6
Variance
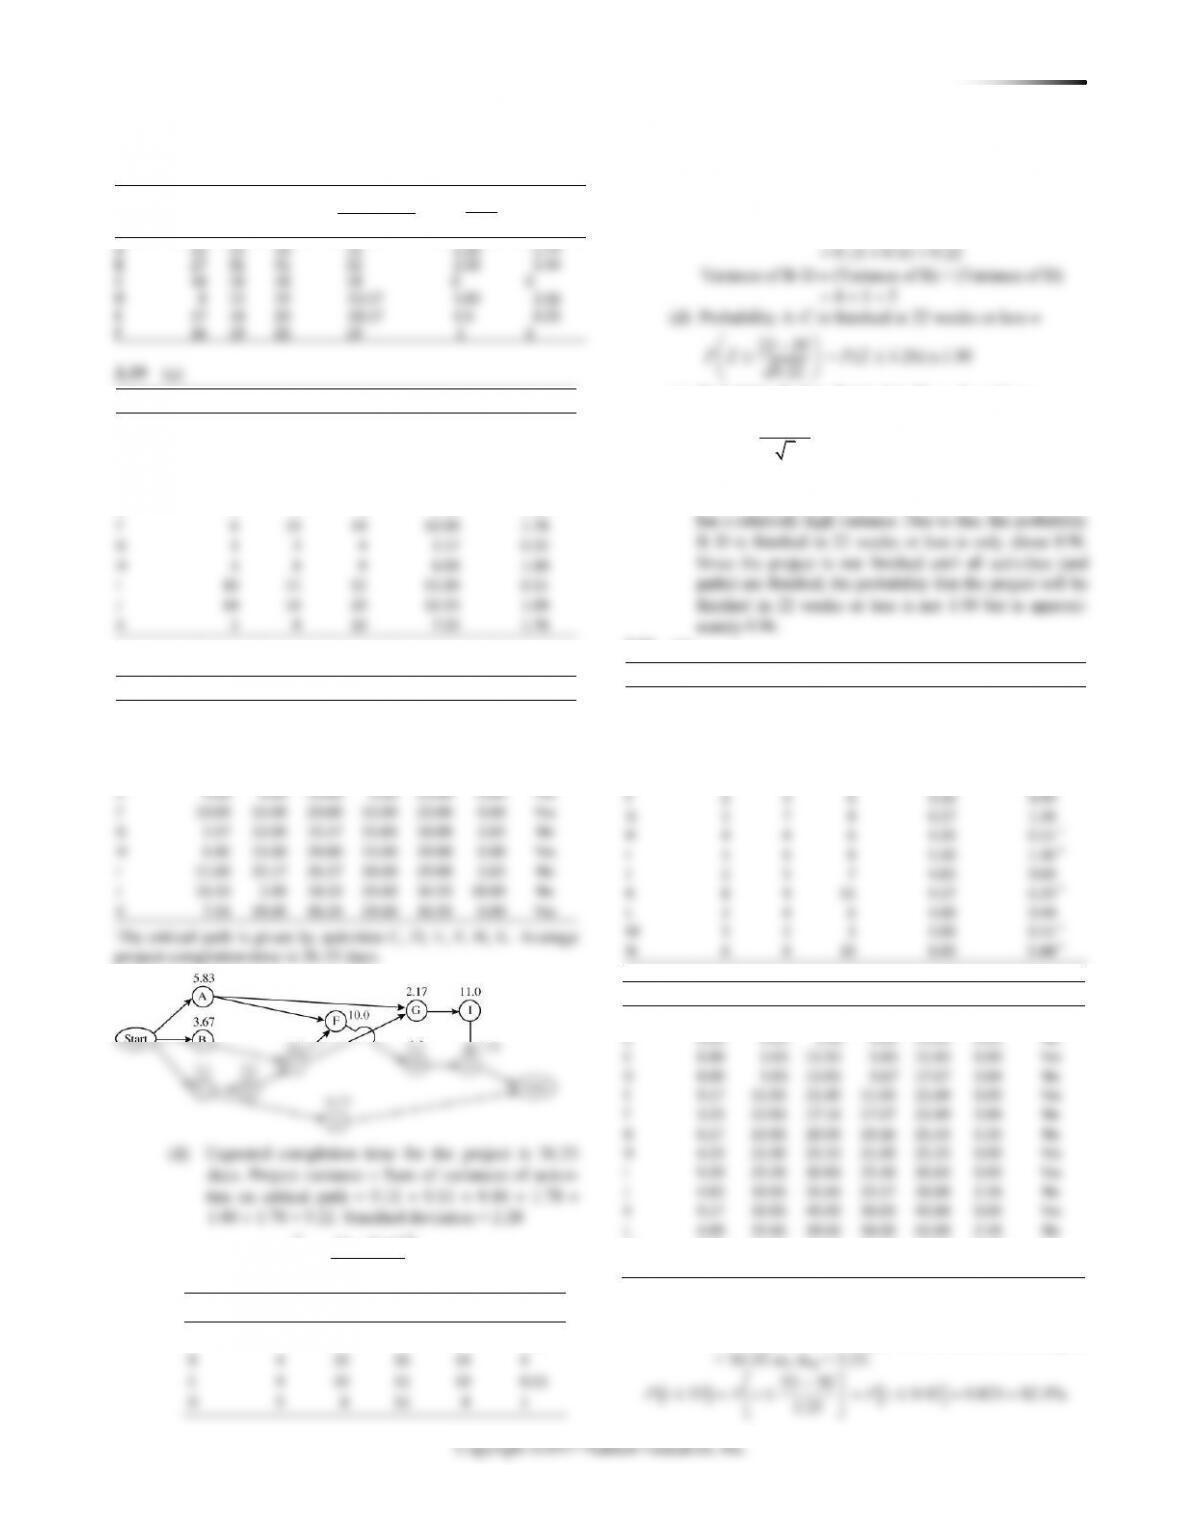
3.19 (a)
Activity
a
m
b
Expected
Variance
A
3
6
8
5.83
0.69
B
2
4
4
3.67
0.11
C
1
2
3
2.00
0.11
D
6
7
8
7.00
0.11
E
2
4
6
4.00
0.44
(b, c)
Activity
Time
ES
EF
LS
LF
Slack
Critical
A
5.83
0.00
5.83
7.17
13.00
7.17
No
B
3.67
0.00
3.67
5.33
9.00
5.33
No
C
2.00
0.00
2.00
0.00
2.00
0.00
Yes
D
7.00
2.00
9.00
2.00
9.00
0.00
Yes
E
4.00
9.00
13.00
9.00
13.00
0.00
Yes
F
10.00
13.00
23.00
13.00
23.00
0.00
Yes
G
2.17
13.00
15.17
15.83
18.00
2.83
No
H
6.00
23.00
29.00
23.00
29.00
0.00
Yes
I
11.00
15.17
26.17
18.00
29.00
2.83
No
J
16.33
2.00
18.33
20.00
36.33
18.00
No
K
7.33
29.00
36.33
29.00
36.33
0.00
Yes
( )
40 36.33
40 1.61 0.946
2.28
P t P z P z
−
= = =
3.20 (a)
Activity
a
m
b
te
Variance
A
9
10
11
10
0.11
D
5
8
11
8
1
(b) Critical path is A–C with mean (te) completion time
of 20 weeks. The other path is B–D, with mean com-
pletion time of 18 weeks.
(c) Variance of A–C = (Variance of A) + (Variance of C)
0.22
(e) Probability B–D is finished in 22 weeks or less =
−
= =
22 18 ( 1.79) 0.963
5
P Z P Z
(f) The critical path has a relatively small variance and will
almost certainly be finished in 22 weeks or less. Path B–D
3.21 (a)
Activity
a
m
b
Expected Time
Variance
A
4
6
7
5.83
0.25**
B
1
2
3
2.00
0.11
C
6
6
6
6.00
0.00**
D
5
8
11
8.00
1.00
E
1
9
18
9.17
8.03**
F
2
3
6
3.33
0.44
G
1
7
8
6.17
1.36
H
4
4
6
4.33
0.11**
I
1
6
8
5.50
1.36**
J
2
5
7
4.83
0.69
K
8
9
11
9.17
0.25**
L
2
4
6
4.00
0.44
M
1
2
3
2.00
0.11**
L
4.00
35.66
39.66
38.00
42.00
2.34
No
M
2.00
40.00
42.00
40.00
42.00
0.00
Yes
N
8.00
42.00
50.00
42.00
50.00
0.00
Yes
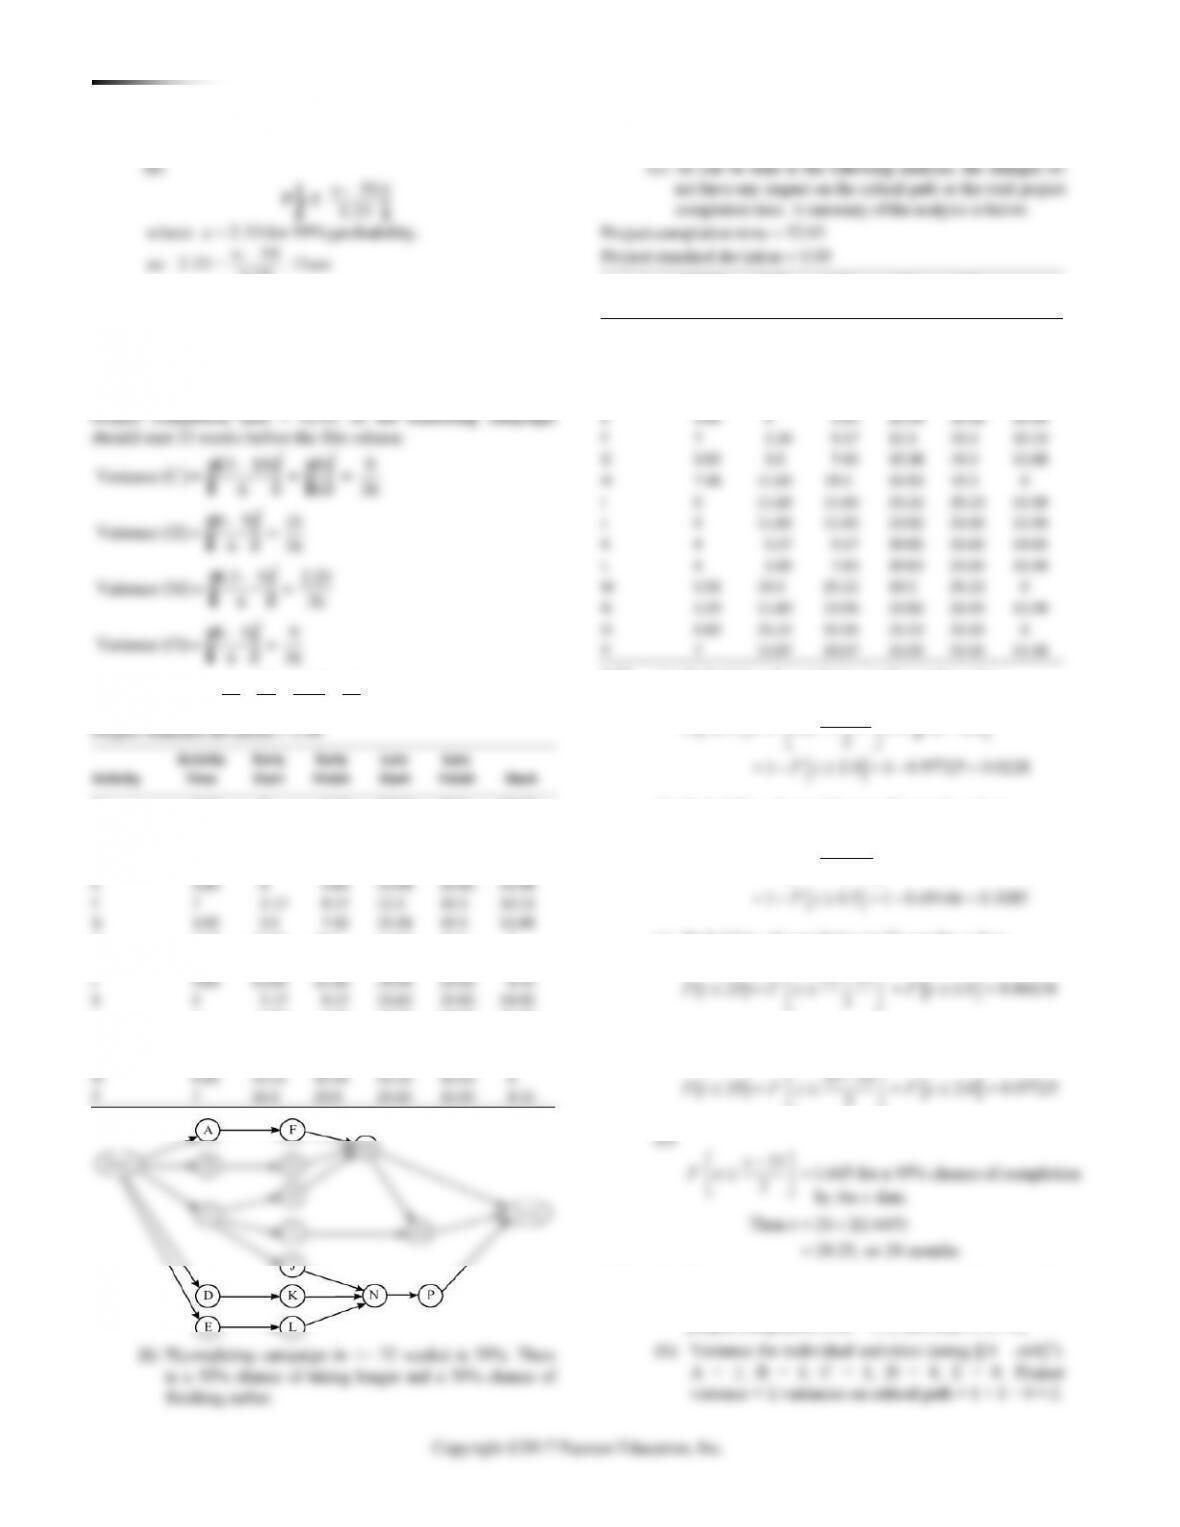
**The critical path is given by activities A, C, E, H, I, K, M, N.
Expected completion time is 50 days.
P(Completion in 53 days). Variances on critical path
3.25
22 CHAPTER 3 PRO J E C T MA N A G E M E N T
(b)
x 50
P z 3.25
x 50
so 2.33 = . Then
3.25
x = 50 + (2.33)(3.25) = 57.57 58 days
éù
êú
êú
ëû
-
£
-
@
3.22 (a) This project management problem can be solved using
PERT. The results are below. As you can see, the total project
completion time is about 32 weeks. The critical path consists of
activities C, H, M, and O.
÷
ç
èø
16
9 2.25 9
Project variance = + + + 1.00
36 36 36 36 »
(c) As can be seen in the following analysis, the changes do
not have any impact on the critical path or the total project
completion time. A summary of the analysis is below.
Project standard deviation = 1.00
Activity
Activity
Time
Early
Start
Early
Finish
Late
Start
Late
Finish
Slack
A
2.17
0
2.17
10.13
12.3
10.13
B
3.5
0
3.5
11.88
15.38
11.88
C
11.83
0
11.83
0
11.83
0
D
5.17
0
5.17
14.65
19.82
14.65
P
7
13.07
20.07
25.05
32.05
11.98
3.23 (a) Probability of completion is 17 months or less:
17 21
−


