
13
C H A P T E R
Aggregate Planning and S&OP
DISCUSSION QUESTIONS
1. Sales and Operations Planning (S&OP) balances resources
and forecast demand and aligns the organization’s competing
demand (from supply chain to final customer) while linking
2. S&OP teams are typically cross-functional because all
internal and external resource must be coordinated and integrated
3. Aggregate planning is concerned with the quantity and
encompasses a time horizon of 3 to 18 months.
LO 13.2: Define aggregate planning
LO 13.2: Define aggregate planning
AACSB: Reflective thinking
8. Mixed strategy is a planning approach in which two or more
options, such as overtime, subcontracting, hiring and layoff, etc.,
LO 13.3: Identify optional strategies for developing an aggregate
plan
AACSB: Reflective thinking
increments. The disadvantages are that a ready supply of skilled
labor is not always available, newly hired personnel must be
10. Aggregate planning in services differs from aggregate
planning in manufacturing in the following ways:
anticipation of higher demand at a later time.
■ Demand for services is often difficult to predict. Demand
variations may be more severe and more frequent.
12. Graphical aggregate planning methods, while based on trial

13. Limitations of the transportation method include that it does
not work well when one attempts to include the effect of hiring
14. Revenue (yield) management adds another set of decisions
reflect ways to maximize their yield (profit). Lead time
management is crucial. Moreover, many firms, including
customers have some sort of discount. The authors have
seen one figure that as high as 30 percent of restaurant
These revenue management techniques are
work.
From the customer’s perspective there is often
2. Most customers have come to accept revenue management
and take full advantage of the opportunities it affords. The
3. Many customers take exception to the variation in
tickets on flights that have a stopover in a city they
the positions on the revenue management curve that works
1. Each worker makes five units per day. If the number of
workers is reduced from 10 to 9, dropping the daily capacity, what
3. How low can the regular daily capacity get before overtime
4. How low can the regular daily capacity get before there will
not be enough capacity to meet the demand?
202 CHAPTER 13 AG G R E G A T E PL A N N I N G AND S &O P
END–OF–CHAPTER PROBLEMS (PROBLEMS WITH
ASTERISKS ARE IN MYOMLAB ONLY)
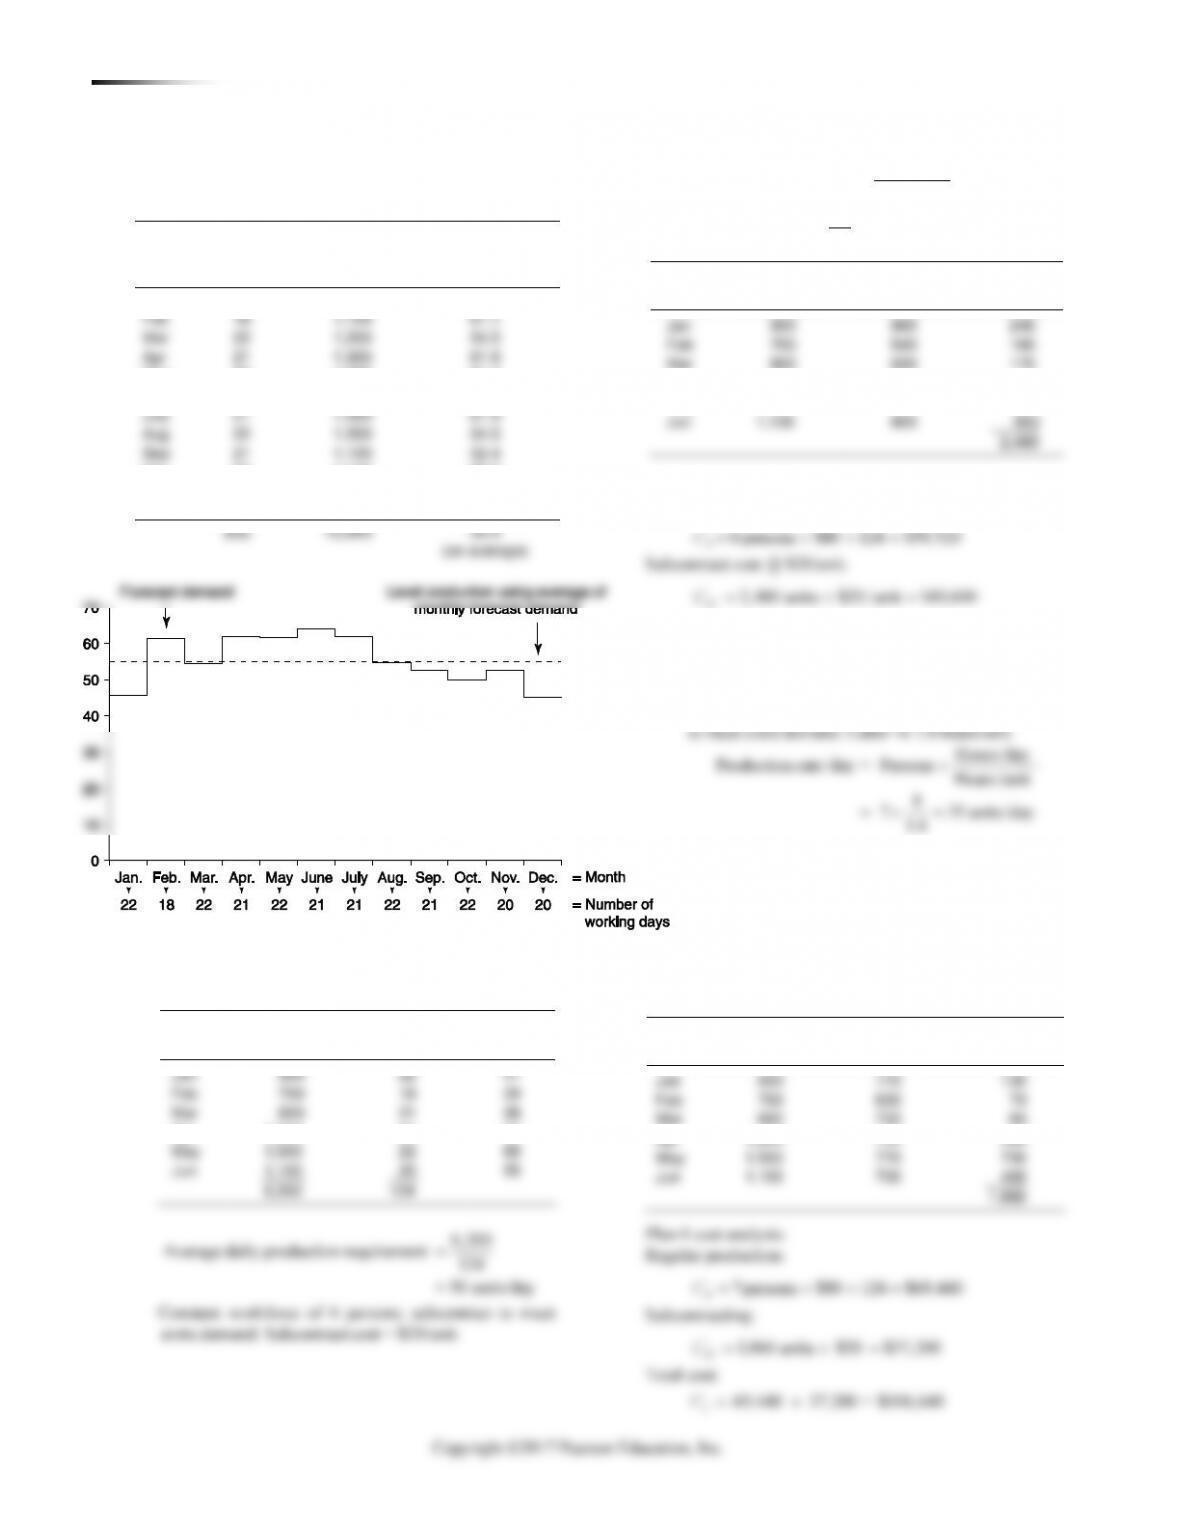
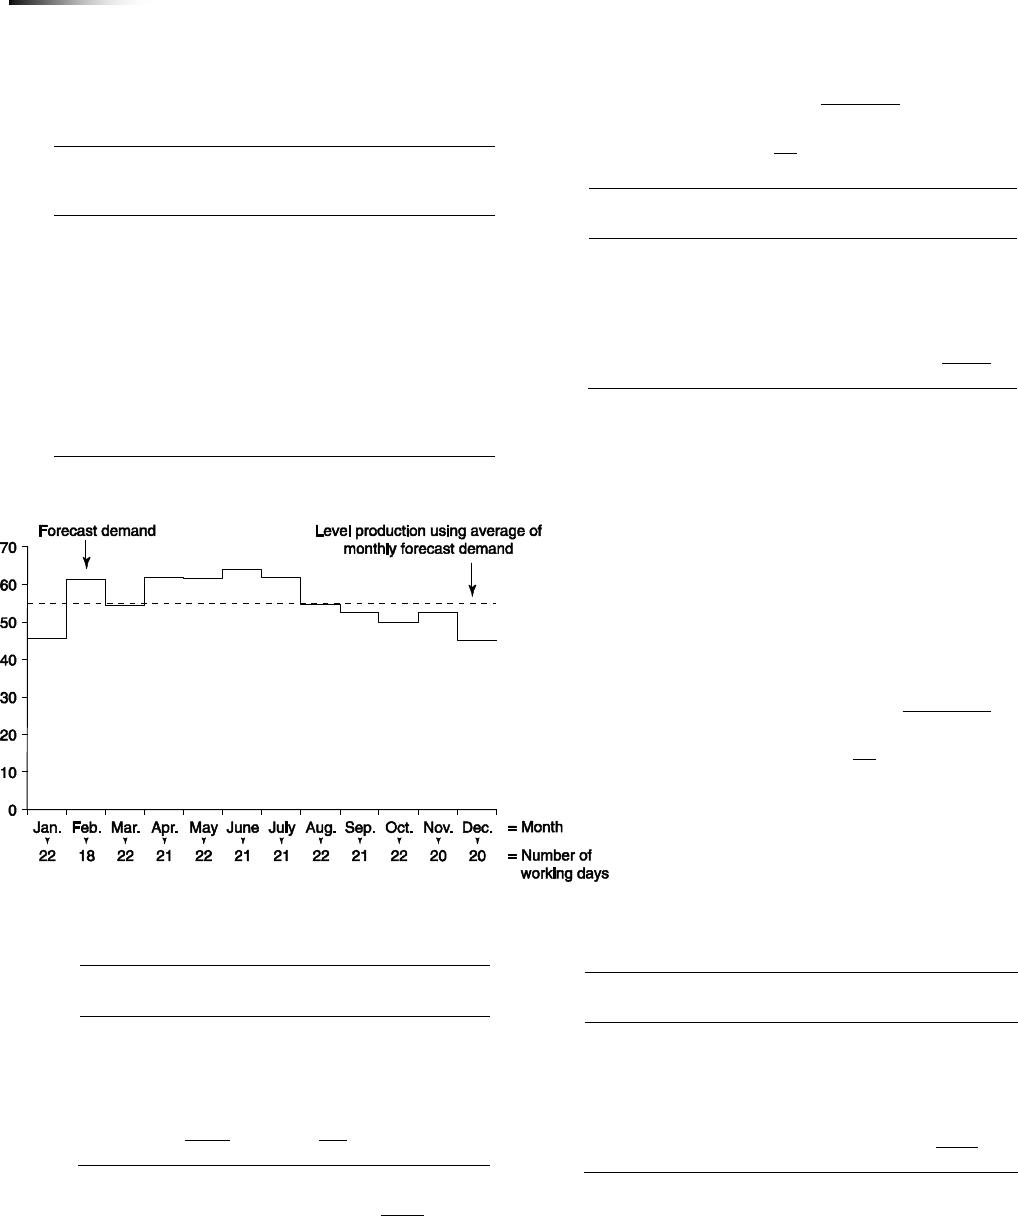
13.1
Month
Production
Days
Forecast
Demand
Needed
Production
Each Day
Jan
22
1,000
45.5
Feb
18
1,100
61.1
Mar
22
1,200
54.5
Apr
21
1,300
61.9
May
22
1,350
61.4
Jun
21
1,350
64.3
July
21
61.9
Aug
22
54.5
Sep
21
1,100
52.4
Oct
22
1,100
50.0
Nov
20
1,050
52.5
Dec
20
900
45.0
13.2 (a) Plan 5
Month
Expected
Demand
Production
Days
Demand
Per Day
Jan
22
41
Feb
18
39
Mar
21
38
Apr
1,200
21
57
May
1,500
22
68
Jun
1,100
20
55
Hours/day
Production rate/day Persons Hours/unit
8
6 30 units/day
1.6
=
= =
Month
Expected
Demand
Production
(@ 30/day)
Subcontract
Jan
660
240
Feb
540
160
Mar
630
170
Apr
1,200
630
570
May
1,500
660
840
Jun
1,100
600
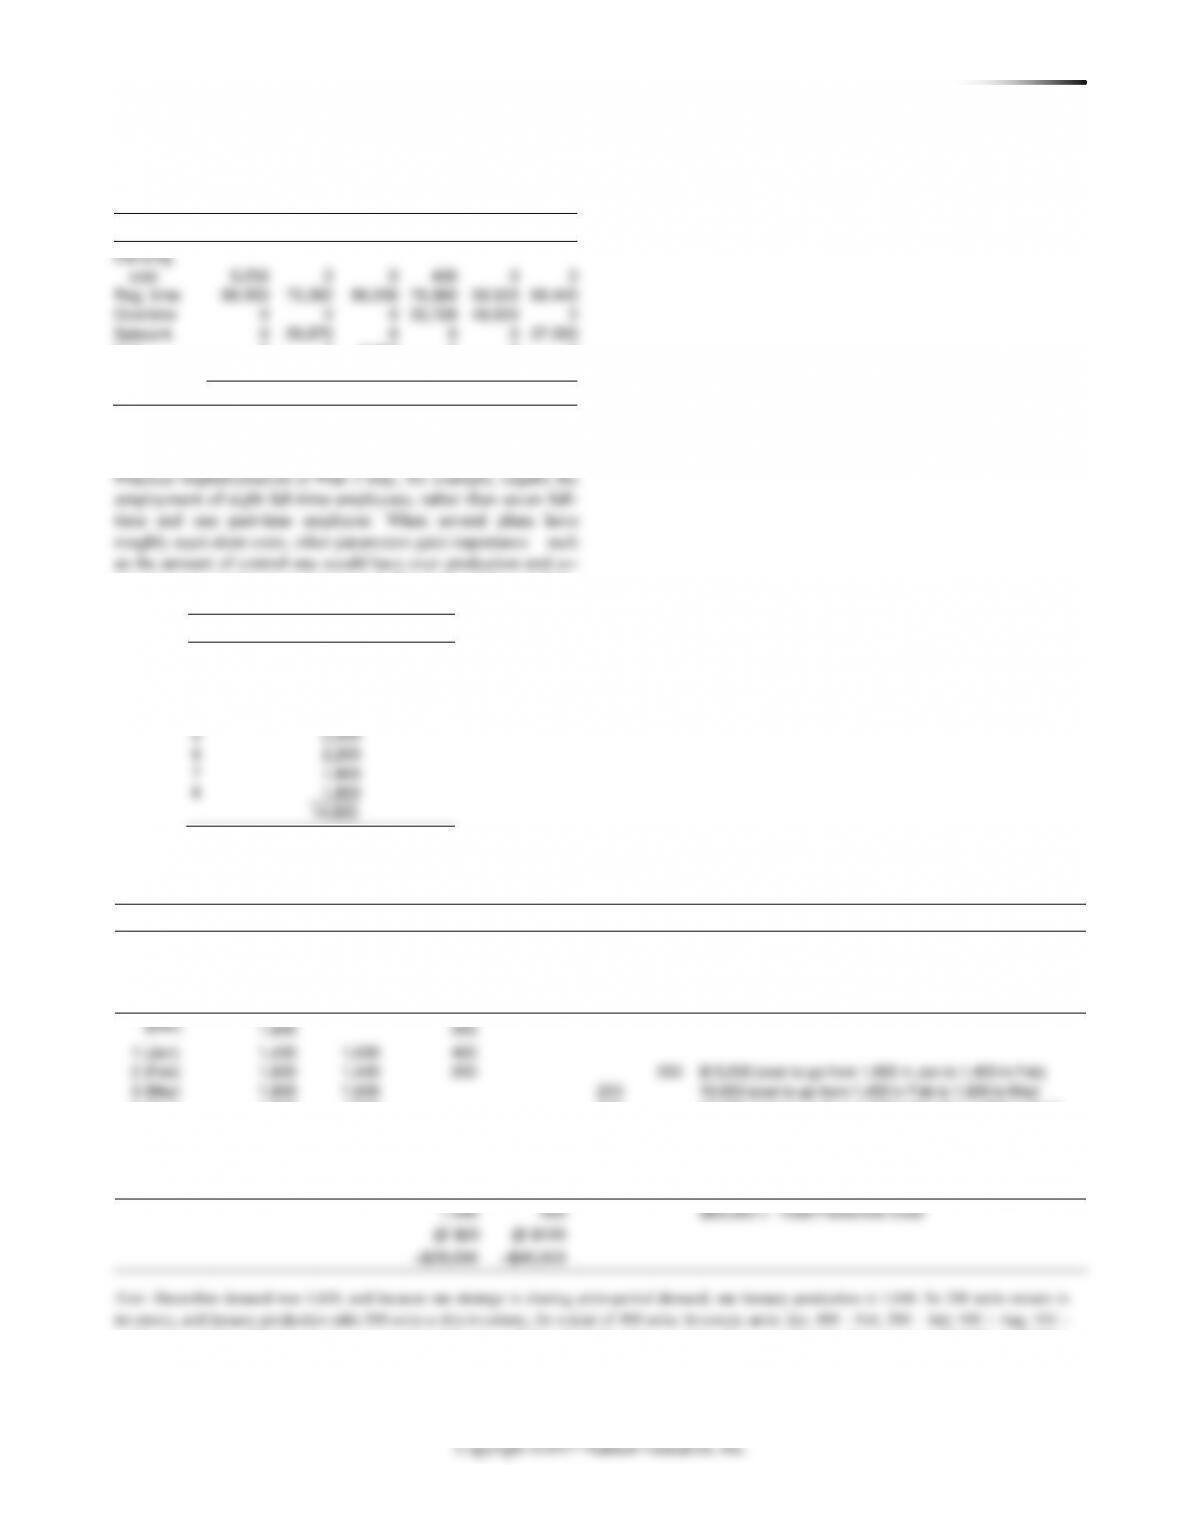
Plan 5 cost analysis:
Regular production:
Total cost:
= + =$59,520 $49,600 $109,120
T
C
(not preferable
to Plan 2 at $105,152, but preferable to Plan 4 at $113,488).
(b) Plan 6 constant workforce of 7 persons; subcontract
Month
Expected
Demand
Production
(@ 35/day)
Subcontract
Jan
Feb
Mar
Apr
1,200
May
1,500
Jun
1,100

CHAPTER 13 AG G R E G A T E PL A N N I N G A N D S&O P 203
(c) Plan 2 is still preferable, but Plan 6 has lower cost than Plan 5.
Comparing:
Plan 1
Plan 2
Plan 3
Plan 4
Plan 5
Plan 6
Carrying
cost
0
0
0
Reg. time
Overtime
0
0
0
Subcont.
0
0
0
Hire
0
0
9,000
0
0
0
Layoff
0
0
9,600
0
0
0
Total cost
108,450
105,152
117,800
113,488
109,120
106,640
Based simply upon total cost, Plan 2 is preferable. From a practi–
cal viewpoint, Plans 1, 5, and 6 will likely have equivalent costs.
cess wear on equipment and personnel. Plan 3 should be avoided.
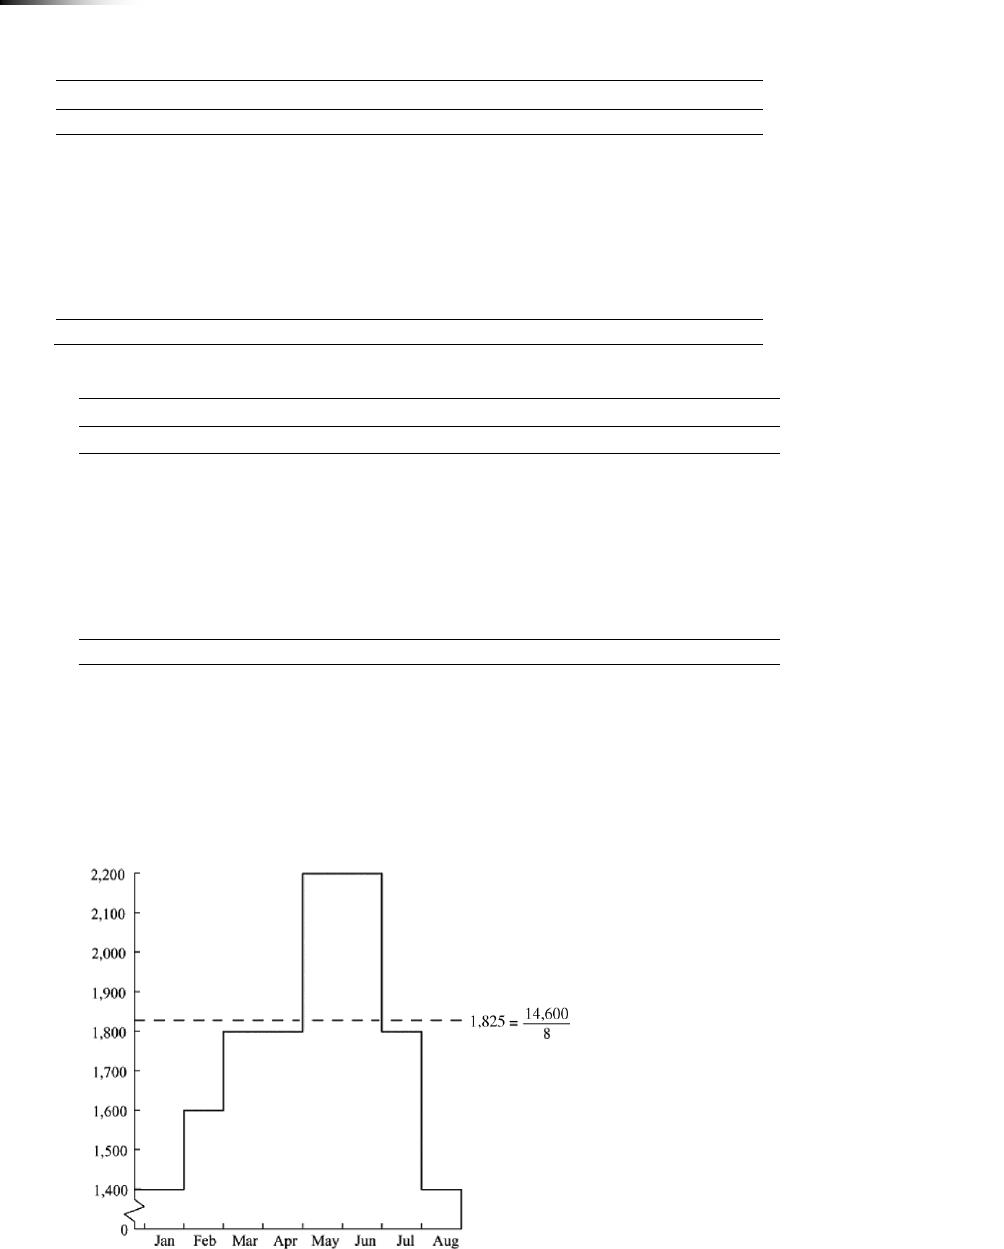
13.3
Period
Expected Demand
1
1,400
2
1,600
3
1,800
4
1,800
5
2,200
6
2,200
7
1,800
8
1,800
Plan A
Production
(Demand of
Previous
Inventory
Stockout
Hire
Layoff
Personnel
Period
Demand
Month)
(Units)
(Units)
(Units)
(Units)
Cost
(Dec)
1,600
200
1 (Jan)
1,400
1,600
400
2 (Feb)
1,600
1,400
200
200
$15,000 (cost to go from 1,600 in Jan to 1,400 in Feb)
3 (Mar)
1,800
1,600
200
10,000 (cost to go from 1,400 in Feb to 1,600 in Mar)
4 (Apr)
1,800
1,800
200
10,000 (cost to go from 1,600 in March to 1,800 in April)
5 (May)
2,200
1,800
400
6 (June)
2,200
2,200
400
20,000 (cost to go from 1,800 in May to 2,200 in June)
7 (July)
1,800
2,200
400
8 (Aug)
1,800
1,800
400
400
30,000 (cost to go from 2,200 in July to 1,800 in Aug)
1,400 units at $20 = $28,000. Stockout units: May 400 units at $100 = $40,000. Hiring and layoff costs = $85,000. Total costs = $28,000 + $40,000 +
$85,000 = $153,000.
204 CHAPTER 13 AG G R E G A T E PL A N N I N G AND S &O P
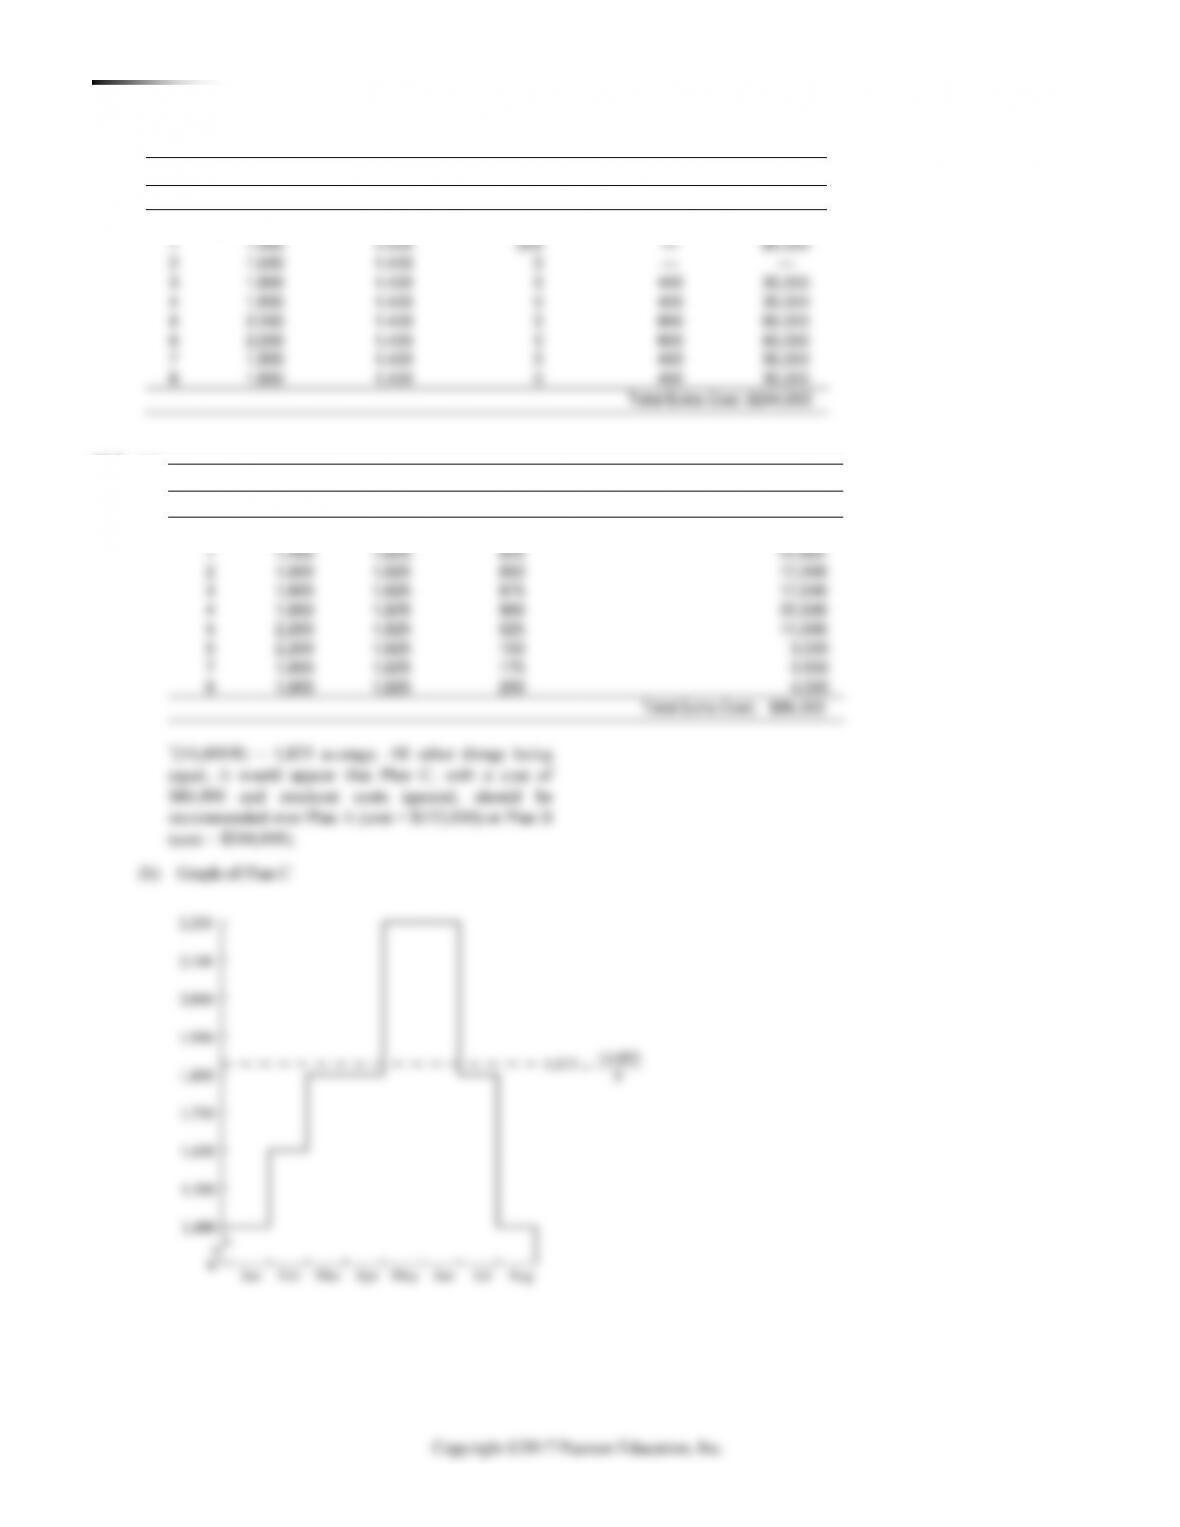
13.5 (a)
Plan C
Period
Demand
Production*
Ending Inv.
Stockouts (Units)
Extra Cost
0
200
1
1,400
625
2
1,600
850
17,000
3
1,800
875
17,500
4
1,800
900
22,500
5
2,200
525
11,000
6
2,200
150
7
1,800
175
8
1,800
200
13.4
Plan B
Period
Demand
Production
Ending Inv.
Subcon (Units)
Extra Cost
0
200
1
1,400
200
2
1,600
0
3
1,800
0
400
4
1,800
0
400
5
2,200
0
800
6
2,200
0
800
7
1,800
0
400
8
1,800
0
400

CHAPTER 13 AG G R E G A T E PL A N N I N G A N D S&O P 205
13.6 (a) Plan D: Maximum units in overtime = 0.20 1,600 = 320
Noting that the additional cost of a stockout is much
Plan D
Reg.
OT
End Inv.
Stockouts
Extra
Period
Demand
(Units)
(Units)
(Units)
(Units)
Cost
0
200
1
1,400
1,600
400
$8,000
2
1,600
1,600
400
3
1,800
1,600
200
4
1,800
1,600
—
0
5
2,200
1,600
320
—
280
44,000
6
2,200
1,600
320
—
280
44,000
7
1,800
1,600
200
—
10,000
8
1,800
1,600
200
—
10,000
1,040
1,000
Total Extra Cost: $128,000
Period
Demand
(Units)
(Units)
(Units)
(Units)
Cost
0
200
1
1,400
1,600
—
400
$8,000
2
1,600
1,600
—
400
8,000
3
1,800
1,600
80
280
9,600
4
1,800
1,600
320
400
24,000
5
2,200
1,600
320
120
18,400
6
2,200
1,600
320
160
32,000
7
1,800
1,600
200
10,000
8
1,800
1,600
200
10,000
Total Extra Cost: $120,000
(b)
Plan E
Period
Demand
Production
Subcont. (Units)
Ending Inv.
Extra Cost
0
200
1
1,400
1,600
400
$8,000
2
1,600
1,600
400
8,000
3
1,800
1,600
200
4,000
4
1,800
1,600
0
5
2,200
1,600
600
45,000
6
2,200
1,600
600
45,000
7
1,800
1,600
200
15,000
8
1,800
1,600
200
15,000
Total Extra Cost: $140,000
All other things being equal, it would appear that Plan D, with a cost of $128,000, should be
recommended over Plan E (cost = $140,000).
206 CHAPTER 13 AG G R E G A T E PL A N N I N G AND S &O P
Production per person per day: 8 hr/person 4 hours/disk
Therefore, each person can produce 2 disks per day,
or 40 disks per month.
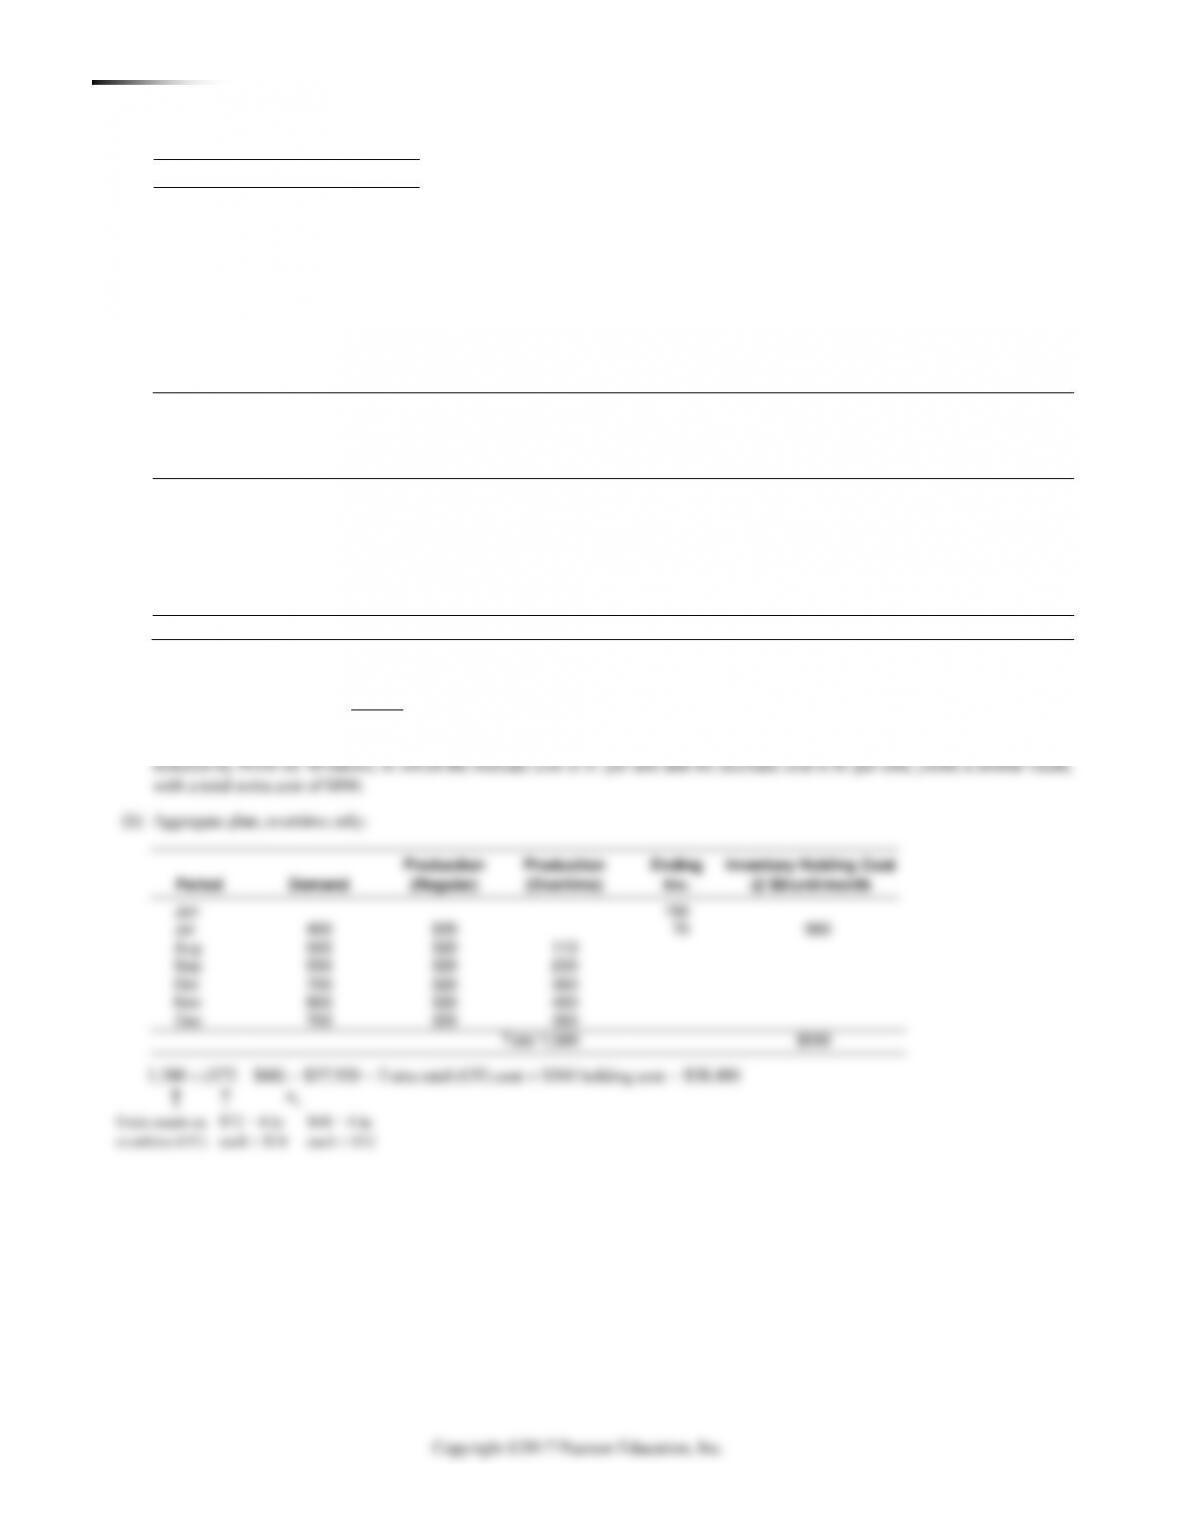
(a) Aggregate plan, hiring/layoff only:
Month
Expected Demand
Jul
400
Aug
500
Sep
550
Oct
700
Nov
800
Dec
700
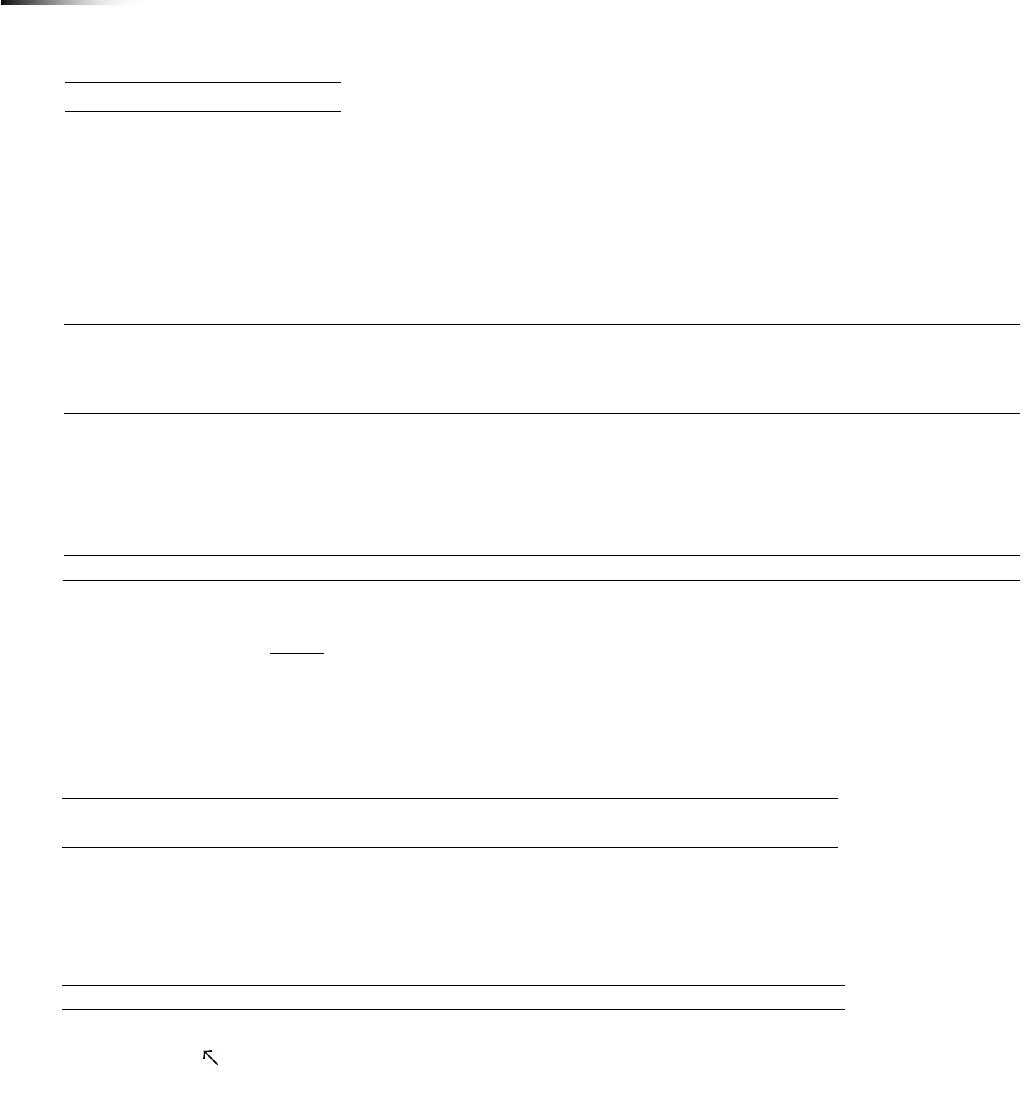
13.7
Beg.
Personnel
Inventory
Hours
Required
Production
Costs
Unit
Over
Units
Required
at 20 days
Personnel
Units
Over
Layoff
Hire: $40
Period
Demand
(or Short)
Required
at 4 Each
at 8 hrs
on Staff
Produced
(or Short)
Hire $40
$80
Layoff: $80
Jun
150
8
Jul
400
150
250
1,000
6.25
6
240
–10
2
$160
Aug
500
–10
510
2,040
12.75
13
520
10*
7
$280
Sep
550
10
540
2,160
13.50
14
560
20*
1
$40
Oct
700
20
680
2,720
17.00
17
680
0
3
$120
Nov
800
0
800
3,200
20.00
20
800
0
3
$120
Dec
700
0
700
2,800
17.50
18
720
20*
2
$160
Total Cost: $880
* Inventory (August = 10 and Sept. = 20 and Dec = 20): Holding cost = 50 × $8 = $400
Inventory cost = 50 × 8 = $400
Hiring/Layoff cost = 880
$1,280
NOTE: We assumed that, if the capacity of 50% or more of a worker was needed (was excess), one worker was hired (layed off).
Production
Inventory Holding Cost
150
400
500
550
700
800
700

13.8 Calculating added costs for various planning options to
complement Problem 13.7:
■ Holding: $8/unit/month
■ Subcontracting: $80/unit
Students should be encouraged to consider the long-range
implications of any aggregate planning strategy involving
13.9
$40
Jun
150
Jul
400
150
250
1,000
8.00
320
70
0
$560 = (70 8)
Aug
500
430
1,720
13.00
13
520
90
5
$920 = (90 8) + 200
Sep
550
460
1,840
13.00
13
520
60
0
$480 = (60 8)
Oct
700
640
2,560
18.00
18
720
80
5
$840 = (80 8) + 200
Nov
800
720
2,880
18.00
18
720
0
Dec
700
0
700
2,800
18.00
18
720
20
0
0
$160 = (20 8)
Total Extra Cost: $2,960
Month
Expected Demand
Jul
1,000
Aug
1,200
Sep
1,400
Oct
1,800
Nov
1,800
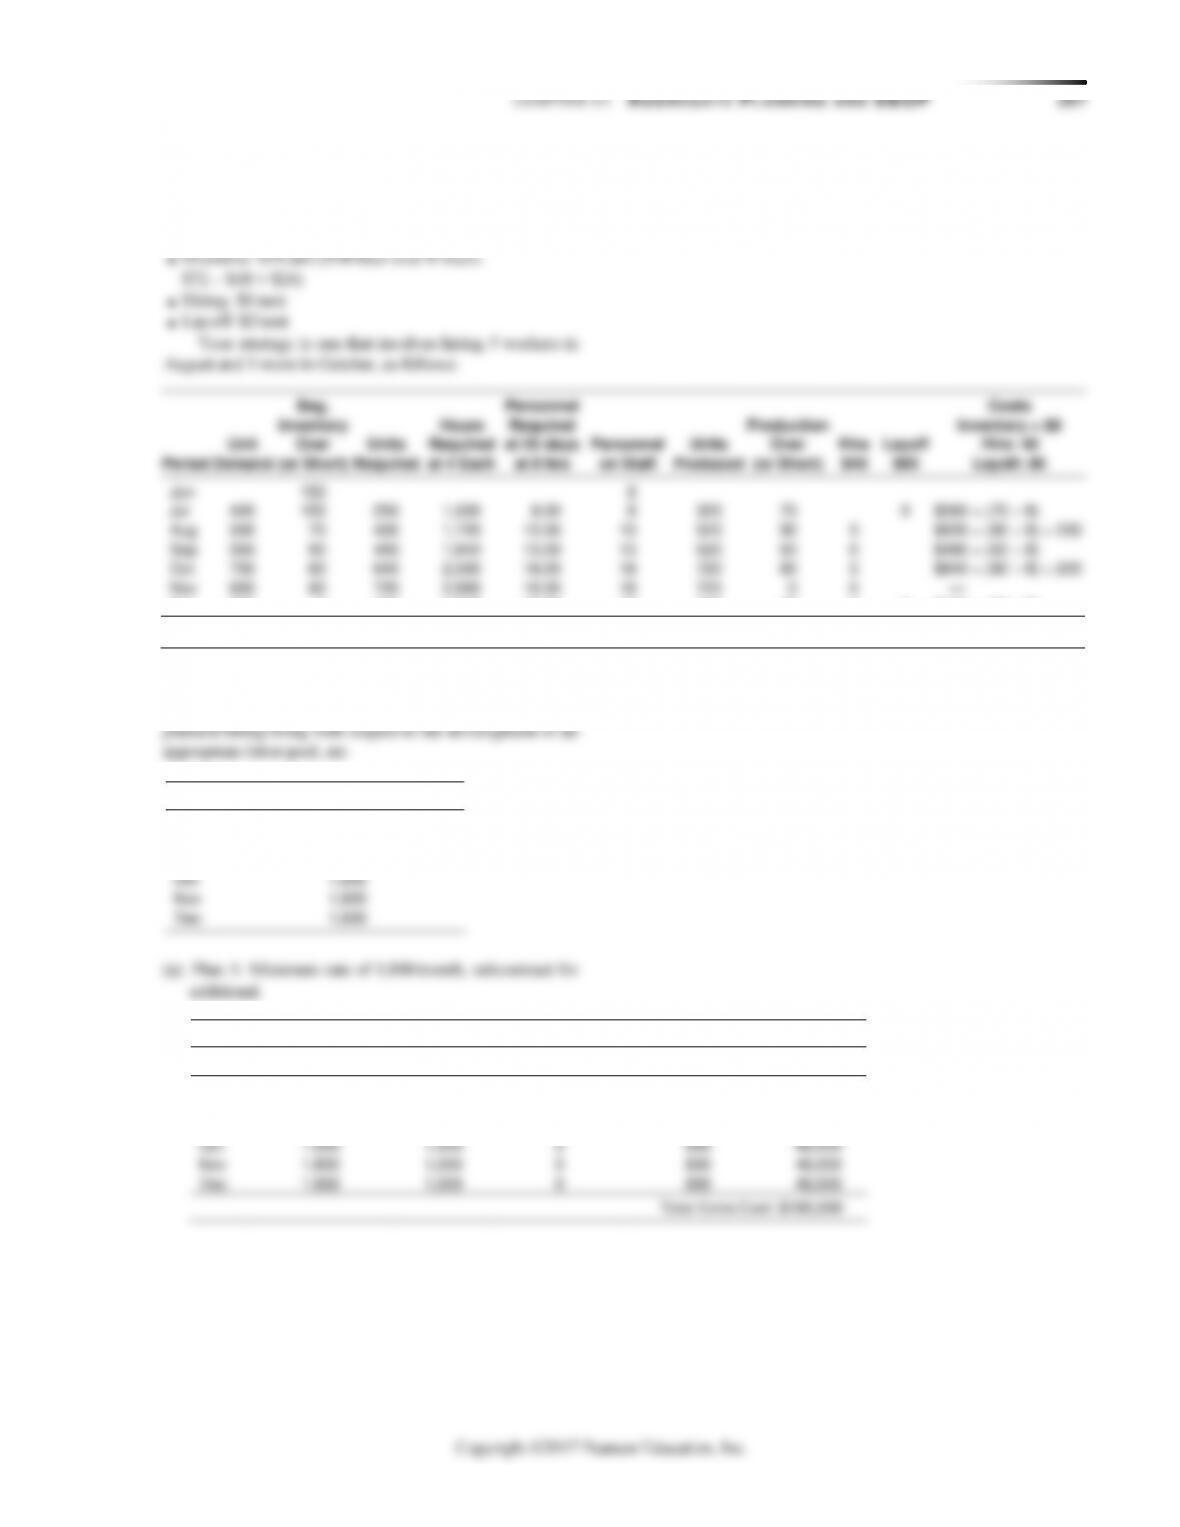
Plan A
Period
Demand
Production
Ending Inv.
Subcont. (Units)
Extra Cost
Jul
1,000
1,000
0
—
0
Aug
1,200
1,000
0
200
12,000
Sep
1,400
1,000
0
400
24,000
Oct
1,800
1,000
0
800
48,000
Nov
1,800
1,000
0
800
48,000
Dec
1,800
1,000
0
800
48,000

208 CHAPTER 13 AG G R E G A T E PL A N N I N G AND S &O P
If our object in comparing the plans is to identify
units. It is therefore inappropriate to compare directly
the results of Plan C with those of Plans A, B, and D.
the costs of Plan A and Plan C had it been in effect in
those plans.
■ Carryover of inventory: $25/unit
■ Overtime: $40/unit
■ Hiring: $30/unit
Costs (per unit)
Reg Time
=
$ 30
Overtime
=
Subcontract
=
not available
Holding
=
10
Hiring
=
Layoffs
=
Initial inventory
=
0
Units last period
=
1,500
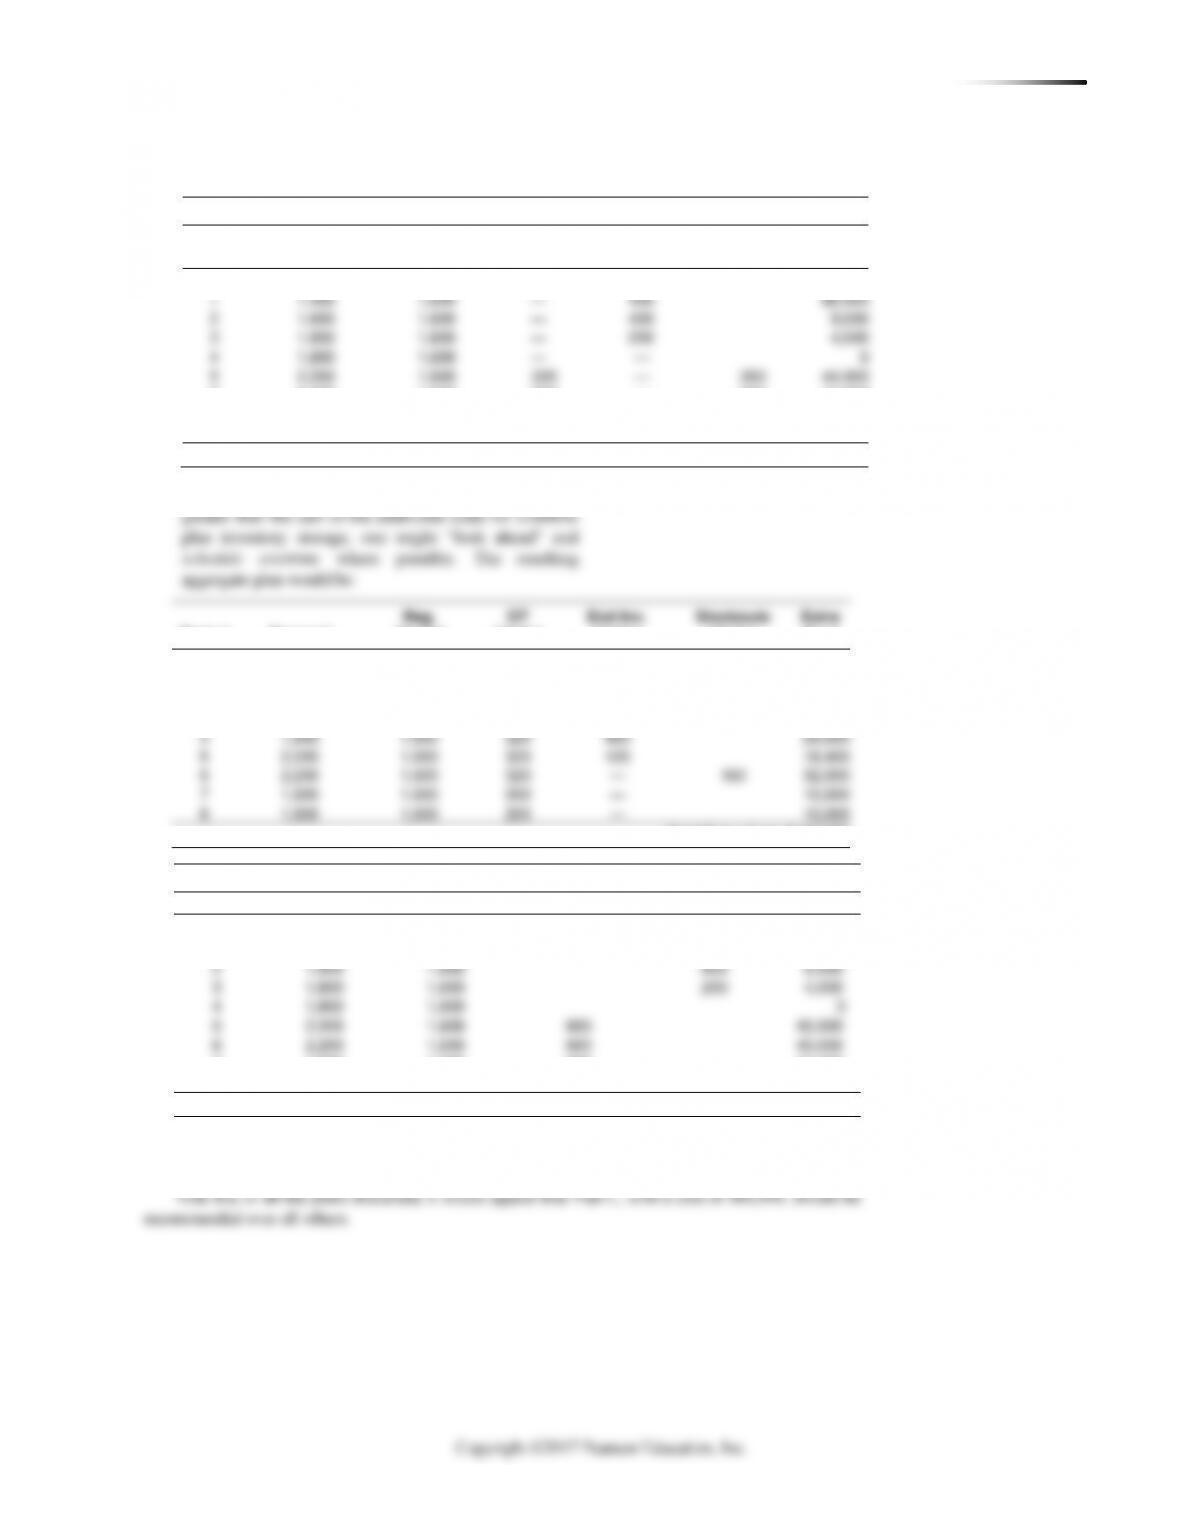
13.10 (a)
Plan C
Period
Demand
Production (Units)
Subcont. (Units)
Ending Inv.
Extra Cost
Jun
300
Jul
1,000
1,300
600
$15,000
Aug
1,200
1,300
700
17,500
Sep
1,400
1,300
600
15,000
Oct
1,800
1,300
100
2,500
Nov
1,800
1,300
0
24,000
Dec
1,800
0
30,000
OT (Units)
Jul
1,300
180
120
Aug
1,300
180
100
10,500
Sep
1,300
2,000
Oct
1,300
260
0
20,000
Nov
1,300
260
0
24,800
Dec
1,300
260
0
24,800
Total Extra Cost: $93,800
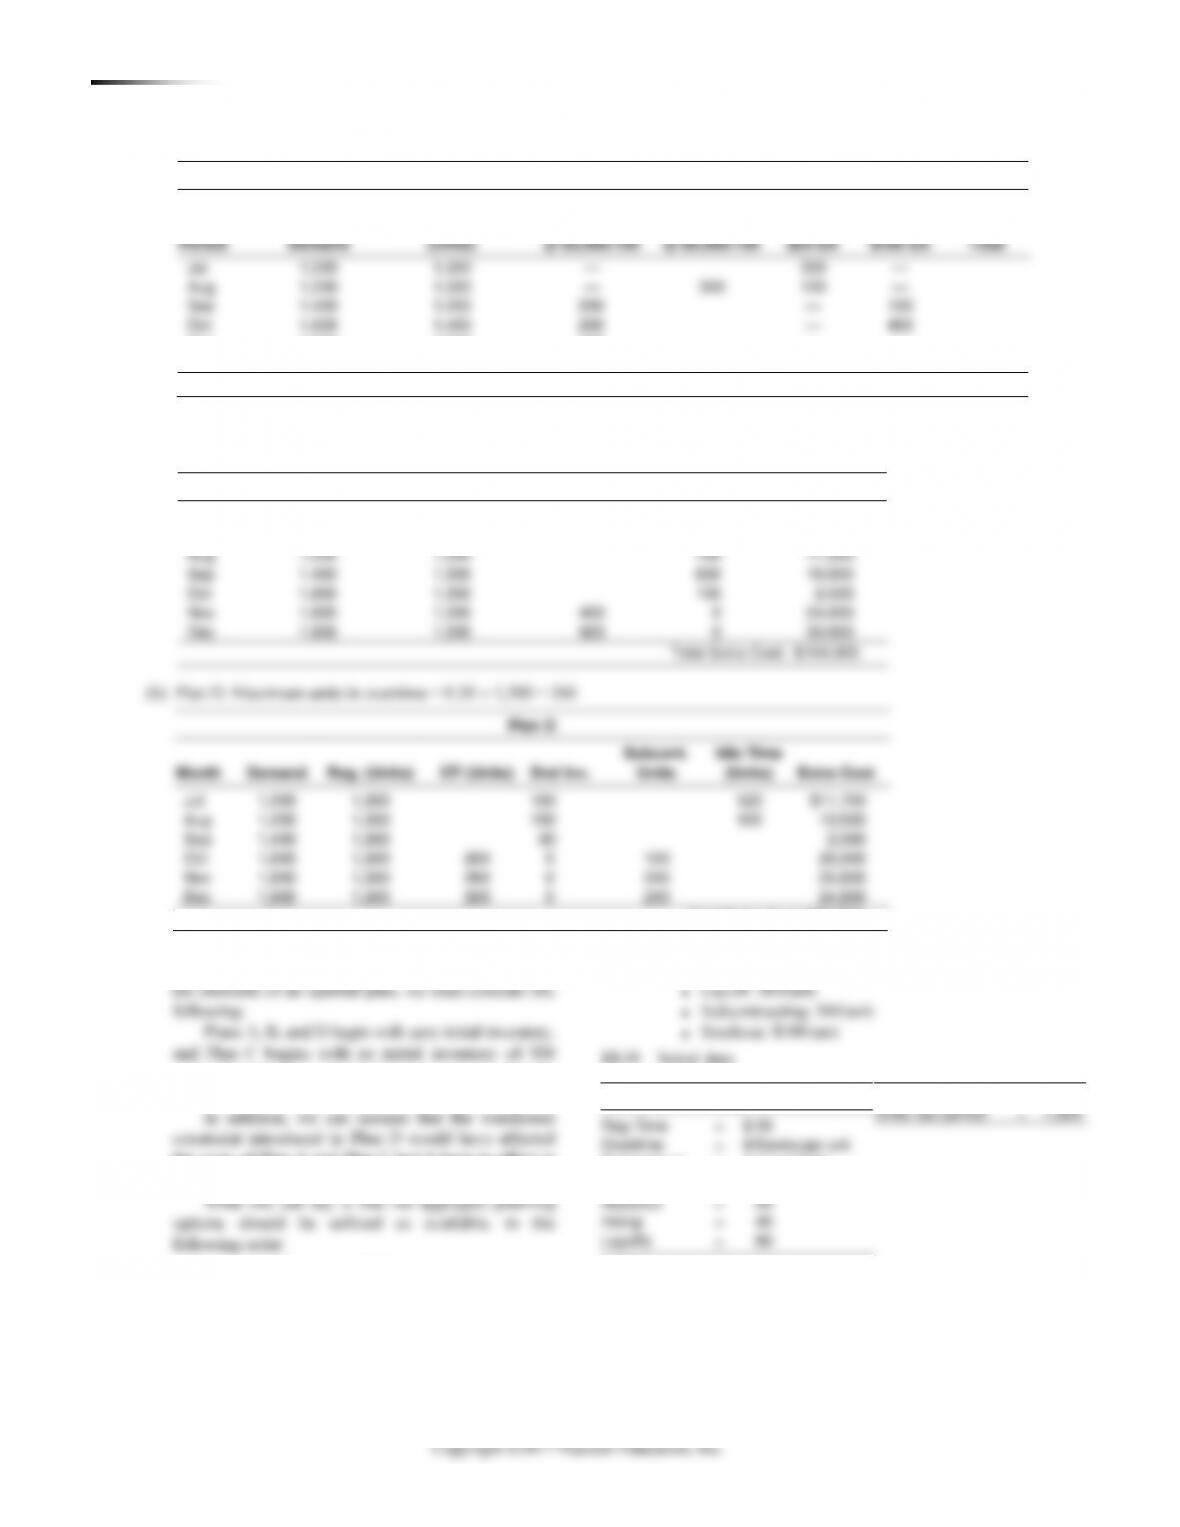
(b) Plan B is best because of cost. But note that production is only 8,500 units, while demand was 9,000.
Plan B: Vary workforce to match prior month’s demand.
Plan B
Production Plan
Hire (Units)
Layoffs (Units)
Inventory
(Units) @
Shortage
(Units) @
Jul
1,000
1,300
—
—
Aug
1,200
1,000
—
—
Sep
1,400
1,200
200
—
Oct
1,800
1,400
200
—
Nov
1,800
1,800
400
—
—
Dec
1,800
1,800
—
—
—
$24,000
$18,000
$10,000
$50,000
$102,000

CHAPTER 13 AG G R E G A T E PL A N N I N G A N D S&O P 209
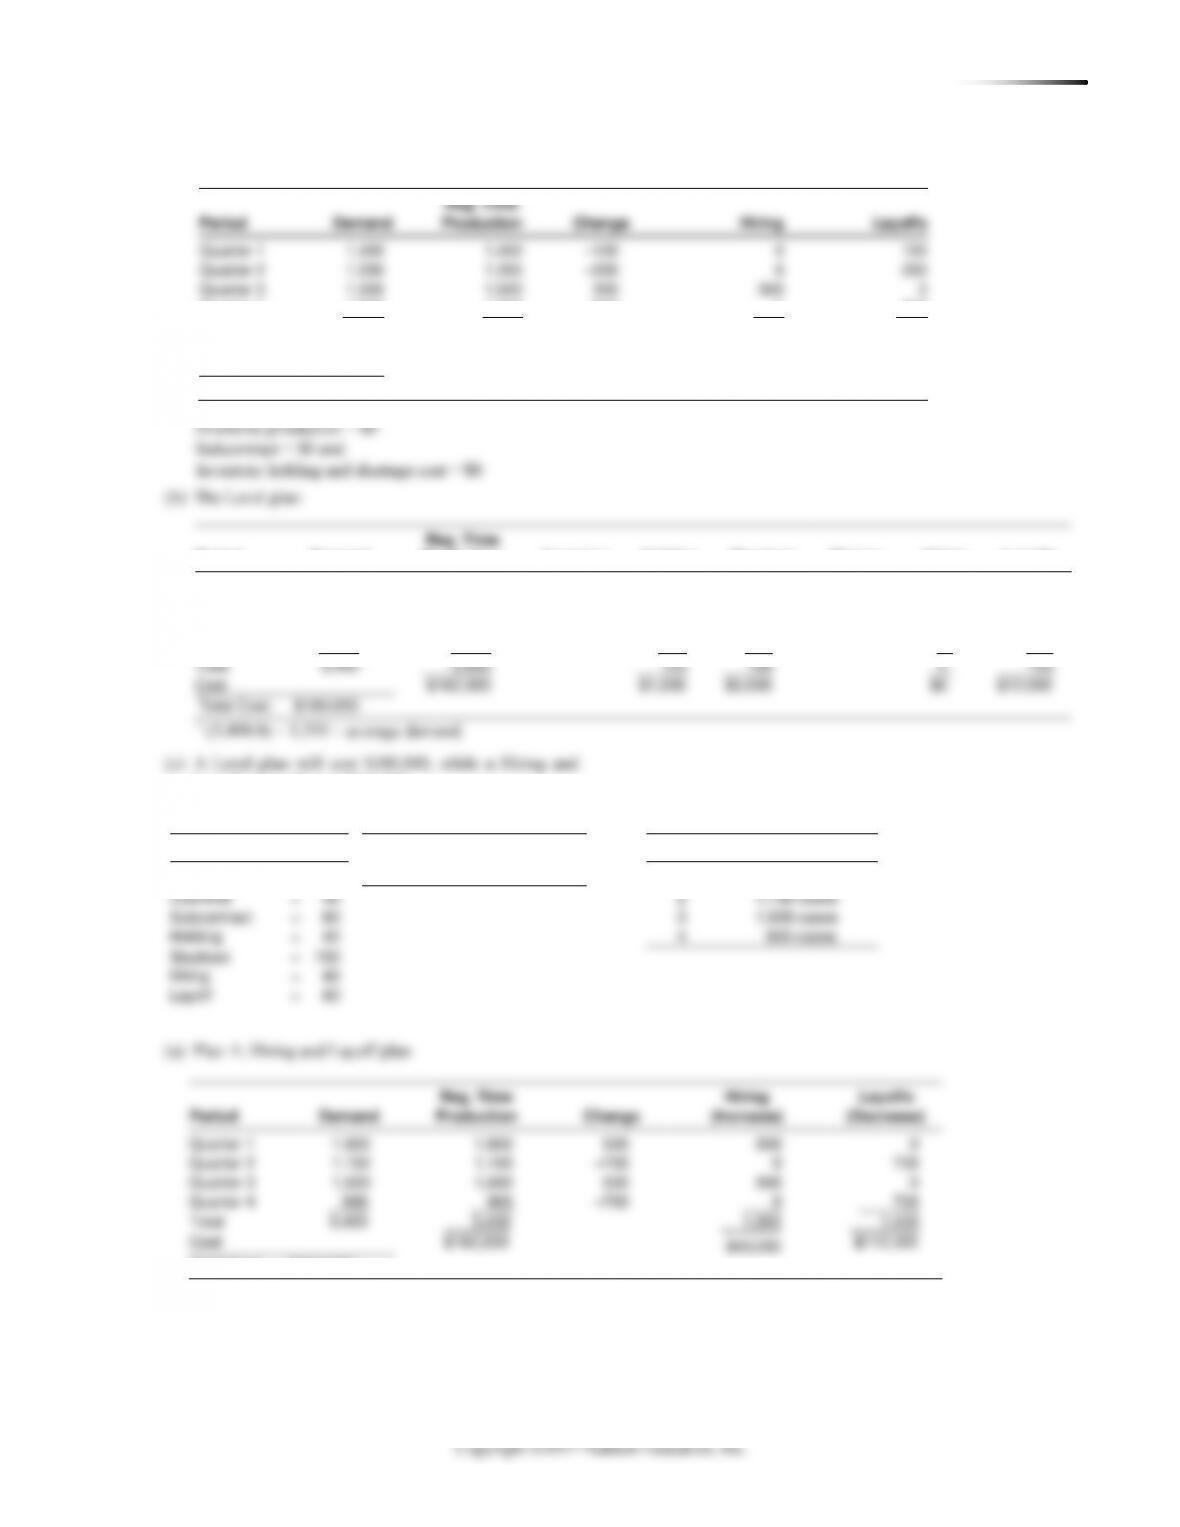
(a) The Hiring and Layoff plan:
Layoff plan will cost $214,000.
13.12 Initial data:
Period
Demand
Production
Inventory
Holding
Shortage
Change
Hiring
Layoffs
Quarter 1
1,400
1,350
–50
0
50
–150
0
150
Quarter 2
1,200
1,350
100
100
0
0
0
0
Quarter 3
1,500
1,350
–50
0
50
0
0
0
Quarter 4
1,300
1,350
0
0
0
0
0
Total
5,400
5,400
100
100
0
150
Cost
$162,000
$1,000
$5,000
$12,000
Costs (per case)
Initial inventory
=
0
Quarter
Forecast Demand
Reg time
=
$30
Production last period
=
1300
1
1,800 cases
Overtime
=
2
1,100 cases
Subcontract
=
3
1,600 cases
Holding
=
4
Stockout
=
150
Hiring
=
Layoff
Quarter 1
1,800
500
0
Quarter 2
1,100
Quarter 3
1,600
500
Quarter 4
900
Total
5,400
5,400
1,000
Cost
$162,000
$40,000
Total Cost: $314,000
Quarter 1
1,400
–100
100
Quarter 2
1,200
–200
200
Quarter 3
1,500
Quarter 4
1,300
1,300
–200
0
200
Total
5,400
5,400
300
500
@$30/unit
@$40/unit
@$80/unit
Cost
$162,000
$12,000
$40,000
Total Cost: $214,000