162 CHAPTER 10 HUMAN RE S O U R C E S , JO B DE S I G N , A N D WO R K ME A S U R E M E N T
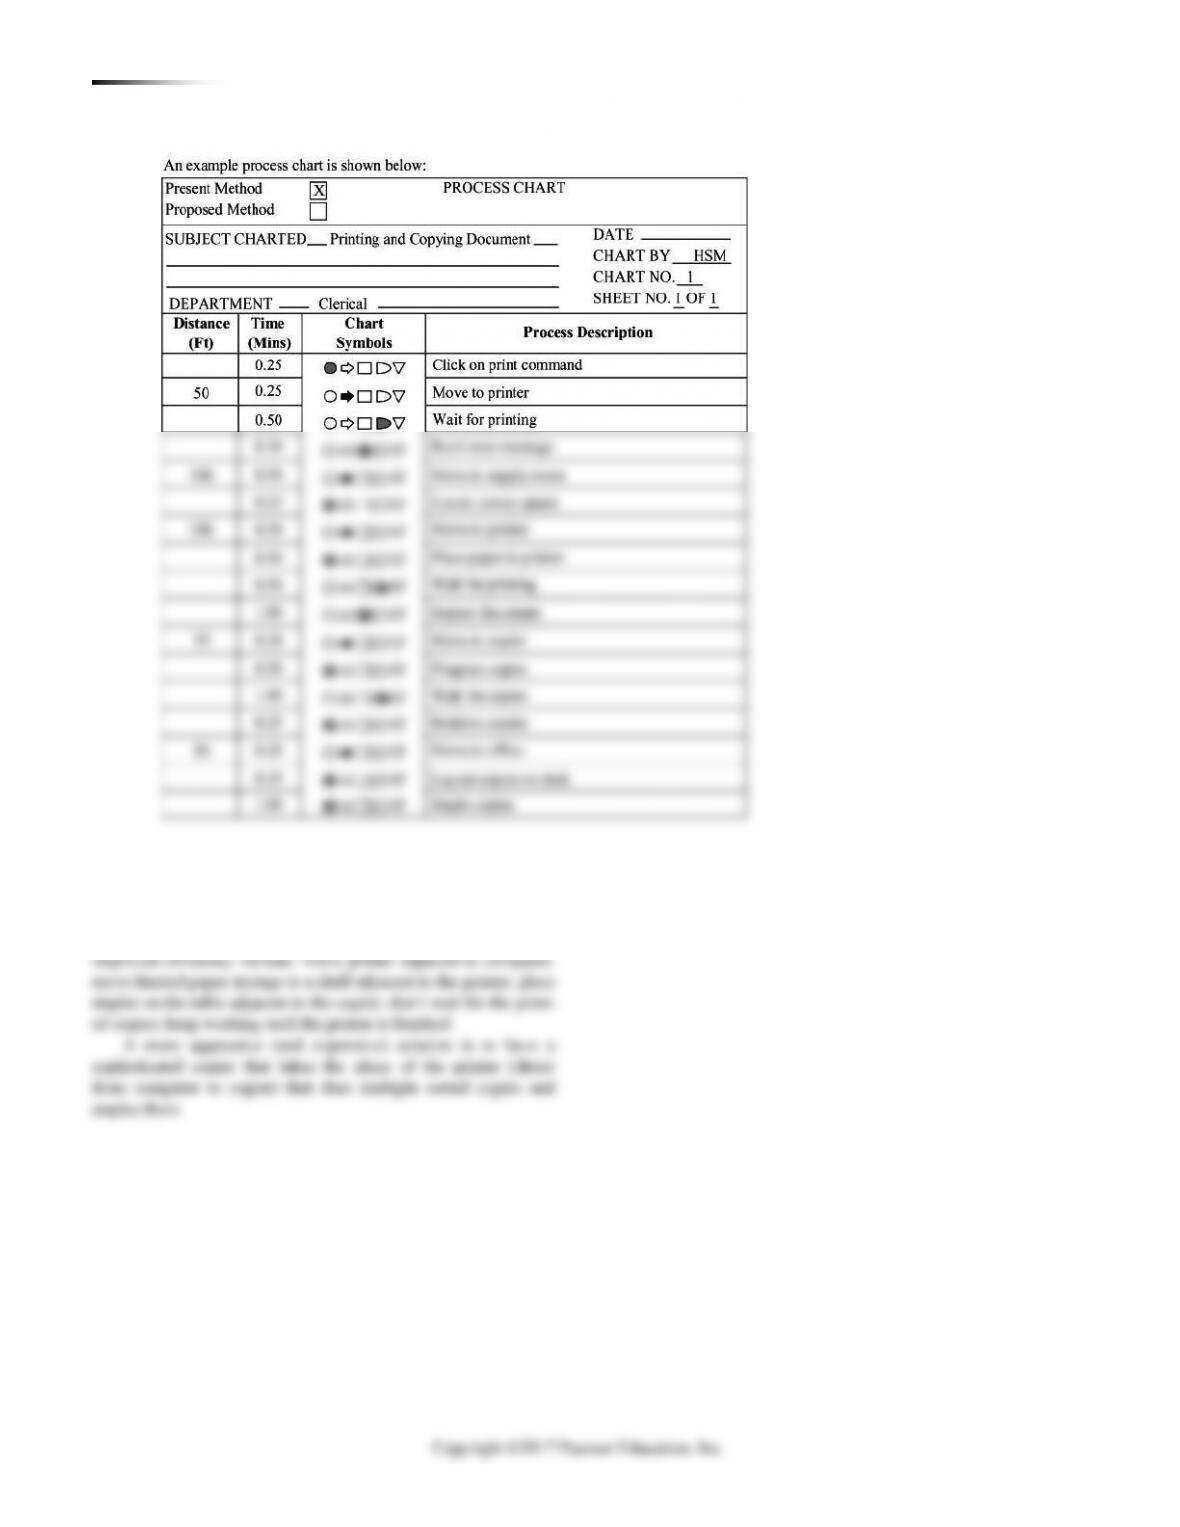
After analysis via a process chart, as above, encourage students to
use some imagination. Additional short elements (open package,
open printer tray, etc.) may be appropriate. Some ideas for
10.12#
CHAPTER 10 HUMAN RE S O U R C E S , JO B DE S I G N , AND WO R K ME A S U R E M E NT 163
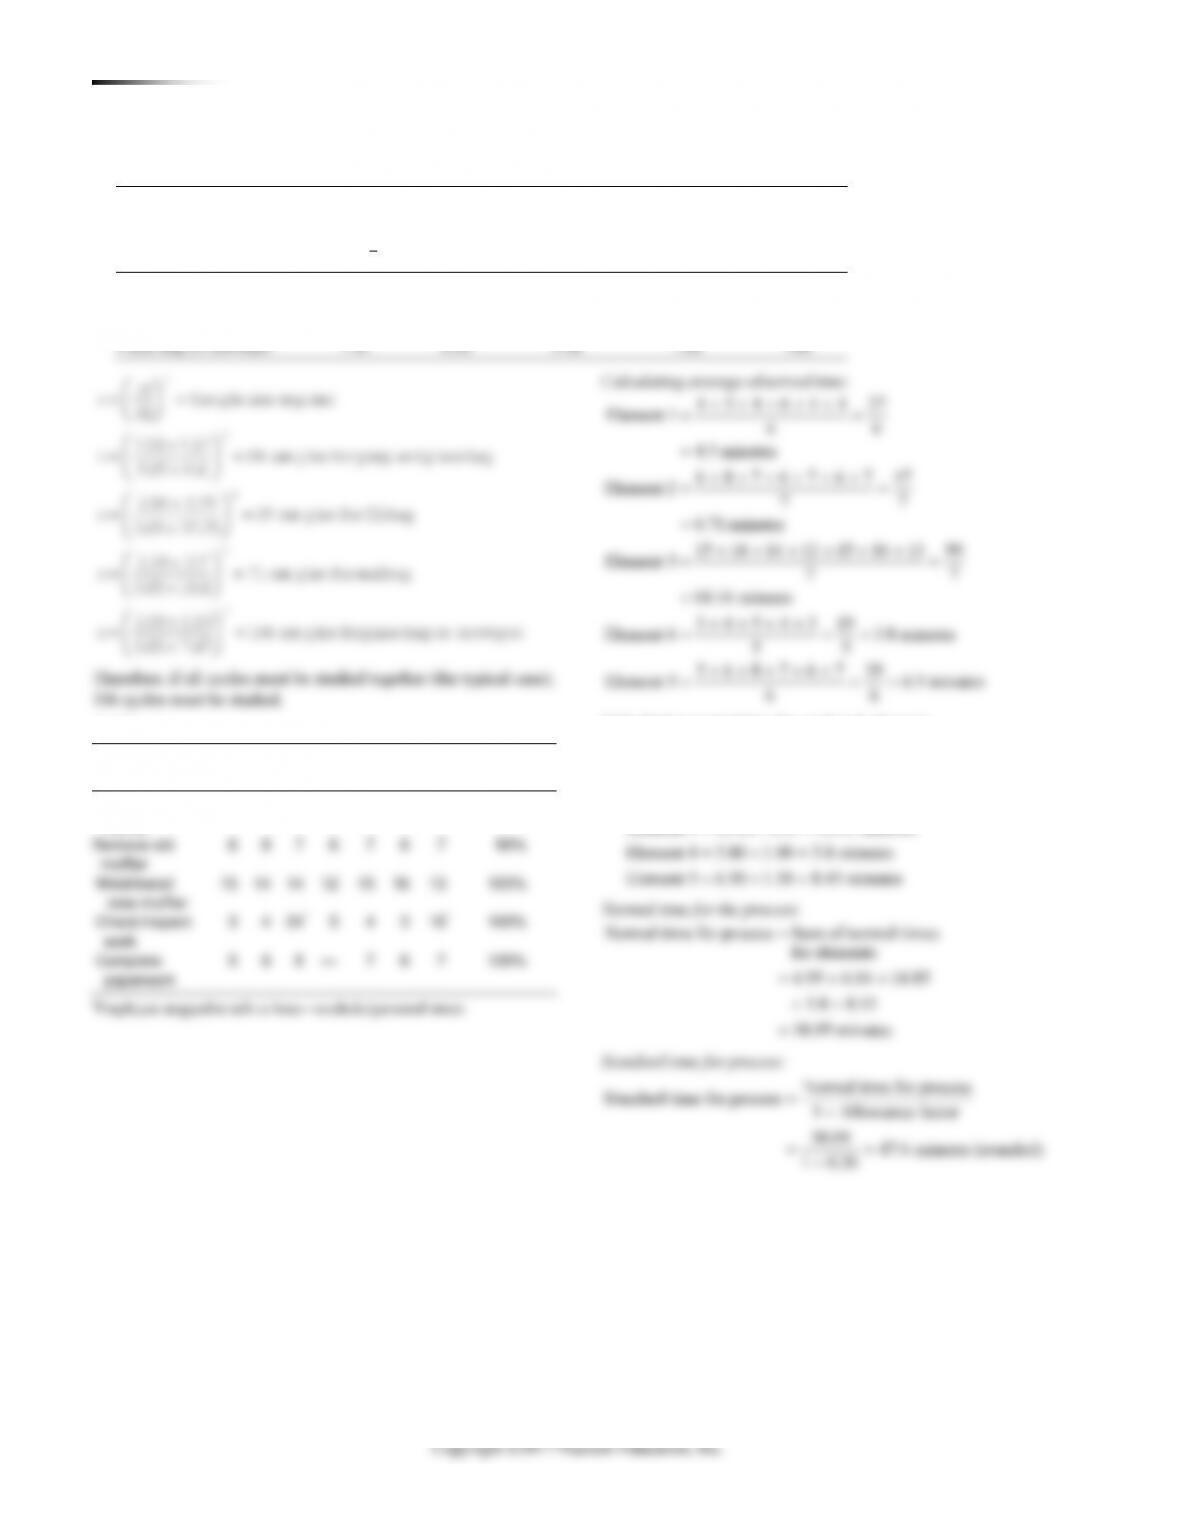
10.13 NT = Avg PR = 8.5 1.10 = 9.35 seconds; worker is
faster than normal
10.14 NT = Avg PR = 8.5 0.90 = 7.65 seconds; worker is
slower than normal
10.15
= = =
−−
9.35
(a) 11 seconds
1 1 0.15
NT
ST AF
−−
7.65
1 1 0.18
NT
Sum of times 1.74
(a) Average time = =
Number of cycles 16
= 0.10875 minutes = 6.525 seconds
(b) Normal time = (Average time) × (Performance rating factor)
Normal
(c) Standard time =
10.16
time
1 – Allowance factor
6.2 6.2
= = = 6.739 seconds
1 – 8% 92%
10.17 NT = Average observed cycle time PR = (50) (1.10)
= 55 seconds
10.18 (a) Normal time = 12 minutes 1.05 = 12.6 minutes
10.22
+ + + + =
2.2 2.6 2.3 2.5 2.4
5
NT = 2.4 1.05 = 2.52
2.52 2.8 minutes
1 0.10
−
10.20 (a) Normal time = 12 seconds 1.00 = 12.0 seconds
Normal time
12.0
14.12 seconds
1 0.15
==
−
10.21 Normal time = 5.3 minutes 1.05 = 5.565 minutes
++
++
==
Personal Fatigue Delay
Allowance Fraction = 60 minutes
3 2 1 6 = 0.10
60 60
Normal time
Standard time = 1 Allowance factor
5.565 6.183 minutes
1 0.10
−
==
−
Make one bed
90%
2.3
2.5
2.1
2.2
2.4
2.3
2.07
Vacuum
120%
1.7
1.9
1.9
1.4
1.6
1.7
2.04
Clean bath
100%
3.5
3.6
3.6
3.6
3.2
3.5
3.50
Job Element
Perf. Rating
Typing letter
2.5
3.5
2.8
2.6
3.3
85%
Typing envelope
0.8
0.8
0.6
0.7
100%
Stuffing envelope
0.4
0.5
0.6
0.5
95%
Observation (minutes per cycle)
Element
Rating
1
2
3
4
5
Average
Normal
Check minibar
100%
1.5
1.6
1.4
1.5
1.5
1.5
1.50
164 CHAPTER 10 HUMAN RE S O U R C E S , JO B DE S I G N , A N D WO R K ME A S U R E M E N T
Calculating average observed cycle time:
+ + + + +
= = =
+ + +
= = =
2.5 3.5 2.8 2.1 2.6 3.3 16.8
Element 1 2.8 minutes
1.0 0.9 1.0 0.9 3.8
Element 4 0.95 minutes
44
Calculating normal time for each task element:
Normal time = Observed cycle time Performance rating
Element 1 = 2.80 0.85 = 2.38 minutes
Element 2 = 0.74 1.00 = 0.74 minutes
Element 3 = 0.46 0.95 = 0.44 minutes
Element 4 = 0.95 1.25 = 1.19 minutes
2
105%
0.6
0.4
0.7
0.5
10.24 (continued)
(a) As shown below, normal time = 3.24 minutes.
10.23 (continued)
Normal time for the process:
4.75 5.40 minutes
1 0.12
==
−
10.24 Allowance = 23%
The first thing to notice is that observation 4 of job
element 2 is personal time and should be ignored.
2
105%
0.6
0.4
0.7
0.5
0.55
0.58
3
86%
0.5
0.4
0.6
0.4
0.4
0.46
0.40
4
90%
0.6
0.8
0.7
0.6
0.7
0.68
0.61
3.24
Normal time
(b) Standard time = 1 Allowance
−
10.25 (a, b)
2
95%
0.6
0.8
0.7
0.7
0.68
0.646
3
90%
0.6
0.4
0.7
0.5
0.5
0.54
0.486
4
85%
1.5
1.8
2.0
1.7
1.5
1.70
1.445
Observations (minutes)
Job
Element
Performance
Rating
1
2
3
4
5
1
97%
1.5
1.8
2.0
1.7
1.5
4
90%
0.6
0.8
0.7
0.6
0.7
Observations
Job
Element
Performance
Rating
1
2
3
4
5
Average
Actual Time
Normal
Time
1
97%
1.5
1.8
2.0
1.7
1.5
1.70
1.65
Observations (minutes)
(actual time)
Solutions
Task
Element
Performance
Rating
1
2
3
4
5
Actual
Time Average
Normal
Time
1
110%
0.5
0.4
0.6
0.4
0.4
0.46
0.506
CHAPTER 10 HUMAN RE S O U R C E S , JO B DE S I G N , AND WO R K ME A S U R E M E NT 165
10.26 Initial sample: 3.5, 3.2, 4.1, 3.6, 3.9
= + + + + = =
−
= = = =
−−
==
= = =
2
22
2
2
18.3
3.5 3.2 4.1 3.6 3.9 3.66
5
(Sample observation ) 0.492
s 0.123 0.35
n 1 5 1
1.96 0.35
0.05 3.66
.686 3.75 14.06, or 15 observations.
.183
x
x
zs
nhx
= = = =
2
22
(2.58)(1.28) 3.30
426
zs
nhx
10.27
10.28
Element
Observed Time (minutes)
Perf.
Rating
Prepare daily reports
35
40
33
42
39
120%
Photocopy results
12
10
36a
15
13
110%
Label and package
reports
3
3
5
5
4
90%
Distribute reports
15
18
21
17
45b
85%
a Photocopying machine broken (included in delay factor).
b Power outage (included in delay factor).
Calculating average observed cycle time:
35 40 33 42 39 189
Element 1 37.8 minutes
55
12 10 15 13 50
Element 2 12.5 minutes
44
3 3 5 5 4 20
Element 3 4.0 minutes
55
15 18 21 17 71
Element 4 17.75 minutes
44
+ + + +
= = =
+ + +
= = =
+ + + +
= = =
+++
= = =
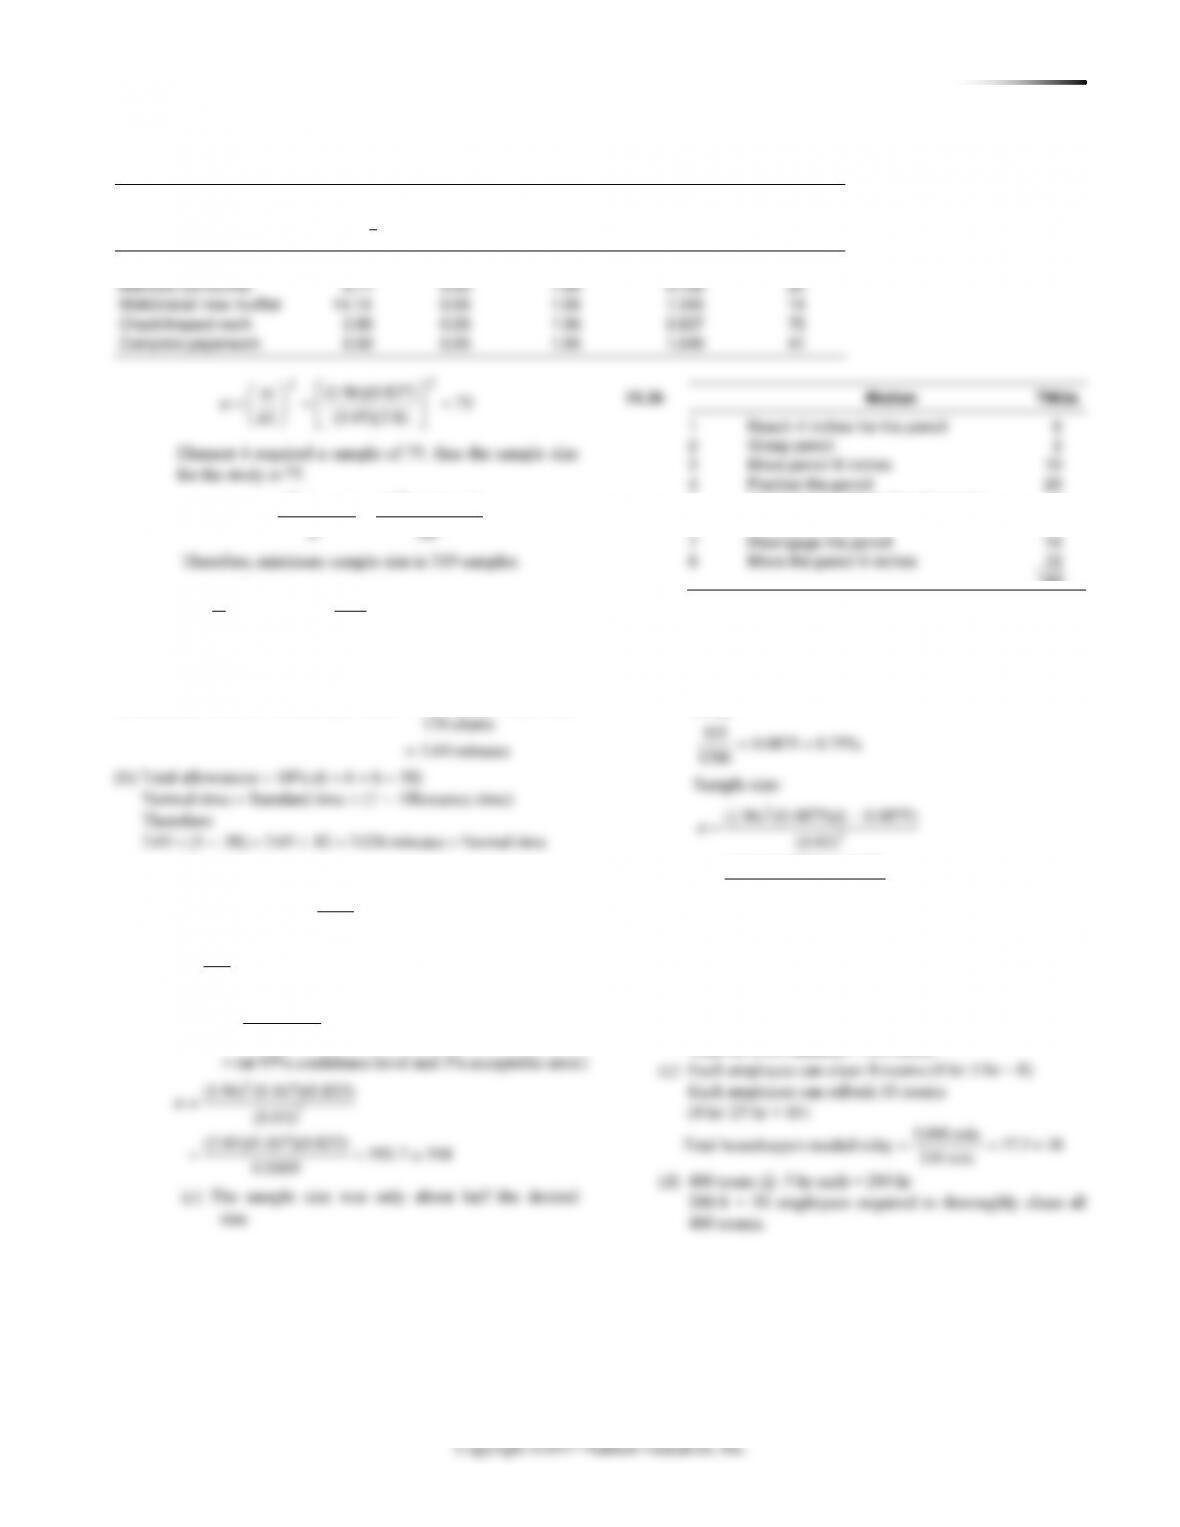
(c) Sample size:
From the equations relating to a normal distribution, we know
2
that: , 0.05, 1.96.
zs
n h z
hx
= = =
Job Element
Mean Cycle
Time
S2
S
Sample*
Prepare daily reports
37.80
13.70
3.7
15
Photocopy results
12.50
4.33
2.1
44
Label and package
reports
4.00
1.00
1.0
97**
Distribute reports
17.75
6.25
2.5
31
Sample size for the entire task must be at least 97 samples.
*All fractional sample sizes are rounded to the next highest integer value.
10.29 (a)
Job Element
Observed Time (seconds)
Perf.
Rating
Grasp and place
bag
8
9
8
11
7
110%
Fill bag
36
41
39
35
112a
85%
Seal bag
15
17
13
20
18
105%
Place bag on
conveyor
8
6
9
30b
35b
90%
a Bag breaks open, include as part of delay in allowance factor.
b Conveyor jams, include as part of delay in allowance factor.
Note: If bags break open with any regularity, then these
observations would be included in the time for this element . . . it
would be part of the element and task.
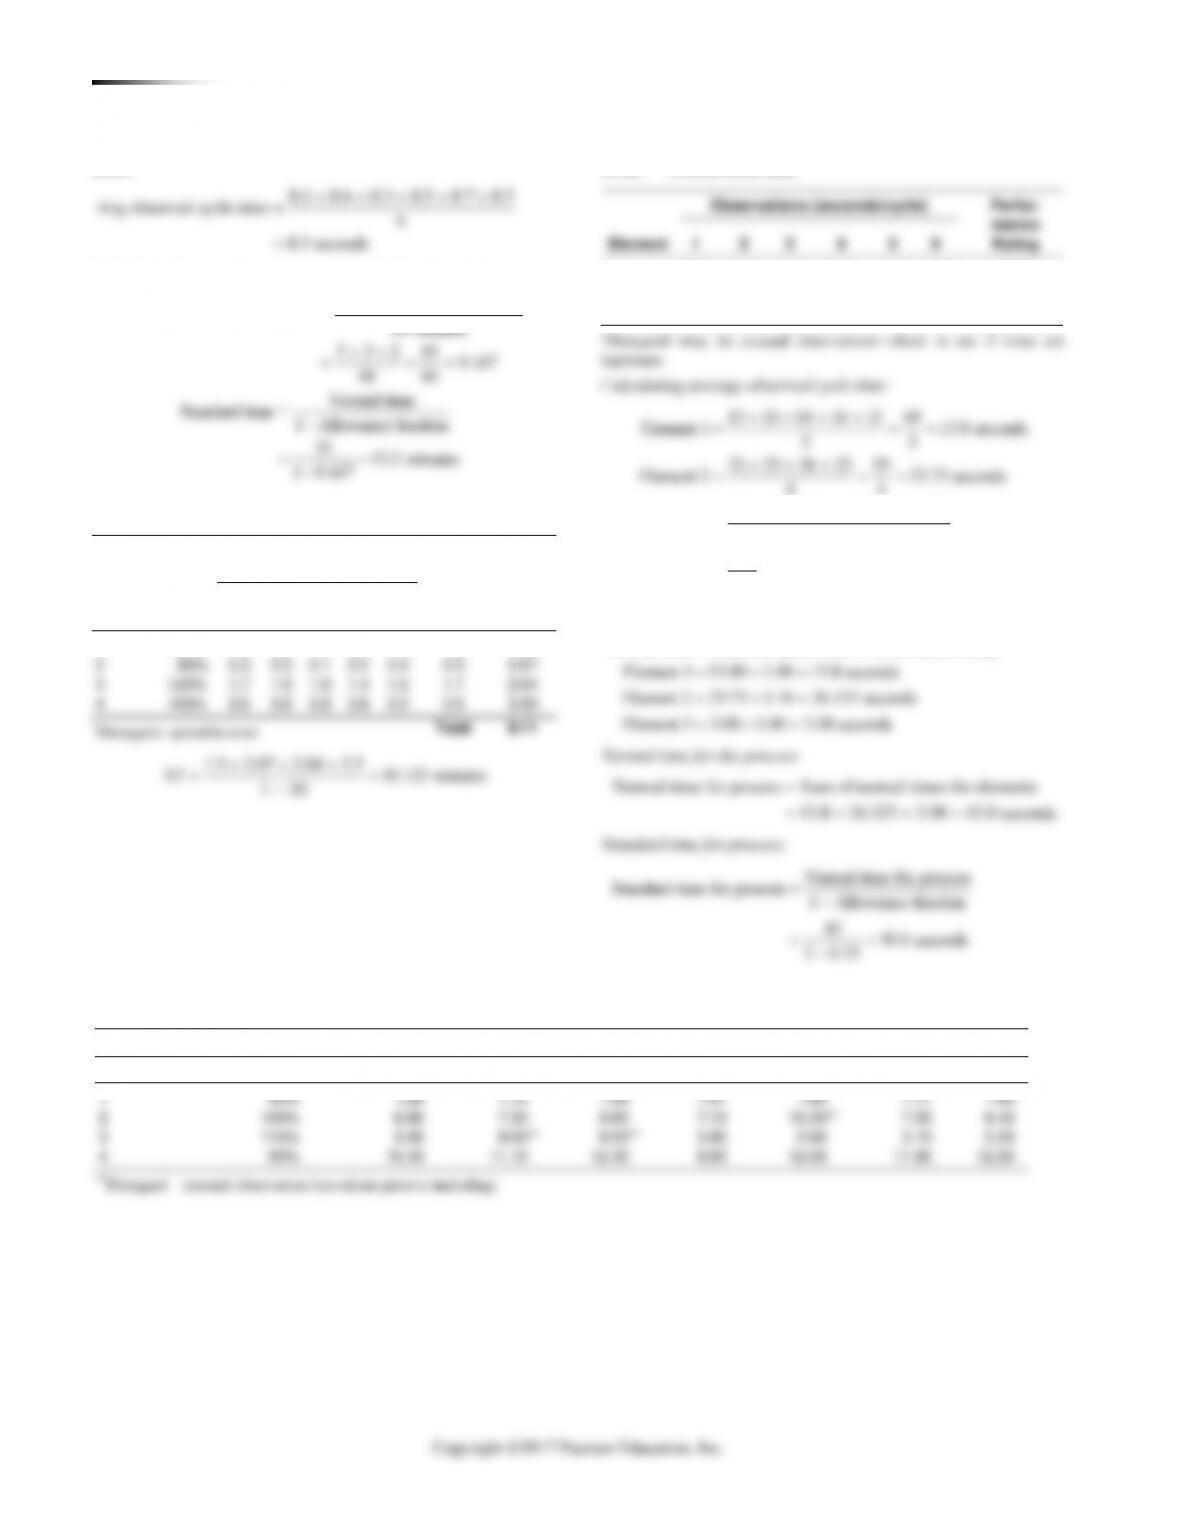
Calculating average observed time:
8 9 8 11 7 43
Element 1 8.6 seconds
55
36 41 39 35 151
Element 2 37.75 seconds
44
15 17 13 20 18 83
Element 3 16.6 seconds
+ + + +
= = =
+ + +
= = =
+ + + +
= = =
166 CHAPTER 10 HUMAN RE S O U R C E S , JO B DE S I G N , A N D WO R K ME A S U R E M E N T
(b)
==
=
2.58 2.7 71 sam ples for seal bag
0.05 16.6
2
n
n
=
2
.58 1.53 106 sam ples for place bag on conveyor
0.05 7.67
Therefore, if all cycles must be studied together (the typical case),
106 cycles must be studied.
10.30 (a)
Job Element
Observed Time (minutes)
Performance
Rating
Select correct
muffler
4
5
4
6
4
15*
4
110%
Remove old
muffler
6
8
7
6
7
6
7
90%
Weld/install
new muffler
15
14
14
12
15
16
13
105%
Check/inspect
work
3
4
5
4
3
Element 3 77
14.14 minutes
3 4 5 4 3 19
Element 4 3.8 minutes
55
5 6 8 7 6 7 39
Element 5 6.5 minut
66
==
=
+ + + +
= = =
+ + + + +
= = = es
Calculating normal time for each task element:
=
= =
= =
= =
= =
= =
Normal time Observed time Performance rating
Element 1 4.50 1.10 4.95 minutes
Element 2 6.71 0.90 6.04 minutes
Element 3 14.14 1.05 14.85 minutes
Element 4 3.80 1.00 3.8 minutes
Element 5 6.50 1.30 8.45 minutes
Calculating Sample Size
Job Element
Mean
()X
Desired
Accuracy
(h)
Std. Dev.
Required
(Z)
Std. Dev. of
Sample
(S)
Samples
Required
Grasp and place bag
8.60
0.05
2.58
1.52
83
Fill bag
37.75
0.05
2.58
2.75
14
Seal bag
16.60
0.05
2.58
2.70
70
Place bag on conveyor
7.67
0.05
2.58
1.53
106
CHAPTER 10 HUMAN RE S O U R C E S , JO B DE S I G N , AND WO R K ME A S U R E M E NT 167
(b) Calculating sample size:
Remove old muffler
6.71
0.05
1.96
0.756
0.05
1.96
1.345
Check/inspect work
3.80
0.05
1.96
0.837
Job Element
Mean
Observed
Time
()X
Desired
Accuracy
(h)
Std. Dev.
Required
(Z)
Std. Dev.
of Sample
(S)
Samples
Required
Select correct muffler
4.50
0.05
1.96
0.837
54
168 CHAPTER 10 HUMAN RE S O U R C E S , JO B DE S I G N , A N D WO R K ME A S U R E M E N T
Copyright ©2017 Pearson Education, Inc.
CHAPTER 10 HUMAN RE S O U R C E S , JO B DE S I G N , AND WO R K ME A S U R E M E NT 169
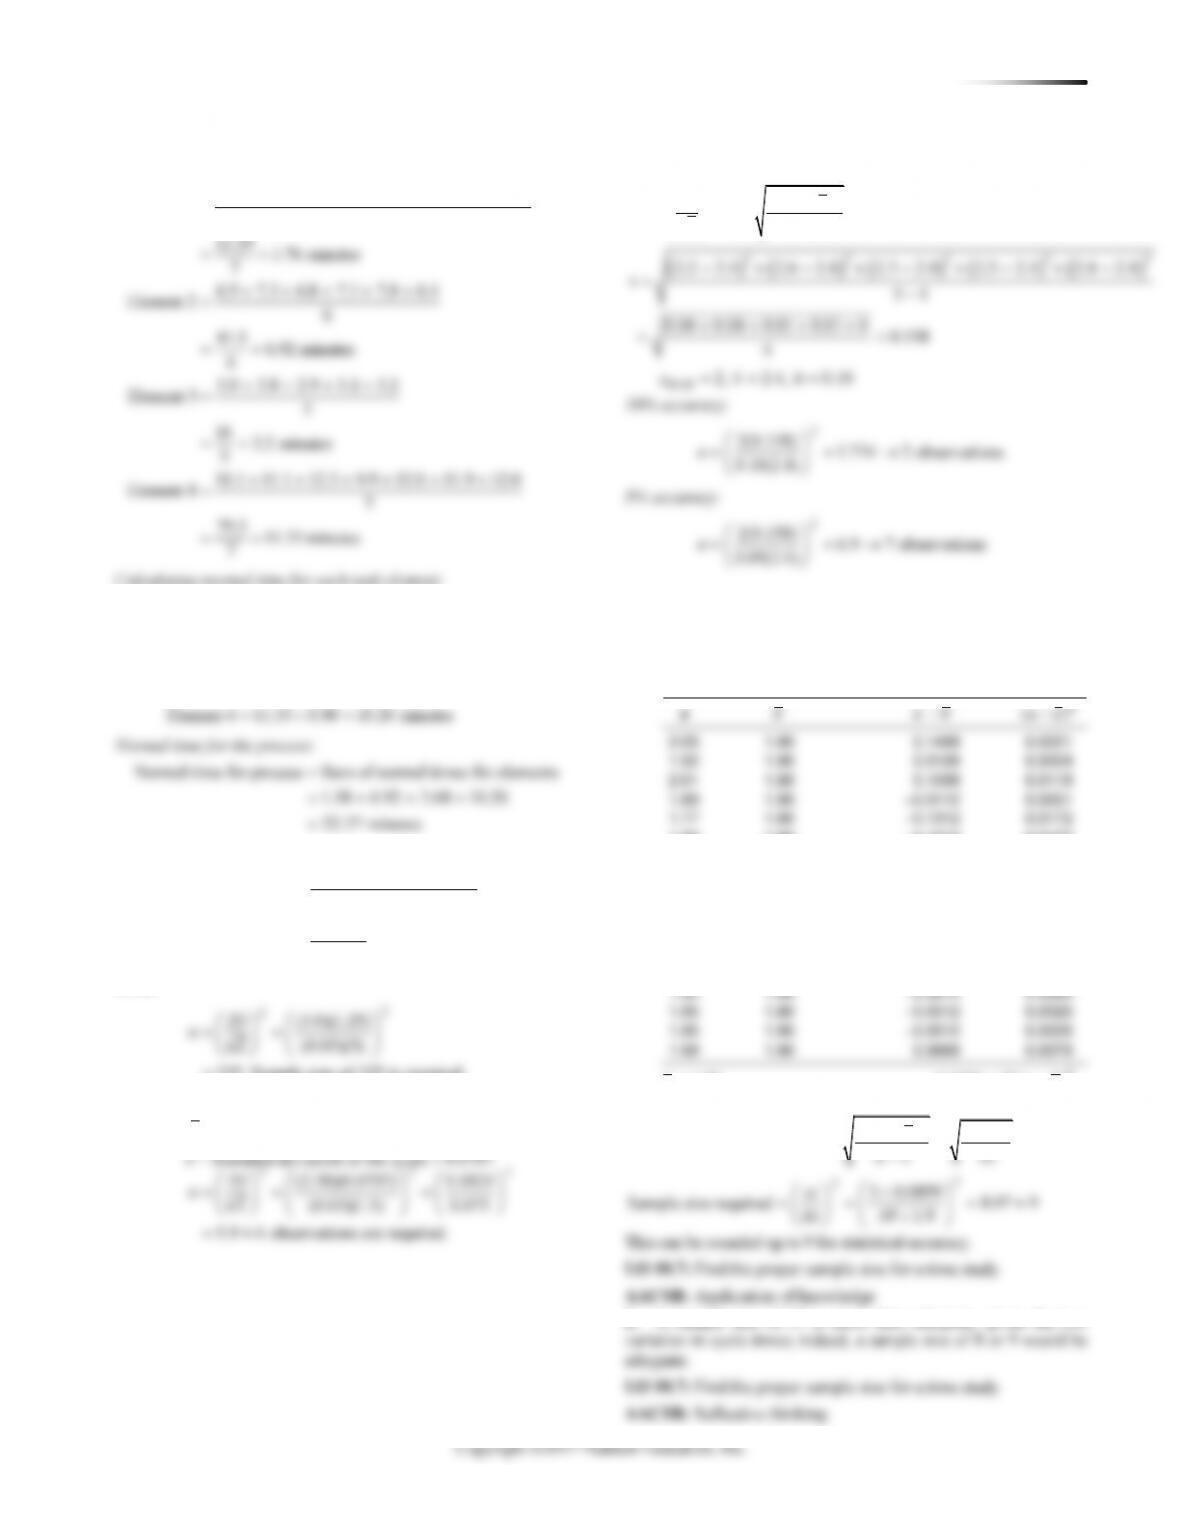
Calculating average observed cycle time:
1.80 1.70 1.66 1.91 1.85 1.77 1.60
Element 1 7
12.29 1.76 minutes
+ + + + + +
=
==
7
Calculating normal time for each task element:
Normal time Observed cycle time Performance rating
Element 1 1.76 0.90 1.58 minutes
Element 2 6.92 1.00 6.92 minutes
Element 3 3.20 1.15 3.68 minutes
Element 4 11.33 0.90 10.20 minutes
=
= =
= =
= =
= =
2.05
1.90
0.1488
0.0221
1.92
1.90
0.0188
0.0004
2.01
1.90
0.1088
0.0118
1.89
1.90
−0.0112
0.0001
=
22.37 minutes
Standard time for process:
Normal time for process
Standard time for process 1 Allowance fraction
22.37 29.8 minutes
1 0.25
=−
==
−
10.44*
2
2(3.0)(1.25)
ZS
nhX
==
10.46*
22
()
; 1
i
xx
ZS
ns
hX n
−
==
−
0.05(2.4)
CASE STUDY
JACKSON MANUFACTURING CO.
1. Actual observed cycle times:
x
x
−xx
−2
()xx
1.77
1.90
−0.1312
0.0172
1.80
1.90
−0.1012
0.0102
1.86
1.90
−0.0412
0.0017
1.83
1.90
−0.0712
0.0051
1.93
1.90
0.0288
0.0008
1.96
1.90
0.0588
0.0035
1.95
1.90
0.0488
0.0024
2.05
1.90
0.1488
0.0221
1.79
1.90
−0.1112
0.0124
1.82
1.90
−0.0812
0.0066
1.85
1.90
−0.0512
0.0026
1.85
1.90
−0.0512
0.0026
170 CHAPTER 10 HUMAN RE S O U R C E S , JO B DE S I G N , A N D WO R K ME A S U R E M E N T
1
2
3. Available time = 7.5 60 = 450 minutes
Observed cycle time = 1.90; normal time = 1.90 1.15 = 2.185
AACSB: Application of knowledge
AACSB: Analytical thinking
1. Based on the case and the video, students should provide
some version of the Alaska Airlines people focus statement
provided in the case. Any statement regarding Alaska Airlines’
empowerment. HR at Alaska Airlines succeeds because they
strive to instill in employees a sense of pride, passion, and respect
2. Empowerment allows employees to take responsibility for
solving problems and therefore to try to avoid them in the future. In
addition, fast problem solving tends to make for happier customers.
3. Respect for employees, employee empowerment, driving deci-
sion making down to the lowest level possible are all management
HARD ROCK’S HUMAN RESOURCE
STRATEGY
◼ Great benefit package
◼ Effective indoctrination and training, empowerment
2. The human resource department supports the overall theme
restaurant strategy (the experience economy concept) by aggressive
screening, including an evaluation of how the employee will con-
3. An automobile assembly line probably allows less opportuni-
ty for creativity and individual expression than a waiter or wait-
4. The job design literature is rich with many improvements that
can be made in the traditional assembly line. The Hackman and
ing opportunity for self-direction by adding planning and control
tasks to the job can contribute to Autonomy; and Supervisory
of course, the hygiene factors of security, status, working condi-
tions, pay, interpersonal relations, supervision, and company
CHAPTER 10 HUMAN RE S O U R C E S , JO B DE S I G N , AND WO R K ME A S U R E M E NT 171
1
2
ADDITIONAL CASE STUDIES
(AVAILABLE IN MYOMLAB)
CHICAGO SOUTHERN HOSPITAL
1. Sampling plan:
◼ Do studies on all shifts (probably four shifts; three each
−
= = =
= = =
22
22
(1 ) (1.96) (0.15)(0.85)
Sample size (0.04)
3.84 0.1275 0.49 306.13 307
0.0016 0.0016
Z p p
nh
2.
3. By structuring the study across different nurses, different
shifts, and different hospital processes (areas/functions), there
THE FLEET THAT WANDERS
Can you imagine an analytical approach to documenting the prob-
lems reported by drivers?
We often use this case to explain that not all problems of this
nature are behavioral. Indeed, this is a true case designed to show
students that, based on what is known about human factors, the
situation can be studied analytically. The design methodology for
cular activity.
There were, of course, some difficulties with this design. It
was expensive to outfit the trucks and drivers with the monitoring
devices. The cooperation of the drivers was needed because the
AACSB: Analytical thinking