
CHAPTER 15
UNDERSTANDING REGRESSION ANALYSIS BASICS
LEARNING OBJECTIVES
In this chapter you will learn:
15-1 What is bivariate linear regression analysis including basic concepts such as terms,
assumptions, and equation
15-2 What is multiple regression analysis including the basic underlying conceptual
model, terms, assumptions, and computations
15-3 What is stepwise multiple regression including how to do it with SPSS
15-4 Some warnings regarding the use of multiple regression analysis
15-5 How to report multiple regression findings to clients
CHAPTER OUTLINE
Bivariate Linear Regression Analysis
• Basic Concepts in Regression Analysis
o Independent and dependent variables
o Computing the slope and the intercept
• How to Improve a Regression Analysis Finding
Multiple Regression Analysis
• An Underlying Conceptual Model
• Multiple Regression Analysis Described
o Basic assumptions in multiple regression
• “Trimming” the Regression for Significant Findings
• Special Uses of Multiple Regression Analysis
o Using a “dummy” independent variable
o Using standardized betas to compare the importance of independent
variables
o Using multiple regression as a screening device
o Interpreting the findings of multiple regression analysis
Stepwise Multiple Regression
• How to do Stepwise Multiple Regression with SPSS
• Step-By-Step Summary of How to Perform Multiple Regression Analysis

Warnings Regarding Multiple Regression Analysis
Reporting Regression Findings to Clients
KEY TERMS
Regression Analysis Bivariate regression
Intercept Slope
Dependent variable Independent variable
Least-squares criterion Outlier
General conceptual model Multiple regression analysis
Regression plane Additivity
Independence assumption Multicollinearity
Variance inflation factor (VIF) Dummy independent variable
Standardized beta coefficient Screening device
Stepwise multiple regression
TEACHING SUGGESTIONS
1. Students may need some additional help understanding the difference between
extrapolation and building a predictive model. A way to help them comprehend the
difference is to note that extrapolation always relies on some pattern that is seen over
time, while prediction requires the use of a factor other than time. Extrapolation uses
the average change in the focal variable per relevant time period, while prediction
uses the average change in the focal variable per relevant unit of the other variable.
You can use sales and marketing variables as an example. If sales have increased at
10% per year for the past 5 years, you can extrapolate that they will increase 10% in
the coming year. However, if sales have increased by 20% for every 10% decrease in
price, you can predict that they will increase by 20% if the price is decreased by 10%.
In both cases, however, all other variables are assumed to have the same influence as
in the past.
2. The analysis of residuals underpins assessment of the goodness of a predictive model,
and it is an important foundational concept. To help students understand analysis of

residuals, consider the following in-class exercise.
Show students the following number series, and ask them what straight line formula
will correctly predict the next number.
15, 20, 25, 30, ?
To find the intercept, use y = a + bx, and set x = 0, or
a + b (0) = 15
a = 15
Next, experiment with different values of b, and look at how close the results are to
the given series.
Series (y) 15, 20, 25, 30, ?
Let x = 0 1 2 3 4 Residual (sum: 0-3)
15 + 1x 15, 16, 17, 18, 19 24
15 + 2x 15, 17 19, 21, 23 18
15 + 3x 15, 18, 21, 24, 27 12
15 + 4x 15, 19, 23, 27, 31 6
15 + 5x 15, 20, 25, 30, 35 0
The residual (sum: 0-3) is the sum of the differences in the predicted value for each
equation as compared to the series. The 15 +5x equation has the lowest residual, so it
is the best predictive model, and although its residual is 0, the prediction of 35 for
x=4 is correct.
3. Use of the Novartis data to illustrate bivariate regression is intentional as it explicitly
ties regression to correlation. The text notes that the same data is used, but it is
worthwhile to point out the connection to students who may have skipped over this
point or otherwise overlooked it.
4. There are many nuances to regression analysis not treated in this chapter’s
introduction to the topic. The intent is to describe the basic concepts and to have
students identify their related values on a printout. SPSS on the other hand, does
provide for a number of statistical options that are beyond the scope of the chapter,
particularly in the case of multiple regression. Some instructors who desire more in-
depth coverage of this technique may do so with their own materials and rely on
SPSS to accommodate this deeper coverage.
5. Regression analysis is complicated and difficult for undergraduate students to
understand. To help with the comprehension of regression analysis, we have
provided a number of regression application examples. If one’s students relate well
to concrete examples, it may be beneficial to use these examples in class or to go over
them in detail more than with the examples in earlier chapters.

6. The section on the underlying conceptual model for multiple regression analysis has
two pedagogical benefits.
First, it can be used to help students understand the distinction between independent
and dependent variables. The independent variables come from the constructs that
are on the outside of the diagram that have arrows pointing toward the center.
Dependent variables emanate from the center of the diagram, and the diagram implies
that the central variables (dependent) are affected or influenced by the surrounding
variables (independent).
Second, the abbreviated lists of examples of variables for each circle in the diagram
should help students to identify the specific variables (such as demographic variables)
that would or could be used in the multiple regression model.
7. In earlier editions of the textbook, the predictive analysis chapter included a section
on time series analysis. This topic was deleted, and the section on multiple regression
was expanded in response to what the authors perceived to be a low level of interest
in time series analysis by adopting instructors. The Student Version of SPSS does
have time series (experiential smoothing) analysis capabilities as well as graphing
procedures for time series data. Instructors who wish to teach time series analysis
concepts can still do so using SPSS; however, they will need to draw from sources
other than the textbook for reading or study materials for their students.
8. Because of the many assumptions of regression analysis that can be easily violated
with a tool such as SPSS, we emphasize caution when unleashing students on
multiple regression analysis. We have provides some readable references in the
endnotes (13 and14) that we list below in case the Instructor want his or her students
to be exposed to practitioner-oriented literature on this topic. (The Quirk’s Marketing
Research Review articles are available at www.quirks.com).
See for example, Kennedy, Peter (2005, Winter), Oh No! I got the wrong sign! What
should I do? Journal of Economic Education, Vol. 36, No. 1, 77-92.
9. The Auto Concepts Segmentation Analysis dataset does not yield a good predictive
model results. We note that survey data typically does not, but Instructors may want
to emphasize that surveys have restrictive scales that greatly dampen the variance and
give regression little to work with. If Instructors have more illustrative datasets that
generate tighter predicted confidence intervals, they should consider using them. On

the other hand, the Auto Concepts Segmentation Analysis data set is a good vehicle to
demonstrate the “screening” technique use of multiple regression, and its use in Case
15.2 is a good teaching instrument.
ACTIVE LEARNING EXERCISES
The General Conceptual Model for Global Motors
What is the general conceptual model apparent in the Auto Concepts survey data set?
Lifestyle is measured as follows.
Attitudes and beliefs are:
• I am worried about global warming.
• Global warming is a real threat.
• We need to do something to slow global warming.

Media habits are:
Past behavior is
Nick will gain market segmentation implications from the demographics, lifestyle
variables and the past behavior (type of vehicle owned), promotional strategy
implications from the media habits, attitudes and beliefs variables.
Segmentation Associates, Inc.
This active learning exercise requires students to interpret the results of multiple
regression and to apply them to market segmentation target marketing considerations
using the underlying conceptual model concept described in the chapter. It also
illustrates the use of multiple regression to identify market segment differences.
1. What is the underlying conceptual model used by Segmentation Associates that is
apparent in these three sets of findings?
2. What are the segmentation variables that distinguish economy automobile buyers and
in what ways?
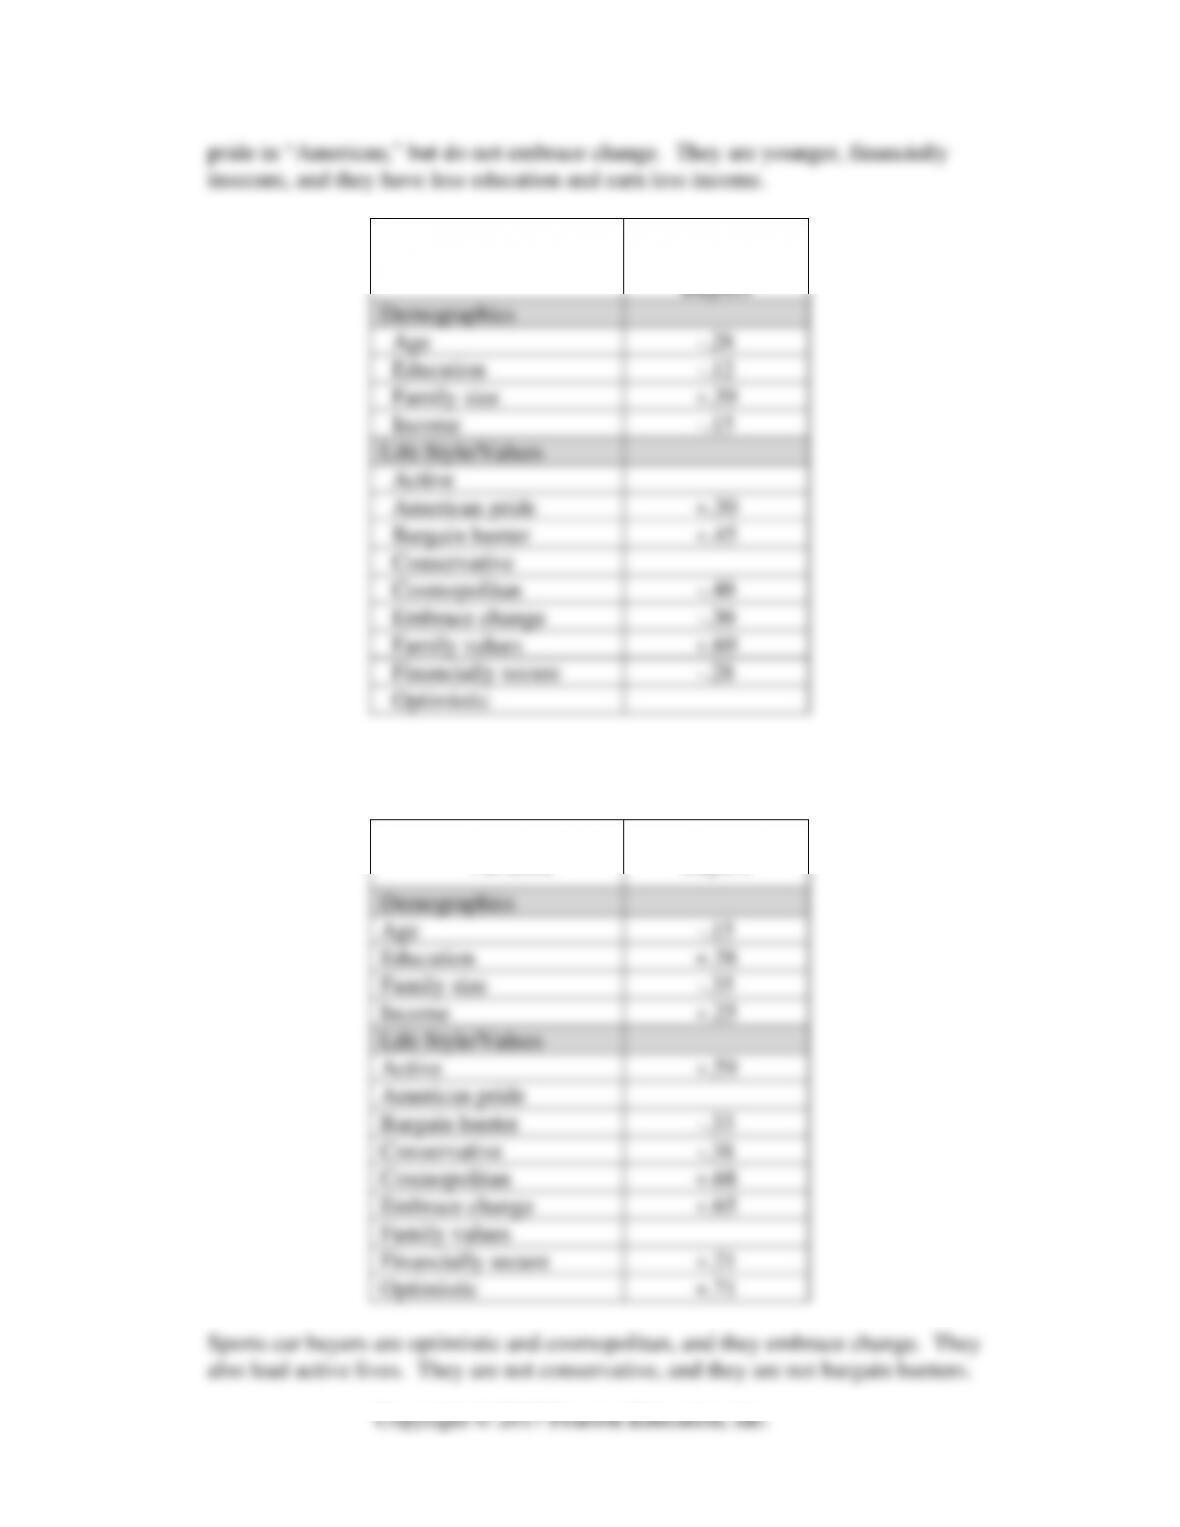
Segmentation
Variable
Compact
Automobile
Buyers
Demographics
Age
-.28
Education
-.12
Family size
+.39
Income
-.15
Life Style/Values
Active
American pride
+.30
Bargain hunter
+.45
Conservative
Cosmopolitan
-.40
Embrace change
-.30
Family values
+.69
Financially secure
-.28
Optimistic
3. What are the segmentation variables that distinguish sports car buyers and in what
ways?
Segmentation
Variable
Sports Car
Buyers
Demographics
Age
-.15
Education
+.38
Family size
-.35
Income
+.25
Life Style/Values
Active
+.59
American pride
Bargain hunter
-.33
Conservative
-.38
Cosmopolitan
+.68
Embrace change
+.65
Family values
Financially secure
+.21
Optimistic
+.71
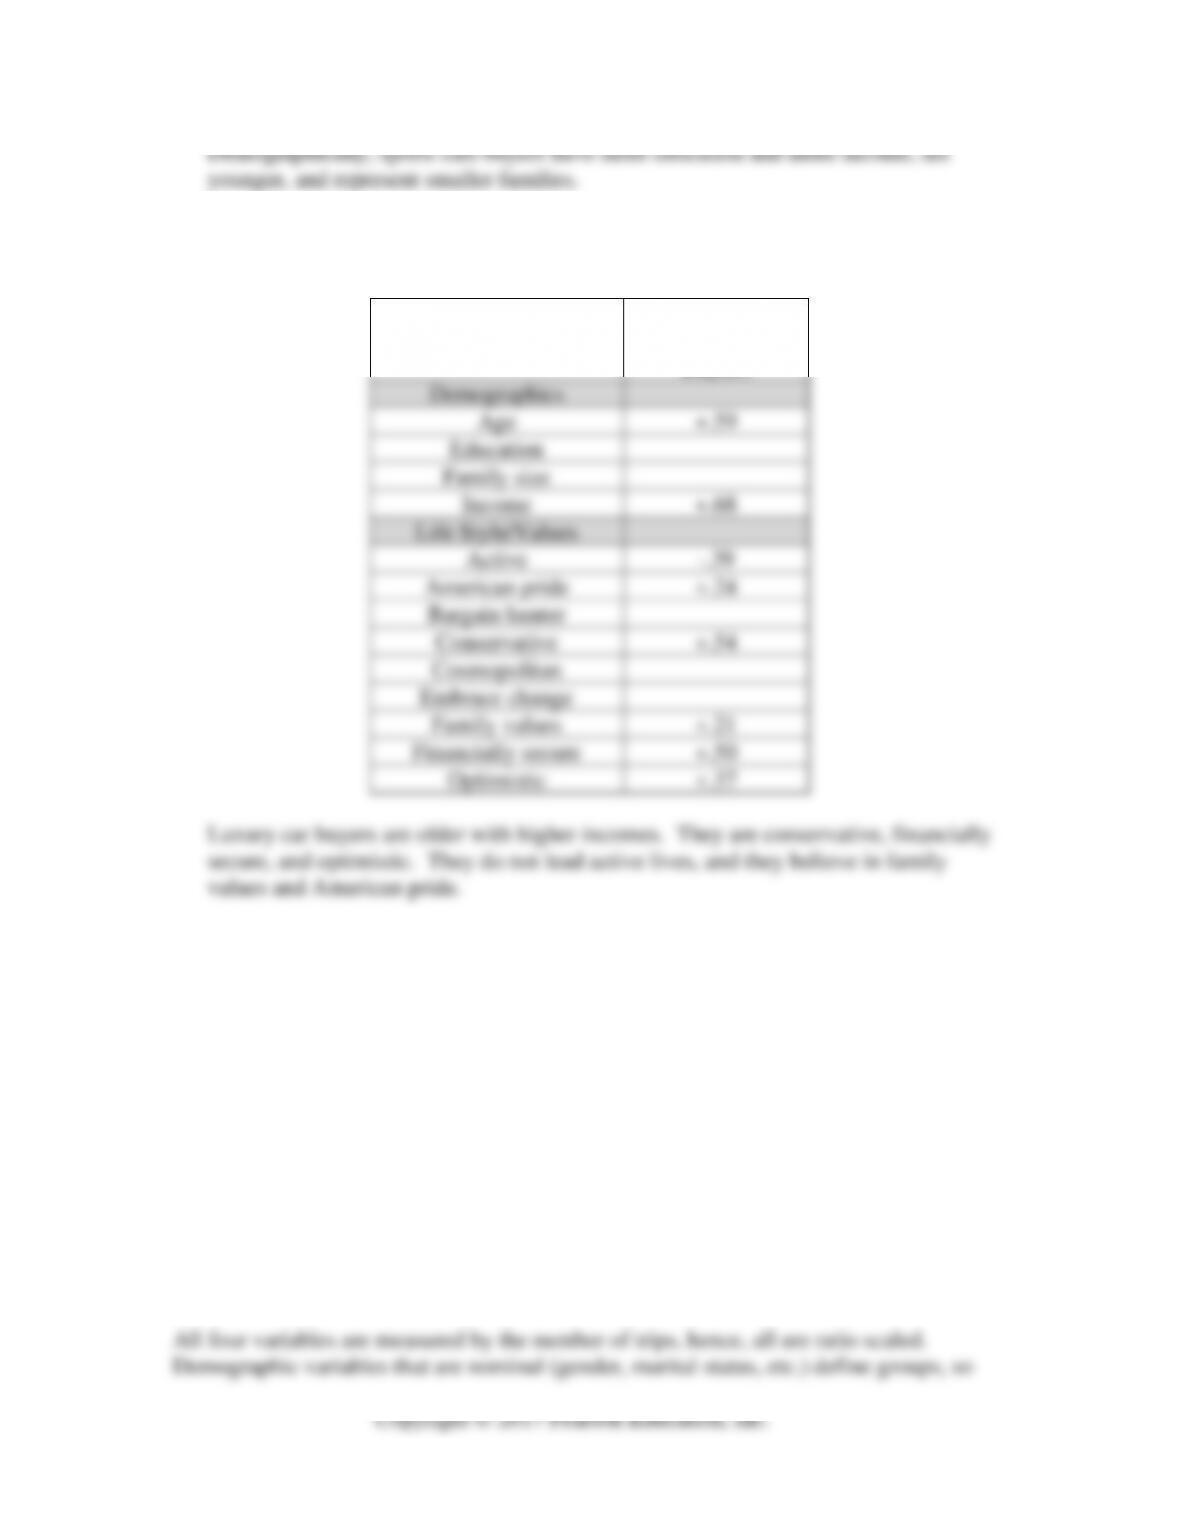
4. What are the segmentation variables that distinguish luxury automobile buyers and in
what ways?
Segmentation
Variable
Luxury
Automobile
Buyers
Demographics
Age
+.59
Education
Family size
Income
+.68
Life Style/Values
Active
-.39
American pride
+.24
Bargain hunter
Conservative
+.54
Cosmopolitan
Embrace change
Family values
+.21
Financially secure
+.50
Optimistic
+.37
Luxury car buyers are older with higher incomes. They are conservative, financially
secure, and optimistic. They do not lead active lives, and they believe in family
values and American pride.
SYNTHESIZE YOUR LEARNING
Alpha Airlines
Students must assess the scaling assumptions underlying the questions on the survey, and
for each question, they must identify the proper form of analysis.
1. What is the target market profile of each of the following types of Alpha Airlines
traveler? That is, what demographic and lifestyle factors are related to the number of
miles traveled on Alpha Airlines for each of the following types?
a. Domestic business traveler
b. Domestic tourist traveler
c. International business traveler
d. International tourist traveler

2. Are there differences in the desirabilities of each of the five potential new Alpha
Airlines services with respect to:
a. Gender?
b. Belonging (or not) to Alpha Airlines frequent-flyer program?
c. Belonging (or not) to Alpha Airlines Prestige Club (private lounge areas in
some airports)?
d. Use or nonuse of Alpha Airlines’ website to book most of your flights?
e. Usual class of seating (business versus economy class) on Alpha Airlines?
3. Do relationships exist for estimated number of air flight trips in each of the past 3
years on any airline with:
a. Age?
b. Income?
c. Education?
d. Any of the lifestyle dimensions?
4. Do associations exist for (1) participating or not in Alpha Airlines frequent-flyer
program, (2) membership or not to Alpha Airlines Prestige Club (private lounge areas in
some airports), and/or (3) use or not of Alpha Airlines website to book most flights with:
a. Gender?
b. Marital status?
c. Usual class of seating (business versus economy class) on Alpha Airlines?

ANSWERS TO END-OF-CHAPTER QUESTIONS
1. Use an x-y graph to construct and explain a reasonably simple linear model for each
of the following cases:
A reasonable model is described under each case.
a. What is the relationship between gasoline prices and distance traveled for family
automobile touring vacations?
b. How do hurricane force wind warnings(e.g., Category 1, Category 2, etc.) relate
to purchases of flashlight batteries in the expected landfall area?
c. What is the relationship between carry-on luggage and charges for checking
luggage on airlines?
2. Indicate what the scatter diagram and probable regression line would look like for
two variables that are correlated in each of the following ways. In each instance,
assume a negative intercept.
a. -0.89
b. +0.48

3. Circle K runs a contest inviting customers to fill out a registration card. In exchange,
they are eligible for a grand-prize drawing of a trip to Alaska. The card asks for the
customer’s age, education, gender, estimated weekly purchases (in dollars) at the
Circle K, and approximate distance the Circle K is from his or her home. Identify
each of the following if a multiple regression analysis was to be performed.
a. Independent variable
b. Dependent variable
c. Dummy variable
4. Explain what is meant by the independence assumption in multiple regression. How
can you examine your data for independence, and what statistic is issued by most
statistical analysis programs? How is this statistic interpreted? That is, what would
indicate the presence of multicollinearity, and what would you do to eliminate it?
5. What is multiple regression? Specifically, what is “multiple” about it, and how does
the formula for multiple regression appear? In your indication of the formula,
identify the various terms and also indicate the signs (positive or negative) that they
may take on.

6. If one uses the “enter” method for multiple regression analysis, what statistics on an
SPSS output should be examined to assess the result? Indicate how you would
determine each of the following:
a. Variance explained in the dependent variable by the independent variables
b. Statistical significance of each of the independent variables
c. Relative importance of the independent variables in predicting the dependent
variable
7. Explain what is meant by the notion of “trimming” a multiple regression result. Use
the following example to illustrate your understanding of this concept.
A bicycle manufacturer maintains records over 20 years of the following: retail price
in dollars, co-operative advertising amount in dollars, competitors’ average retail
price in dollars, number of retail locations selling the bicycle manufacturer’s brand,
and whether or not the winner of the Tour de France was riding the manufacturers’
brand (coded as a dummy variable where 0=no, and 1-yes).
The initial multiple regression result determines the following:
Variable Significance Level
Average retail price in dollars .001
Cooperative advertising amount in dollars .202
Competitors’ average retail price in dollars .028
Number of retail locations .591
Tour de France .032
Using the “enter” method in SPSS, what would be the trimming steps you would
expect to undertake to identify the significant multiple regression result? Explain
your reasoning.
nn xbxbxbxbay …
332211 ++++=