14. Following is some information about 10 respondents to a mail survey concerning
candy purchases. Use SPSS to construct the four different types of cross-tabulation
tables which are possible. Label each table, and indicate what you perceive to be the
general relationship apparent in the data.
Respondent Buys Plain M&Ms Buys Peanut M&Ms
1 Yes No
2 Yes No
3 No Yes
4 Yes No
5 No No
6 No Yes
7 No No
8 Yes No
9 Yes No
10 No Yes
15. Morton O’Dell is the owner of Mort’s Diner, which is located in downtown Atlanta,
Georgia. Mort’s opened up about 12 months ago, and it has experienced success. But
Mort is always worried about what food items to order on a weekly basis because on
some weeks, Mort has excess inventory, such as too much fish that must be discarded.
Mort’s daughter, Mary, is an MBA. student at Georgia State University, and she
offers to help her father. She asks him to provide sales data for the past 10 weeks in
terms of total pounds of food bought by customers. With some difficulty, Mort comes
up with the following numbers.
Week Meat Fish Fowl Vegetables Desserts
1 100 50 150 195 50
2 91 55 172 200 64
3 82 60 194 209 70
4 75 68 211 215 82
5 66 53 235 225 73
6 53 61 253 234 53
7 64 57 237 230 68
8 76 64 208 221 58
9 94 68 193 229 62
10 105 58 171 214 62
Mary uses these sales figures to construct scatter diagrams that illustrate the basic
relationships among the various types of food items purchased at Mort’s Diner over
the past 10 weeks. She tells her father that the diagrams provide some help in his
weekly inventory ordering problem. Construct Mary’s scatter diagrams with SPSS to
indicate what assistance they are to Mort. Perform the appropriate associated
analysis with SPSS and interpret your findings.
Students will need to create an SPSS for Windows, Student Version, dataset and
create the scatter diagrams. A correlation matrix is equally informative and much
CASE SOLUTIONS
Case 14.1 L’Experience Félicité Restaurant Survey Associative Analysis
Case Objective
This case item requires students to identify the proper associative analysis, run it with
SPSS, and interpret the findings with respect to implications for L’Experience Félicité
Restaurant.
Answers to Case Questions

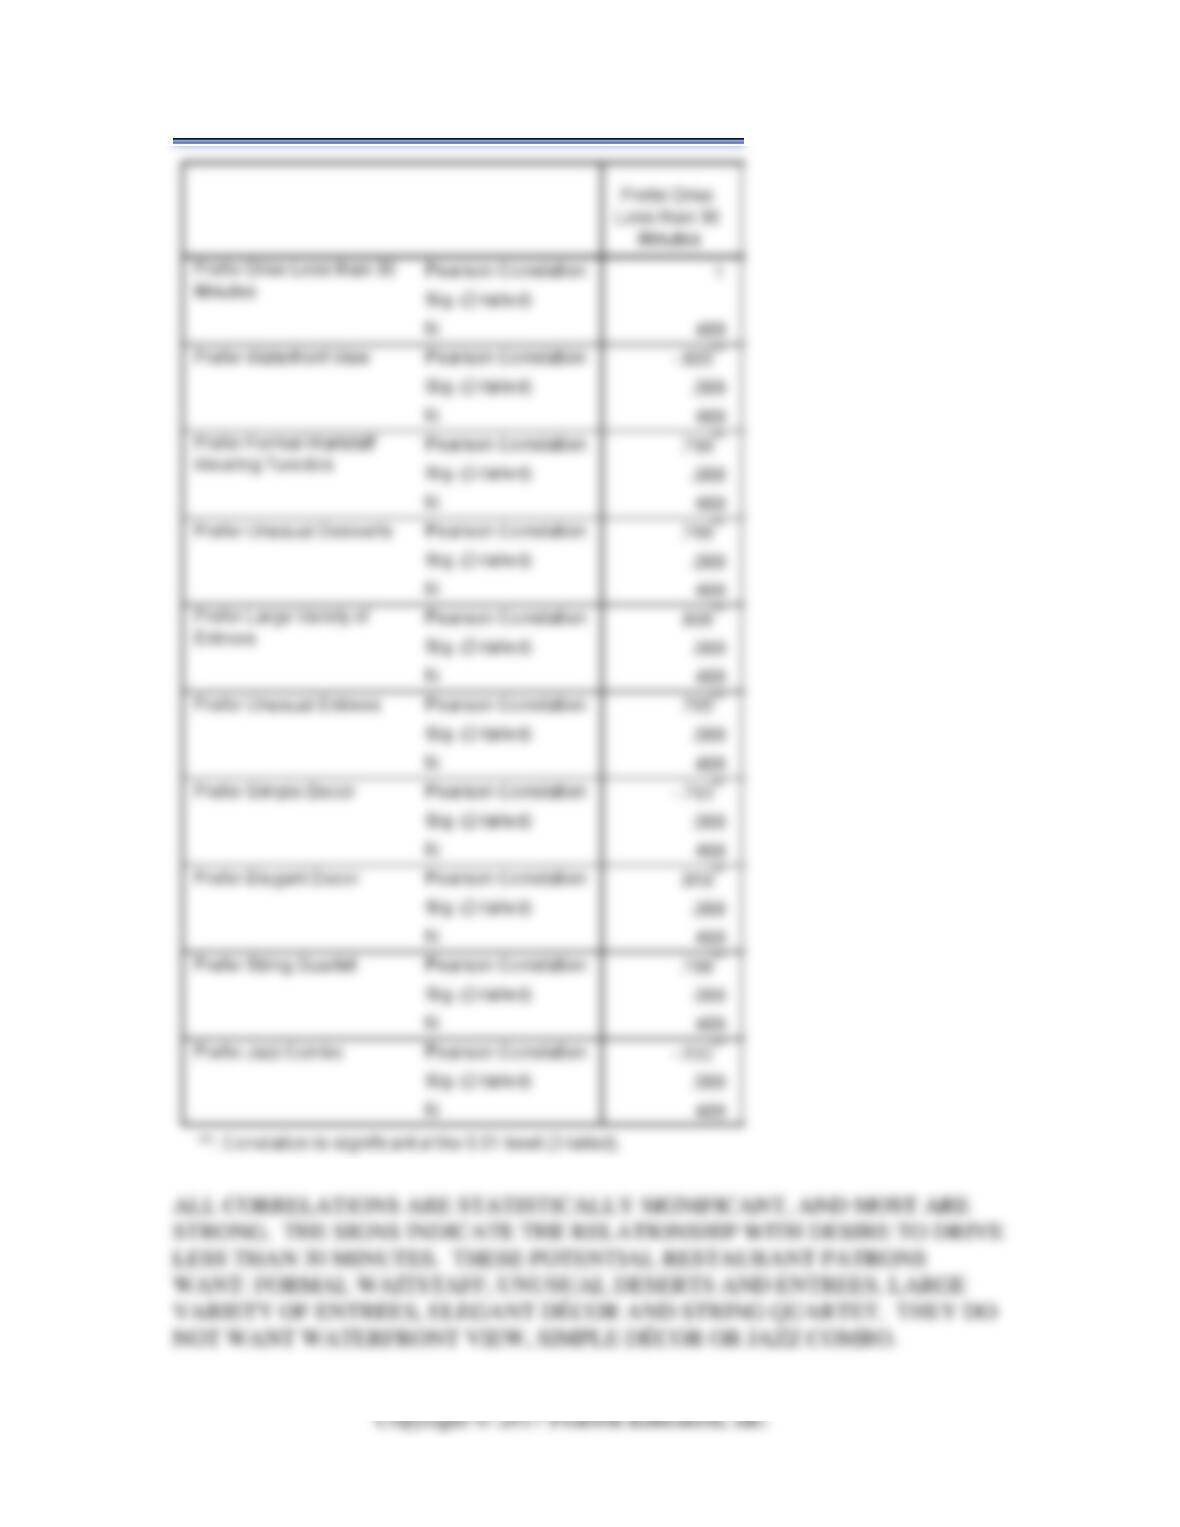
1. Perform the correct analysis and interpret your findings with regard to
L’Experience Félicité Restaurant menu, décor, and atmosphere for those people
who prefer to drive less than 30 minutes to get to the restaurant.
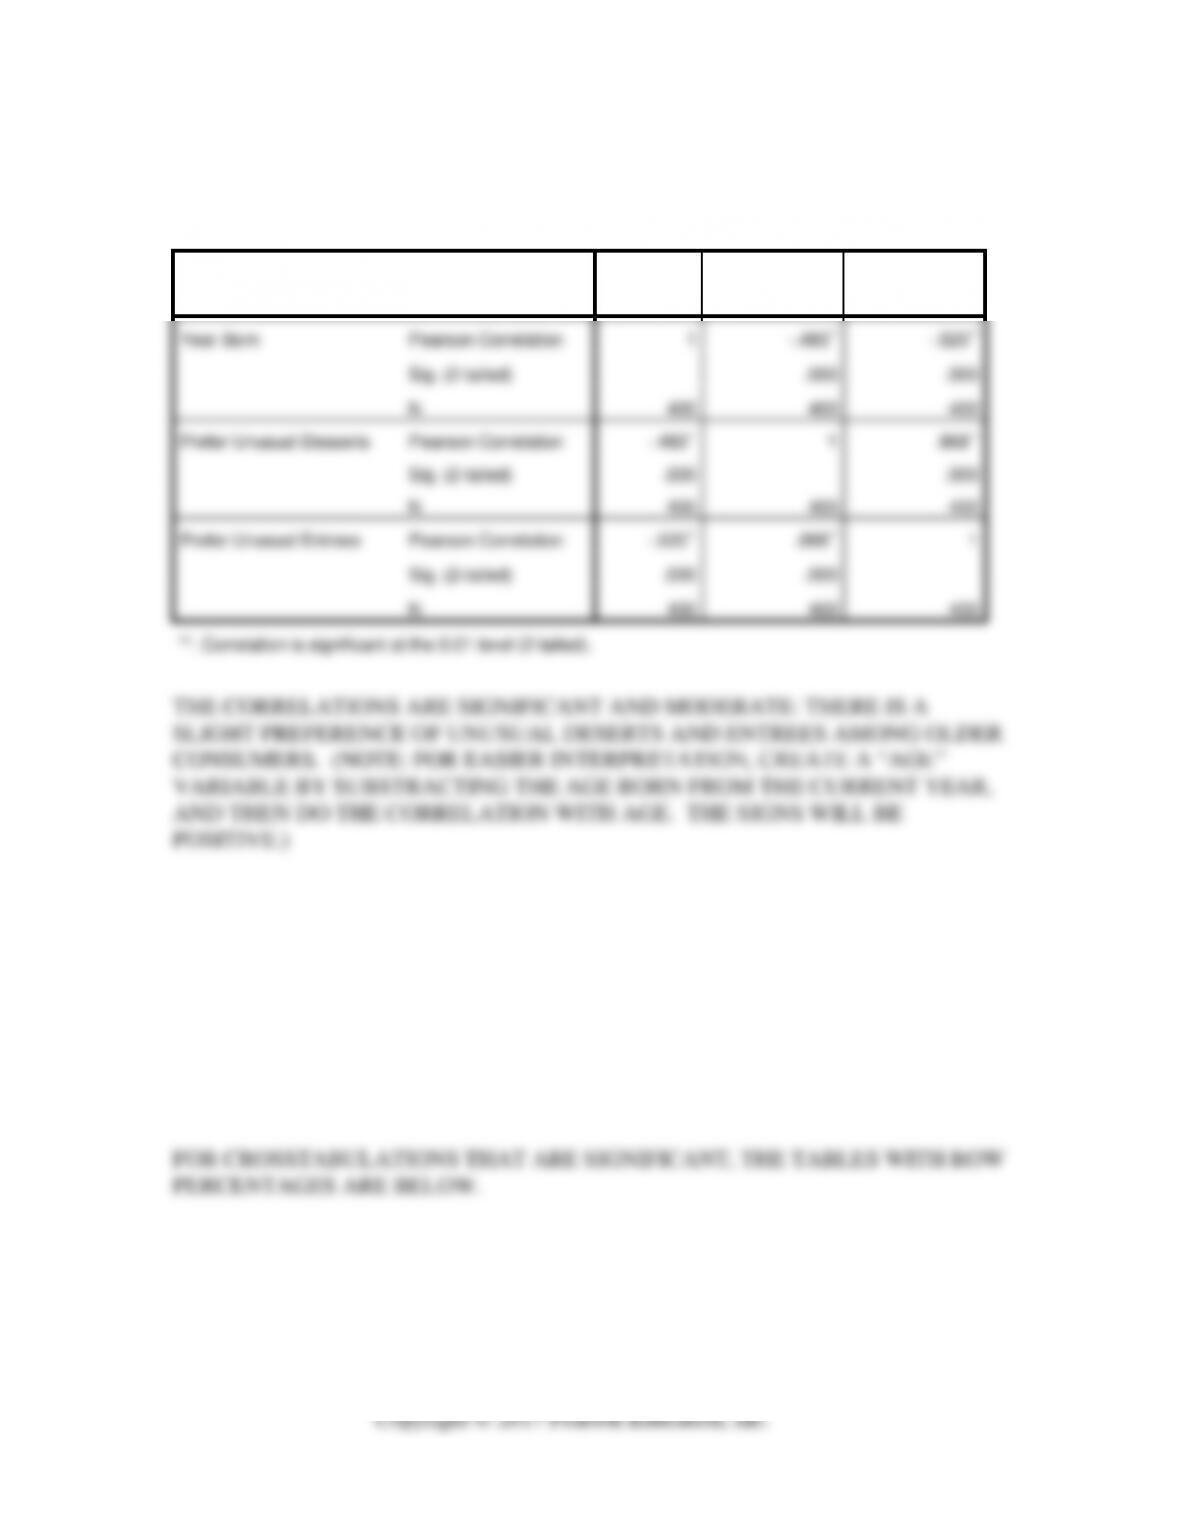
2. Do older or younger people want unusual desserts and/or unusual entrees?
Correlations
Year Born
Prefer Unusual
Desserts
Prefer Unusual
Entrees
Year Born
Pearson Correlation
1
-.483**
-.520**
Sig. (2-tailed)
.000
.000
N
400
400
400
Prefer Unusual Desserts
Pearson Correlation
-.483**
1
.868**
Sig. (2-tailed)
.000
.000
N
400
400
400
Prefer Unusual Entrees
Pearson Correlation
-.520**
.868**
1
Sig. (2-tailed)
.000
.000
N
400
400
400
**. Correlation is significant at the 0.01 level (2-tailed).
THE CORRELATIONS ARE SIGNIFICANT AND MODERATE: THERE IS A
SLIGHT PREFERENCE OF UNUSUAL DESERTS AND ENTREES AMONG OLDER
CONSUMERS. (NOTE: FOR EASIER INTERPRETATION, CREATE A “AGE”
VARIABLE BY SUBSTRACTING THE AGE BORN FROM THE CURRENT YEAR,
AND THEN DO THE CORRELATION WITH AGE. THE SIGNS WILL BE
POSITIVE.)
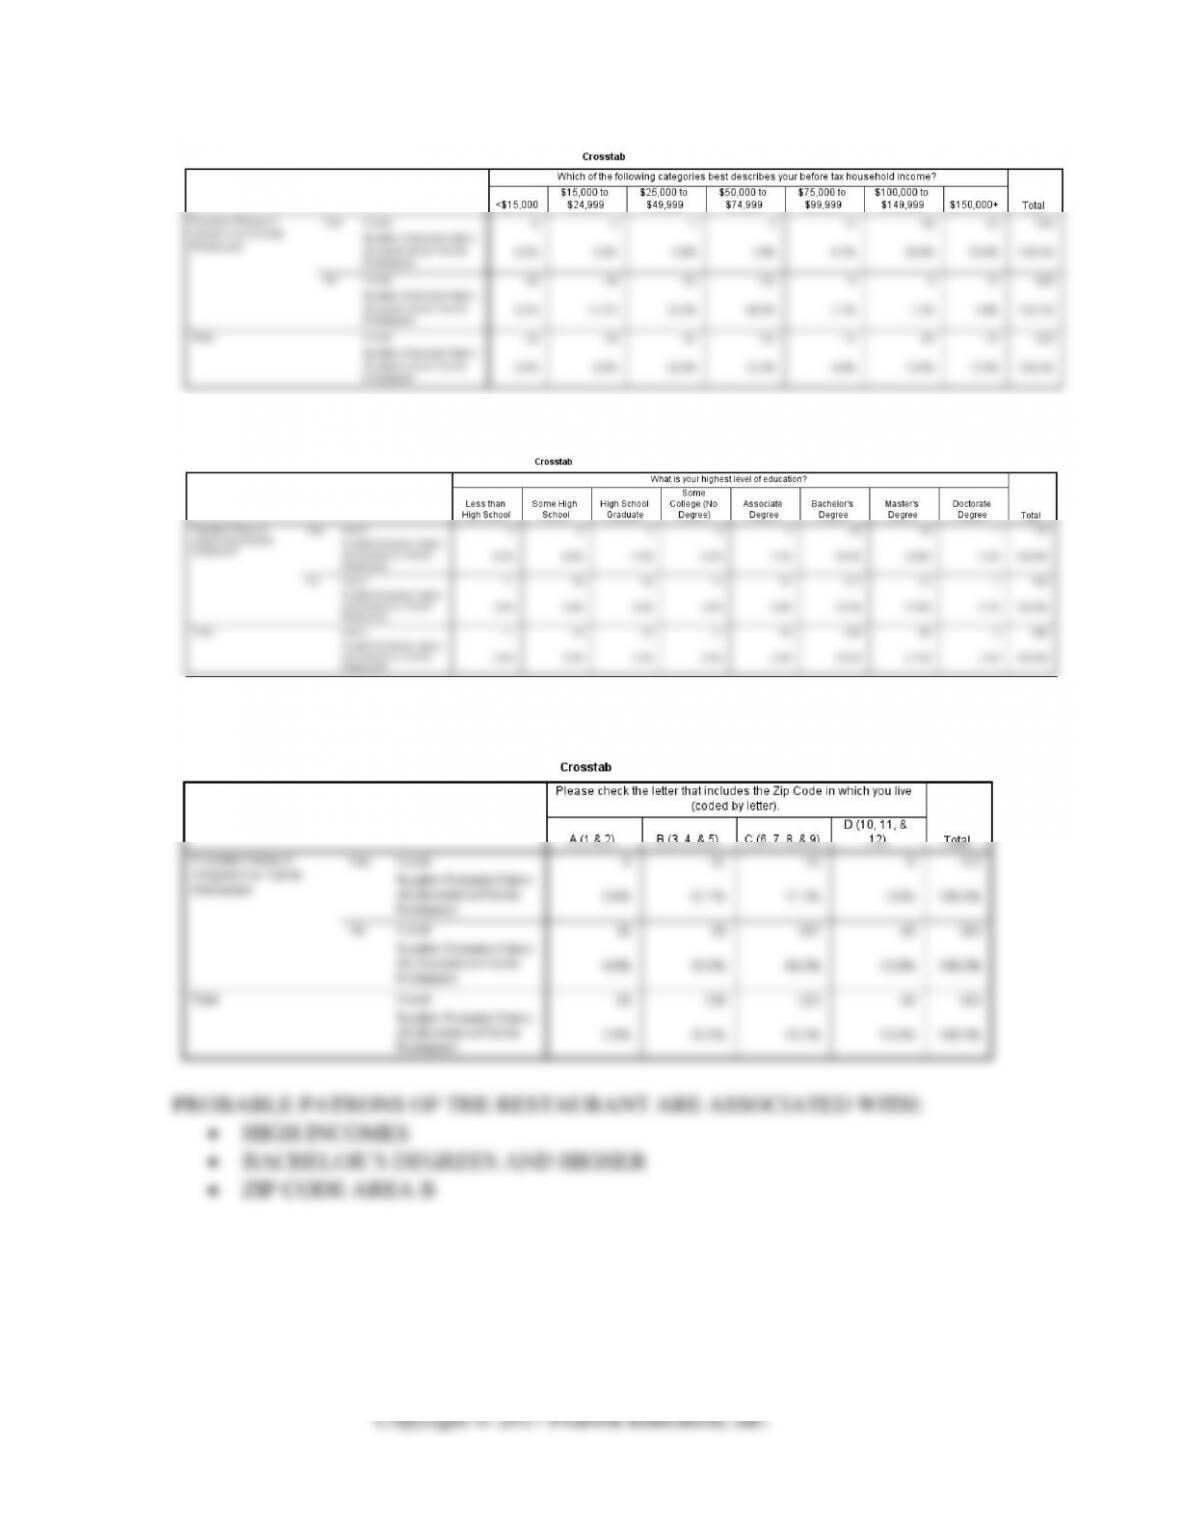
3. Use the variable that distinguishes the “Probable patrons” of L’Experience
Félicité Restaurant (Likely to patronize =1 or =2) from the “Not probable
patrons” (likely to patronize =3, =4, or =5). If the probable patrons constitute
the L’Experience Félicité Restaurant’s target market, what is the demographic
makeup of this target market? Use the demographics of household income,
education level, gender, and Zip code.
4. Is City Magazine is a viable advertising medium for Jeff Dean to use? Apart from
this question, are there other viable promotion vehicles that Jeff should know about?
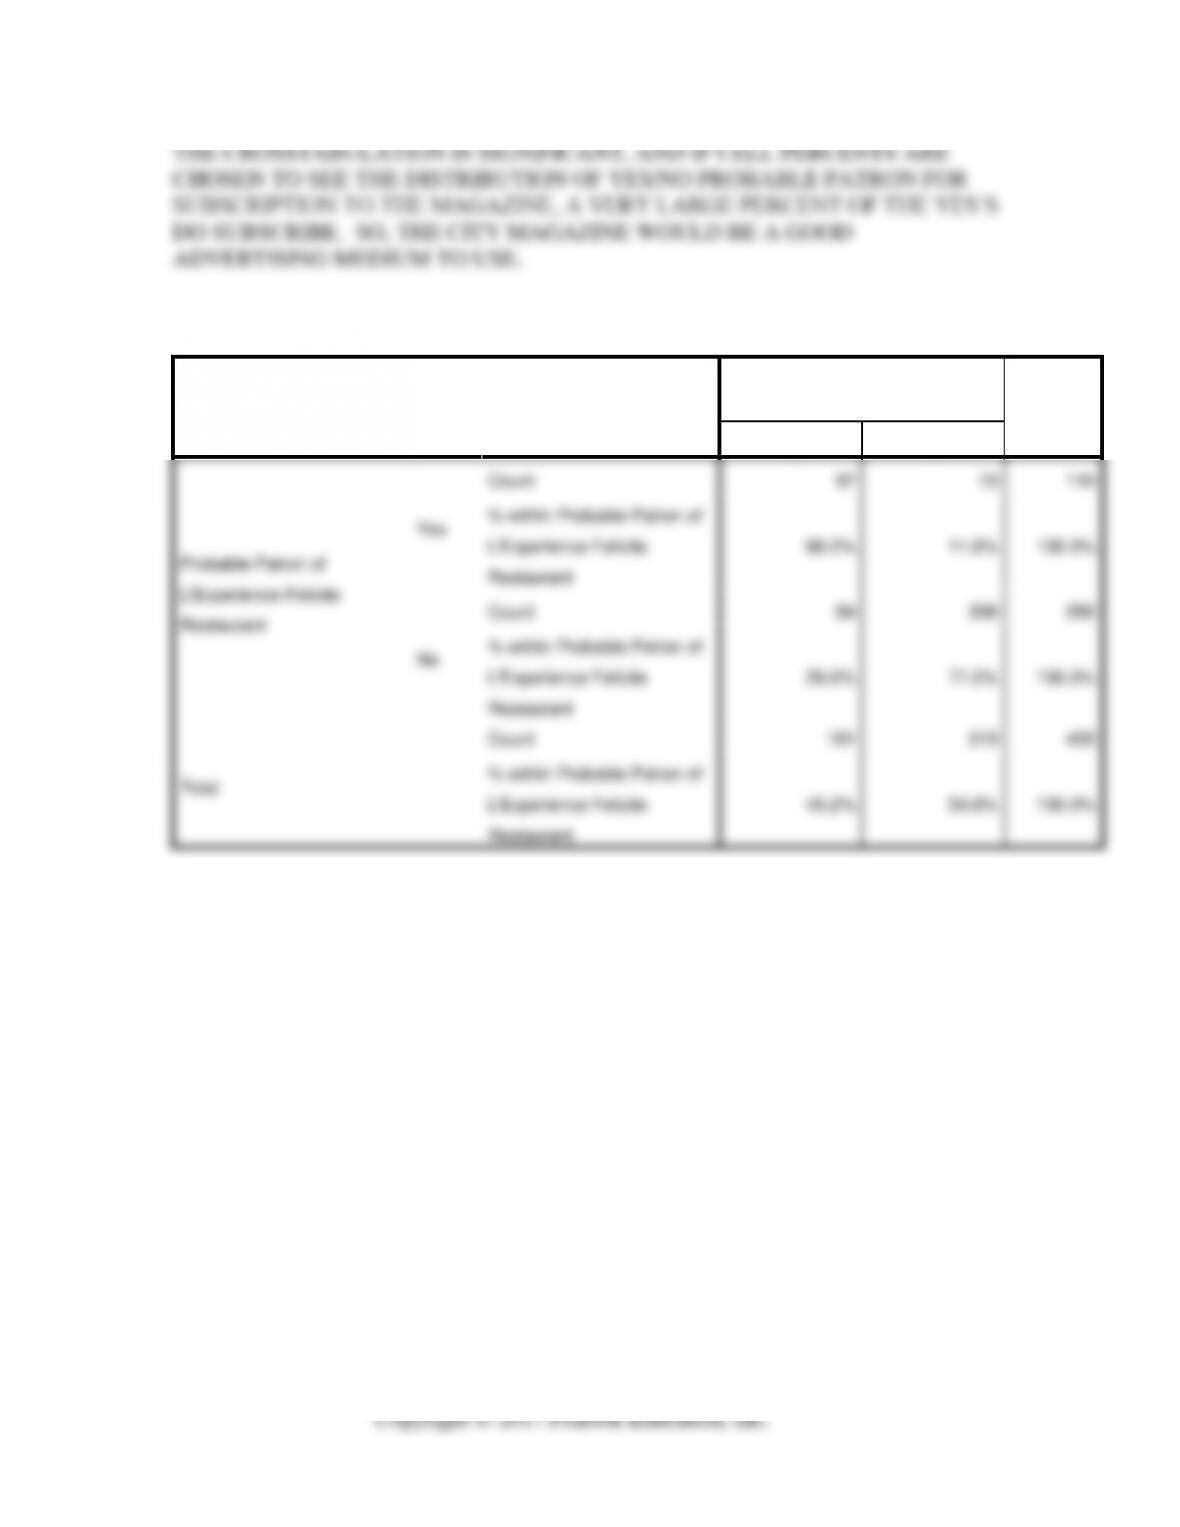
Probable Patron of L’Experience Felicite Restaurant * Do you subscribe to City Magazine? Crosstabulation
Do you subscribe to City
Magazine?
Total
Yes
No
Probable Patron of
L’Experience Felicite
Restaurant
Yes
Count
97
13
110
% within Probable Patron of
L’Experience Felicite
Restaurant
88.2%
11.8%
100.0%
No
Count
84
206
290
% within Probable Patron of
L’Experience Felicite
Restaurant
29.0%
71.0%
100.0%
Total
Count
181
219
400
% within Probable Patron of
L’Experience Felicite
Restaurant
45.2%
54.8%
100.0%
Case 14.2 The Auto Concepts Survey Association Analysis
Case Objective
This case item requires students to identify the proper associative analysis, run it with
SPSS, and interpret the findings with respect to implications for integrated case,
Advanced Automobile Concepts SPSS dataset.
Answers to Case Questions
1. Use each unique automobile model demographic profile to determine whether or
not statistically significant associations exist, and if they do, recommend the
specific media vehicles for radio, newspaper, television, and magazines. Do not
forget to use the advertising division’s preferred demographic for each medium.
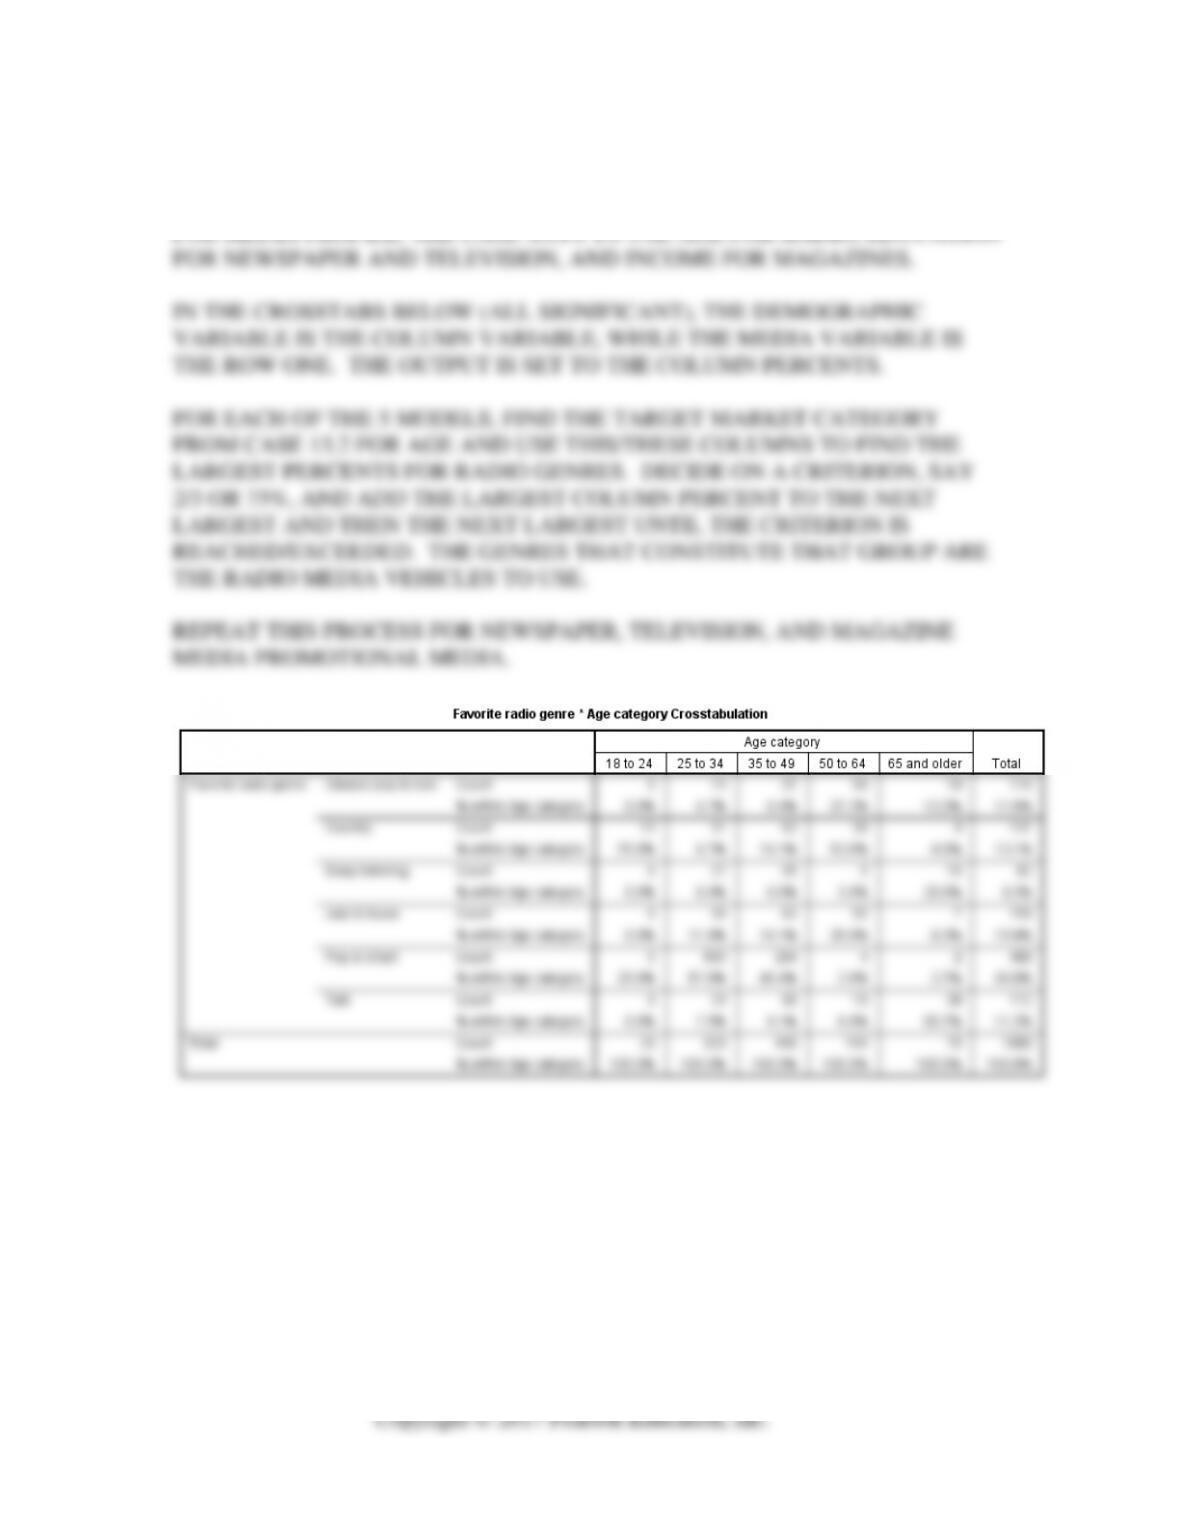
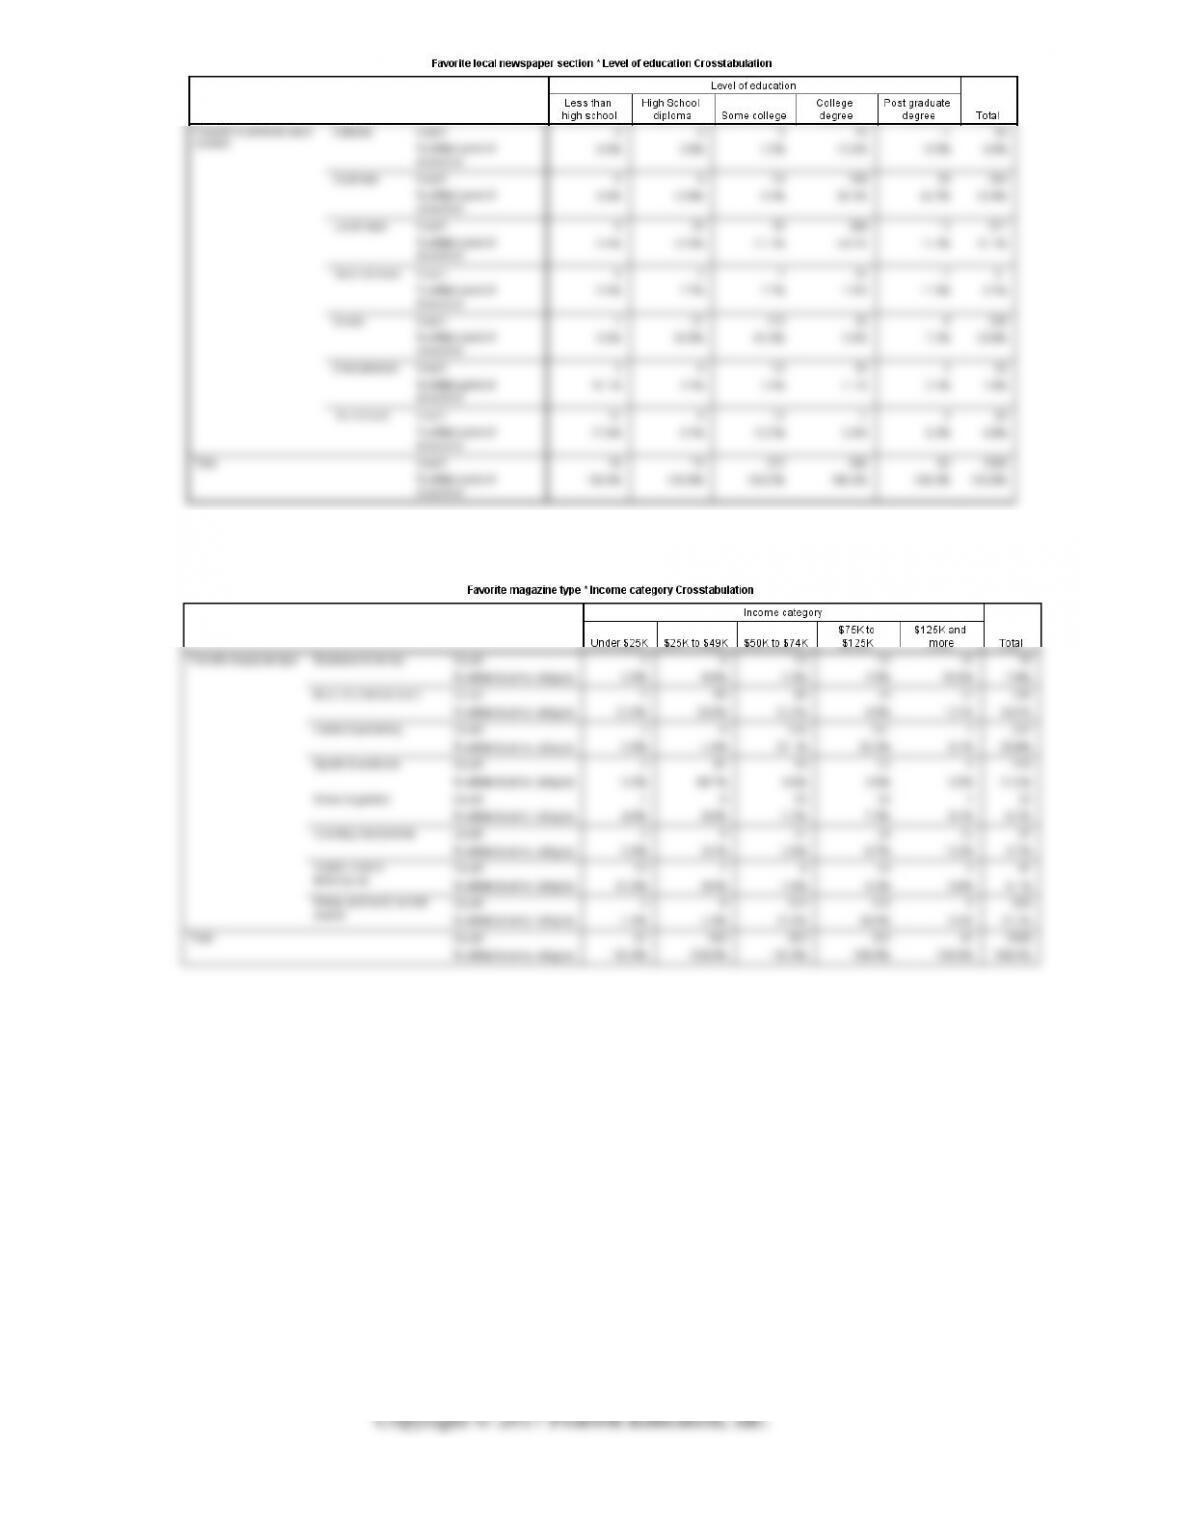
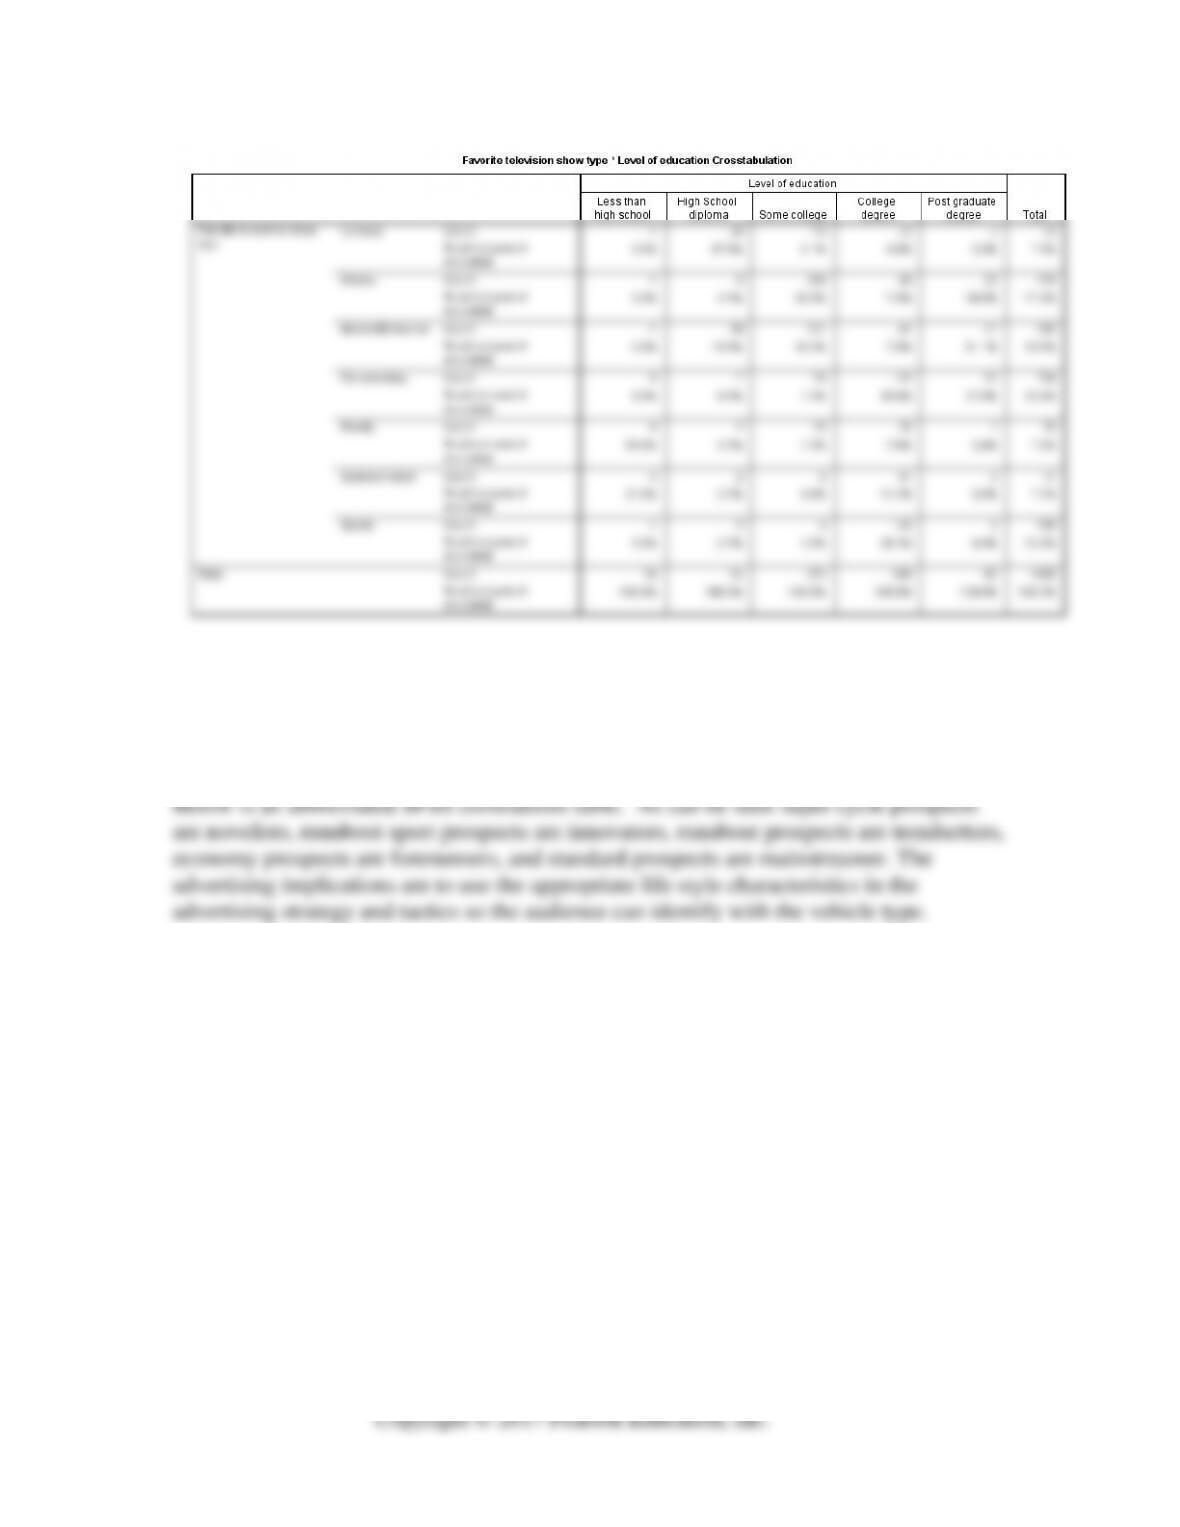
NOTE THAT THE CASE SAYS TO USE THE ANALYSIS RESULTS FROM CASE
13.2 WHERE THE DEMOGRAPHIC TARGET MARKETS WERE DETERMINED.
FOR MEDIA PROFILE, THE CASE SAYS TO USE AGE FOR RADIO, EDUCATION
2. What is the social media profile of each of the possible target markets, and what are
the implications of this finding for the placement of advertising messages that would
“speak” to this market segment when the automobile model is introduced?