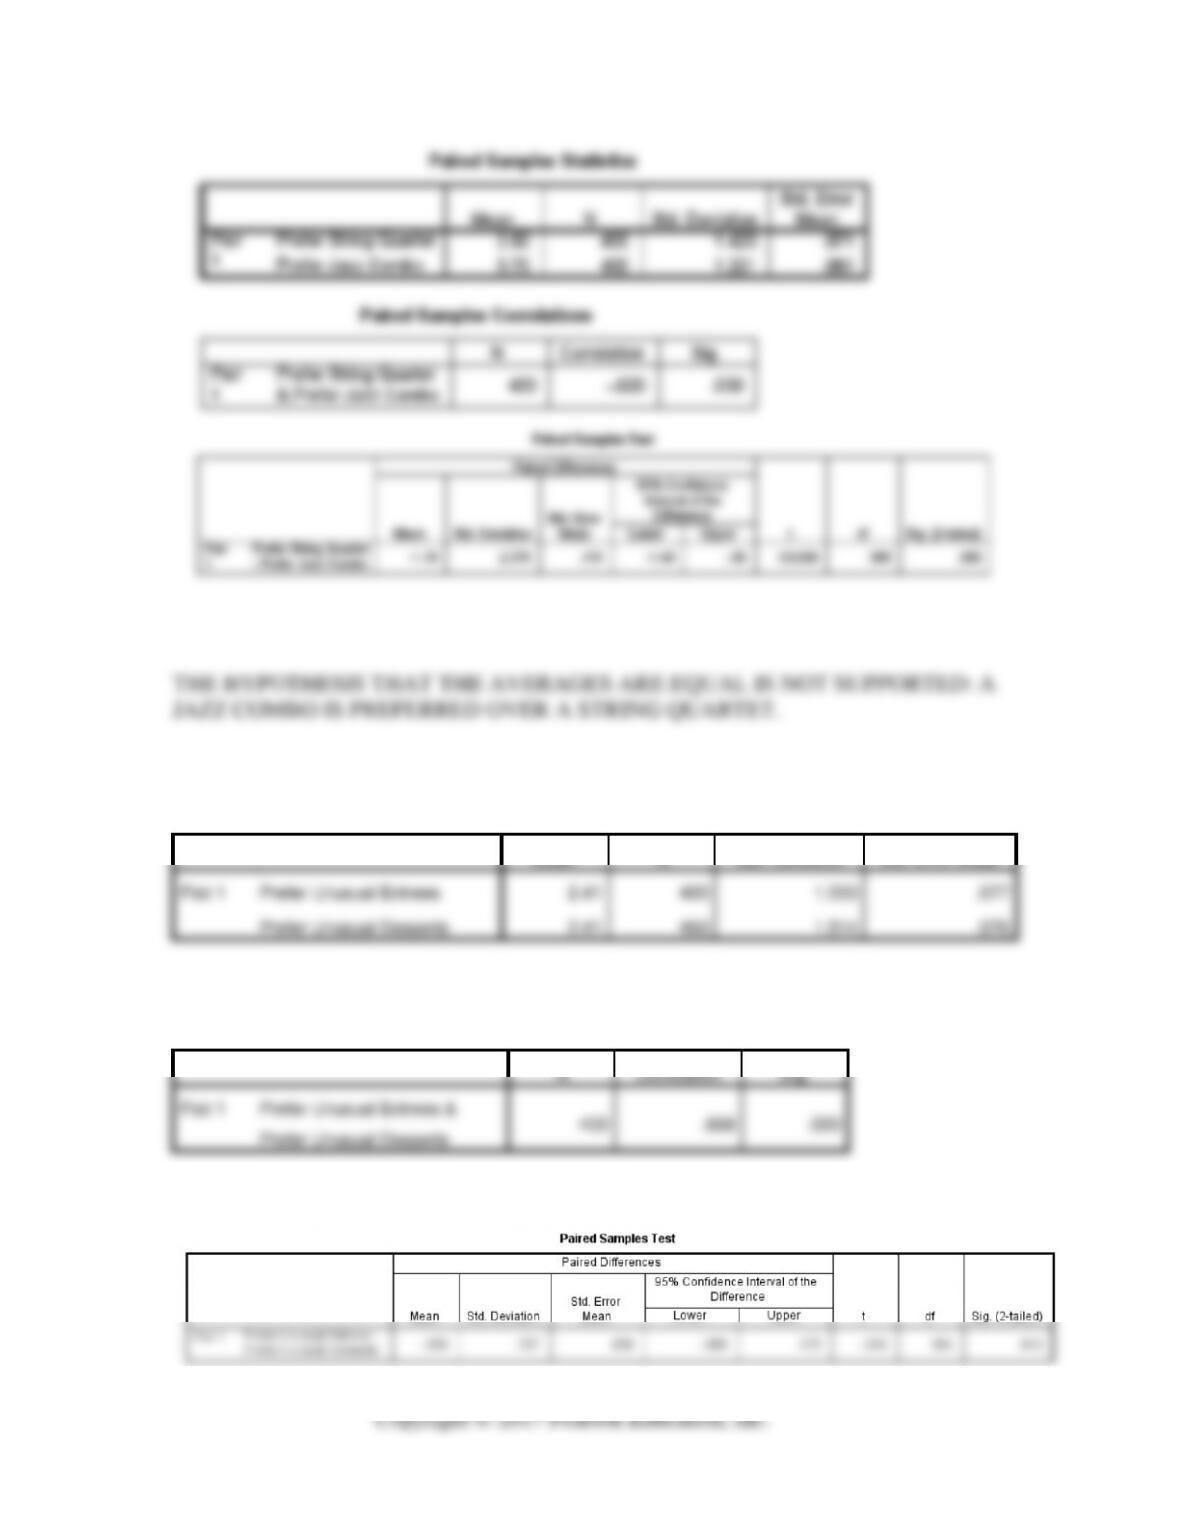
4. What about unusual entrees versus unusual desserts?
Paired Samples Statistics
Mean
N
Std. Deviation
Std. Error Mean
Pair 1
Prefer Unusual Entrees
2.41
400
1.550
.077
Prefer Unusual Desserts
2.41
400
1.514
.076
Paired Samples Correlations
N
Correlation
Sig.
Pair 1
Prefer Unusual Entrees &
Prefer Unusual Desserts
400
.868
.000
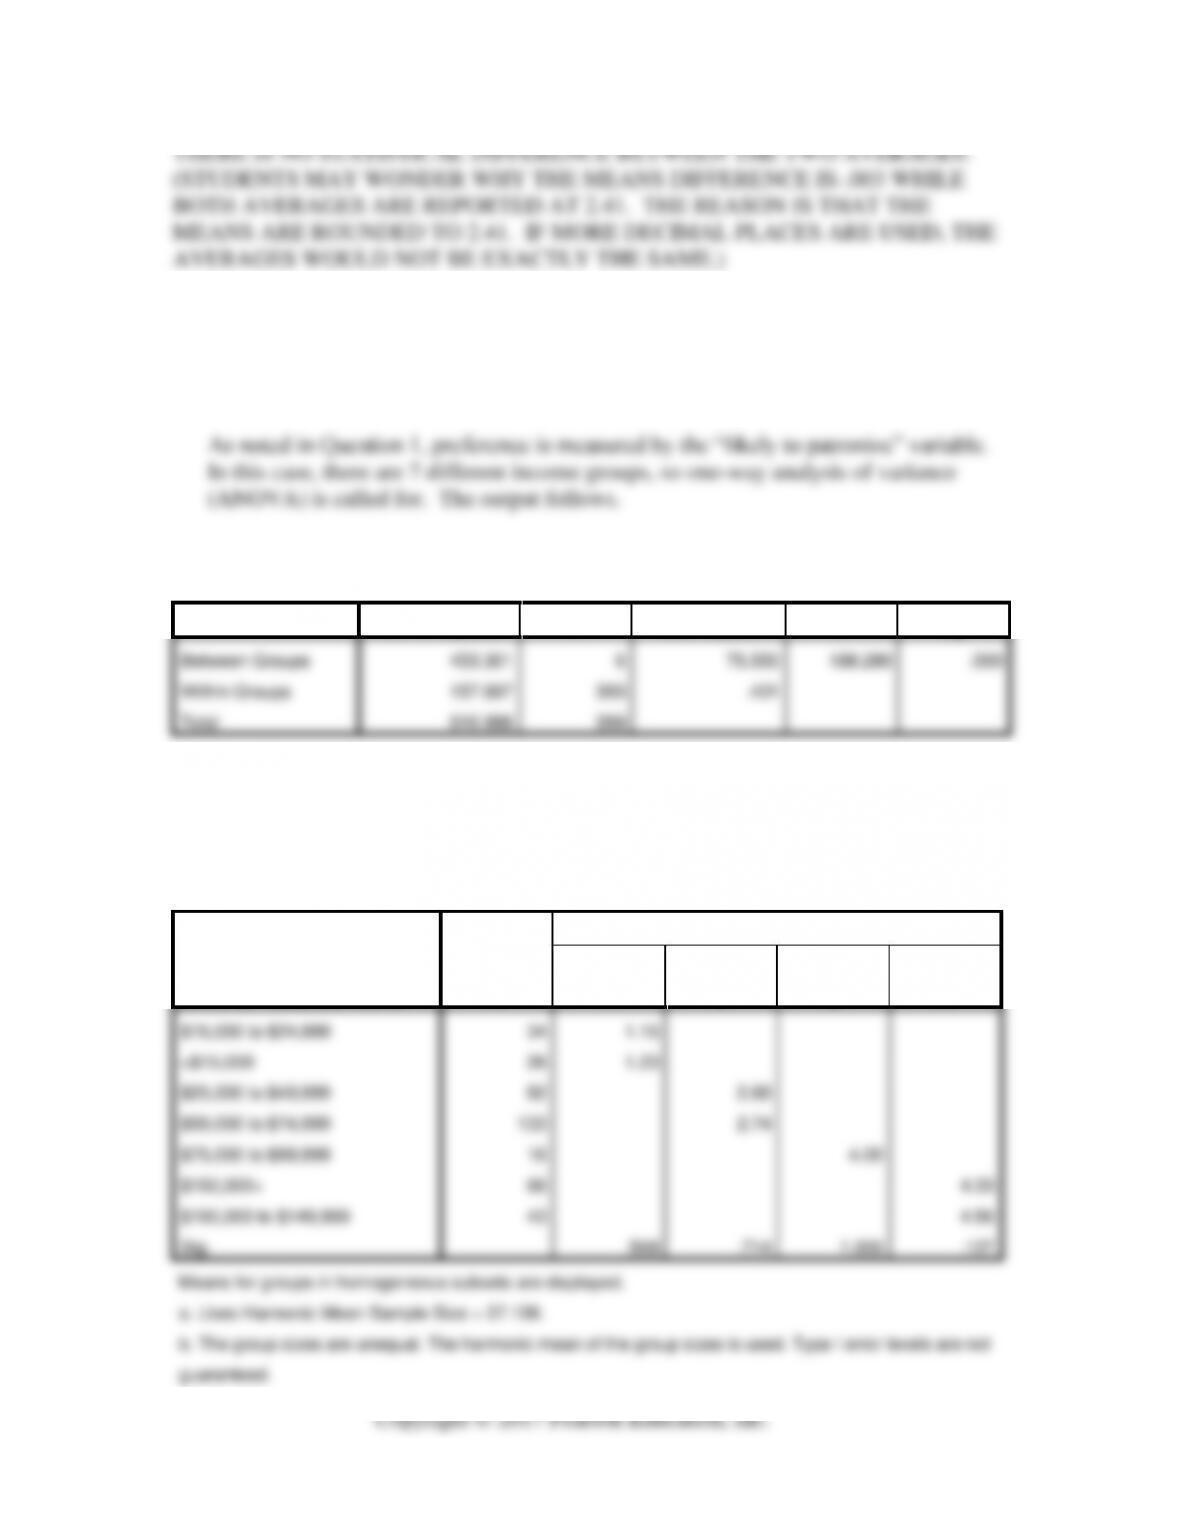
5. In general, upscale establishments are more appealing to higher income households,
than they are to lower income households. Is this pattern the case for L’Experience
Félicité Restaurant?
ANOVA
How likely would it be for you to patronize this restaurant (new upscale restaurant)?
Sum of Squares
df
Mean Square
F
Sig.
Between Groups
453.301
6
75.550
188.280
.000
Within Groups
157.697
393
.401
Total
610.998
399
Post Hoc Tests
Homogeneous Subsets
How likely would it be for you to patronize this restaurant (new upscale restaurant)?
Duncana,b
Which of the following
categories best describes your
before tax household income?
N
Subset for alpha = 0.05
1
2
3
4
$15,000 to $24,999
34
1.15
<$15,000
26
1.23
$25,000 to $49,999
82
2.68
$50,000 to $74,999
133
2.74
$75,000 to $99,999
16
4.00
$150,000+
66
4.33
$100,000 to $149,999
43
4.56
Sig.
.569
.714
1.000
.127
Means for groups in homogeneous subsets are displayed.
a. Uses Harmonic Mean Sample Size = 37.136.
b. The group sizes are unequal. The harmonic mean of the group sizes is used. Type I error levels are not
guaranteed.
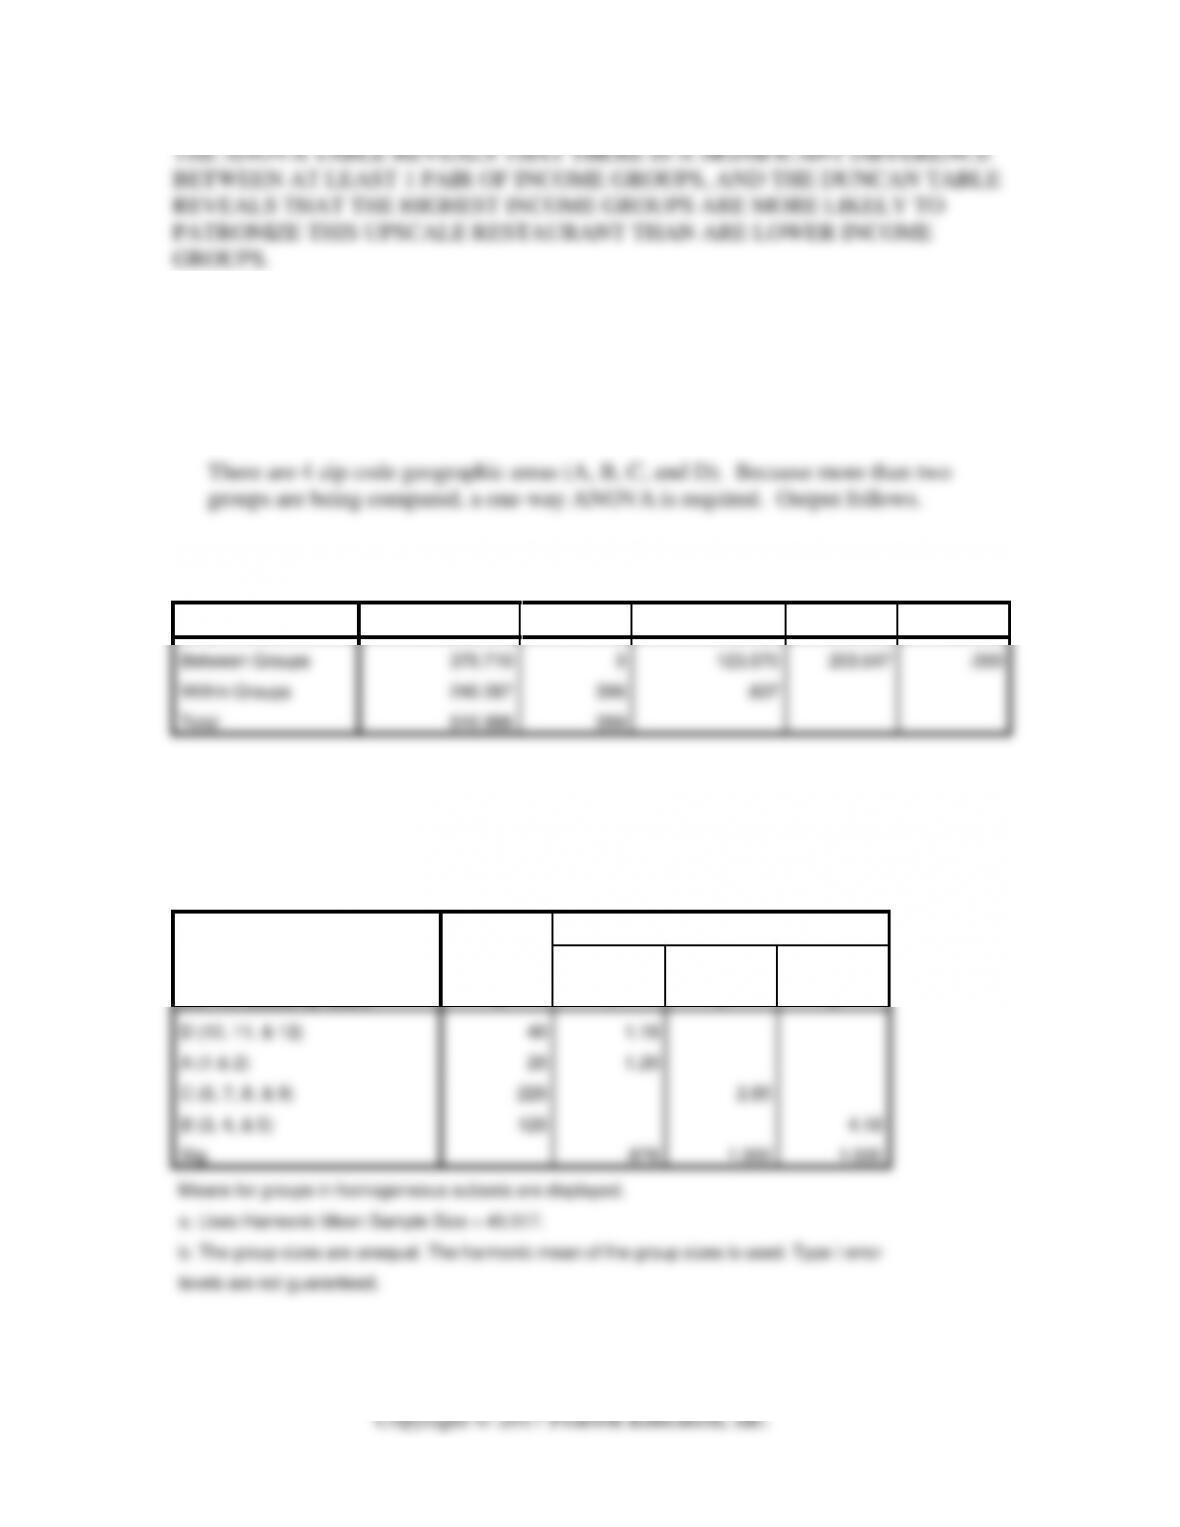
6. Jeff and Cory speculated that the different geographic areas that they identified by
Zip codes would have different reactions to the prospect of patronizing a new upscale
restaurant. Are these anticipated differences substantiated by the survey? Perform
the proper analysis and interpret your findings.
ANOVA
How likely would it be for you to patronize this restaurant (new upscale restaurant)?
Sum of Squares
df
Mean Square
F
Sig.
Between Groups
370.710
3
123.570
203.647
.000
Within Groups
240.287
396
.607
Total
610.998
399
Post Hoc Tests
Homogeneous Subsets
How likely would it be for you to patronize this restaurant (new upscale restaurant)?
Duncana,b
Please check the letter that
includes the Zip Code in which
you live (coded by letter).
N
Subset for alpha = 0.05
1
2
3
D (10, 11, & 12)
40
1.18
A (1 & 2)
20
1.20
C (6, 7, 8, & 9)
220
2.85
B (3, 4, & 5)
120
4.18
Sig.
.878
1.000
1.000
Means for groups in homogeneous subsets are displayed.
a. Uses Harmonic Mean Sample Size = 45.517.
b. The group sizes are unequal. The harmonic mean of the group sizes is used. Type I error
levels are not guaranteed.
Case 13.2 The Auto Concepts Survey Differences Analysis
Case Objective
Answers to Case Questions
Your task is to apply appropriate differences analysis using the survey’s desirability
measures in your Auto Concepts SPSS dataset to determine the target market
descriptions for each of the five possible automobile models:
The nominal demographic variables are: Hometown size category, gender, marital
status, age category, education category, and income category. Only gender and
marital status have 2 groups, so do an independent samples t-test for it and ANOVA’s
for all others. This groups with the highest average preference and significantly
different from other groups are the targets. To conserve space, the output is not
provides, but the findings are summarized below (using 95% level of significance).
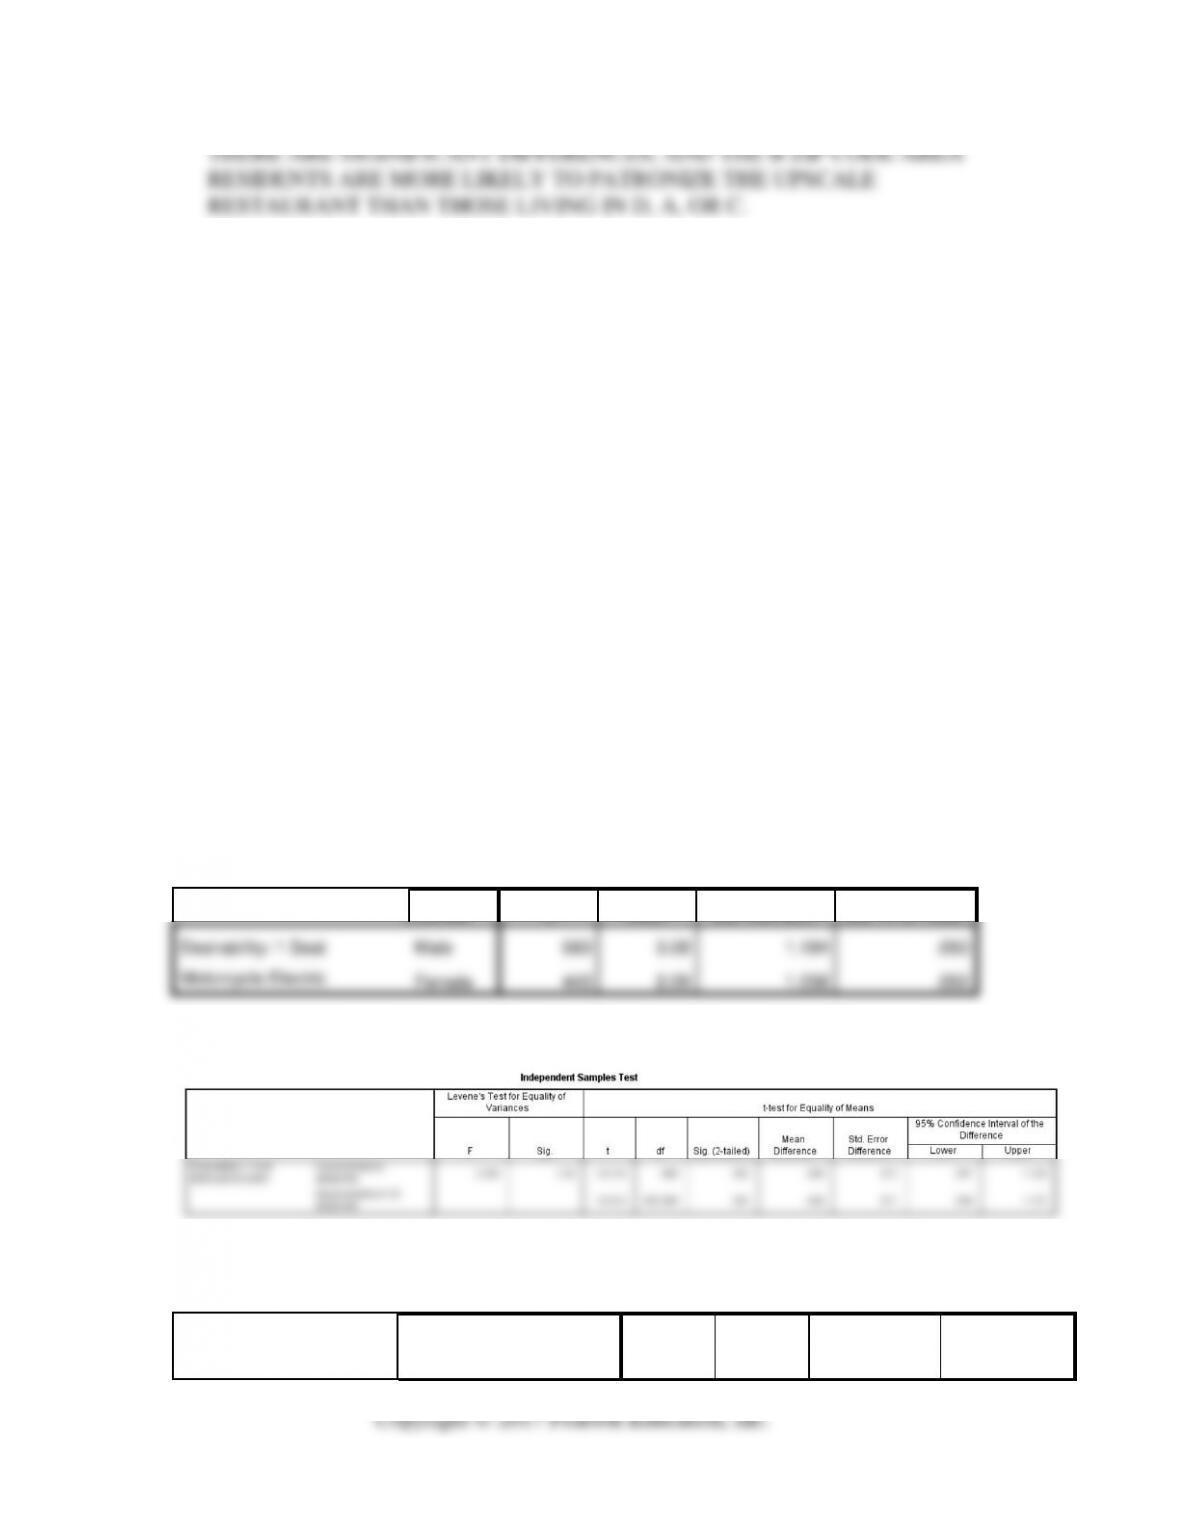
1. “Super Cycle,” One-Seat All Electric, mpg-e rating 125; estimated MSRP
(manufacturer’s suggested retail price) $30,000; range 200 miles.
Group Statistics
Gender
N
Mean
Std. Deviation
Std. Error Mean
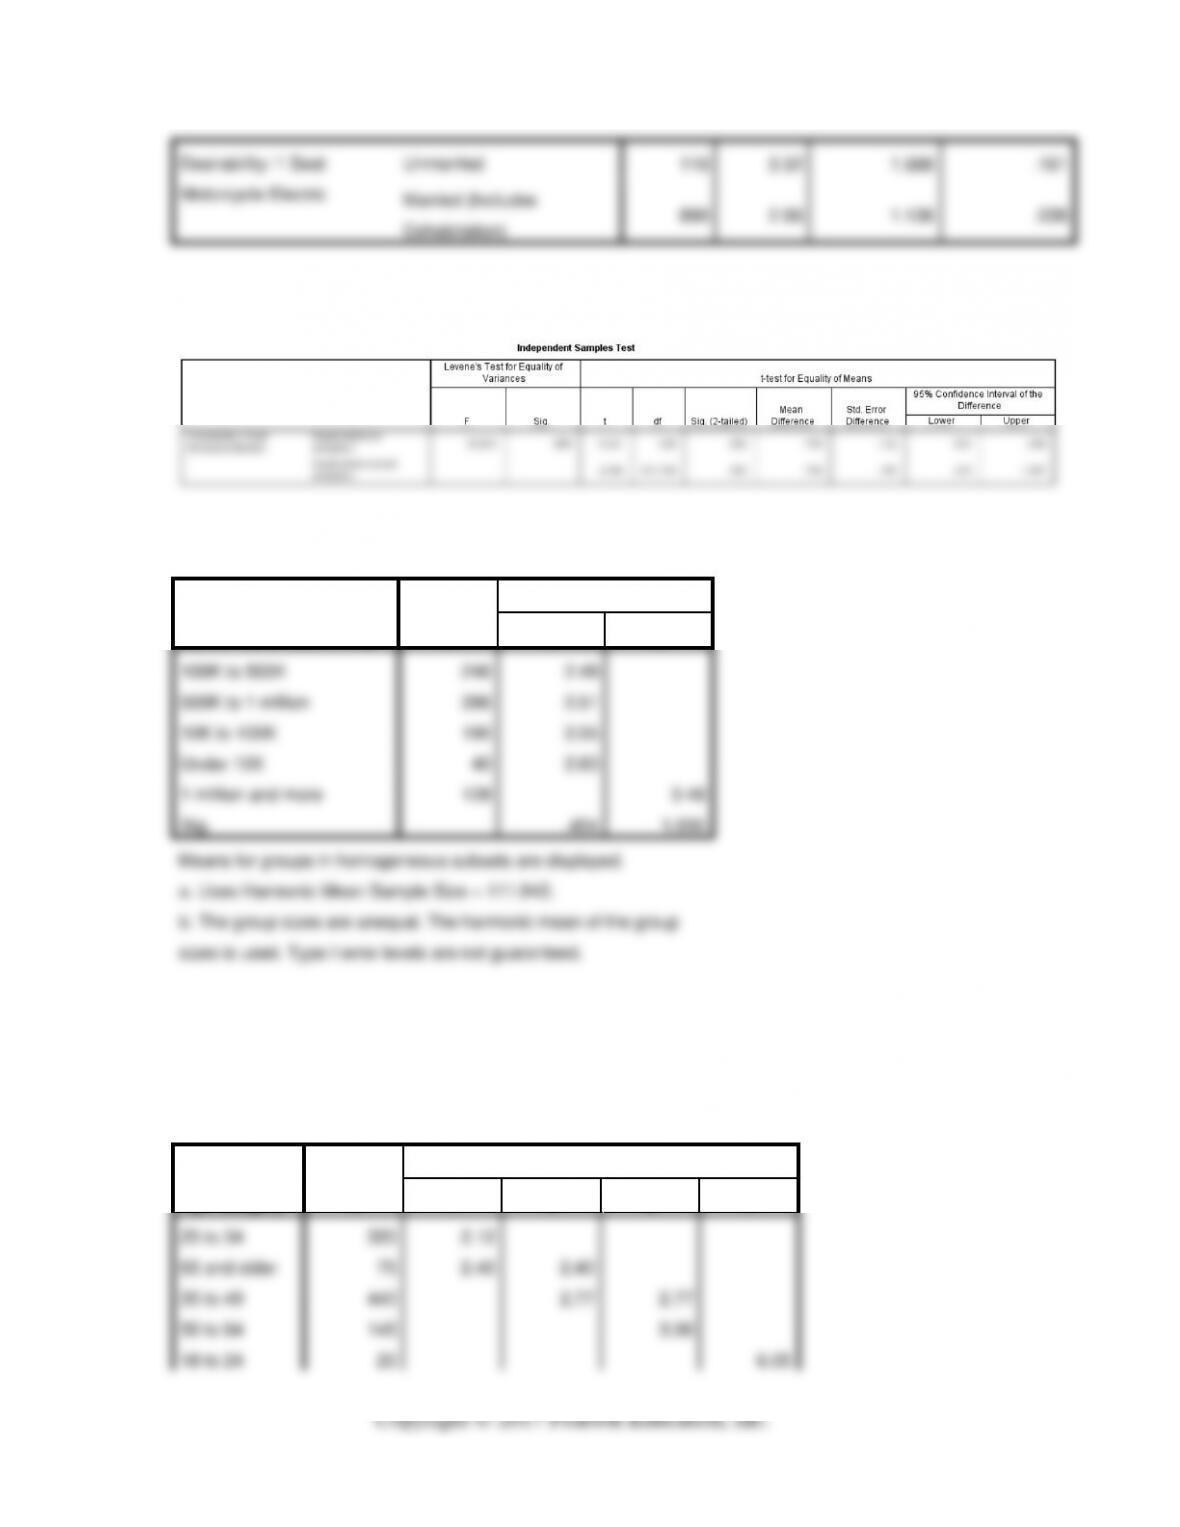
Desirability: 1 Seat
Motorcycle Electric
Male
560
3.08
1.184
.050
Female
440
2.09
1.056
.050
Group Statistics
Marital status
N
Mean
Std. Deviation
Std. Error
Mean
Desirability: 1 Seat
Motorcycle Electric
Unmarried
110
3.32
1.686
.161
Married (Includes
Cohabitation)
890
2.56
1.136
.038
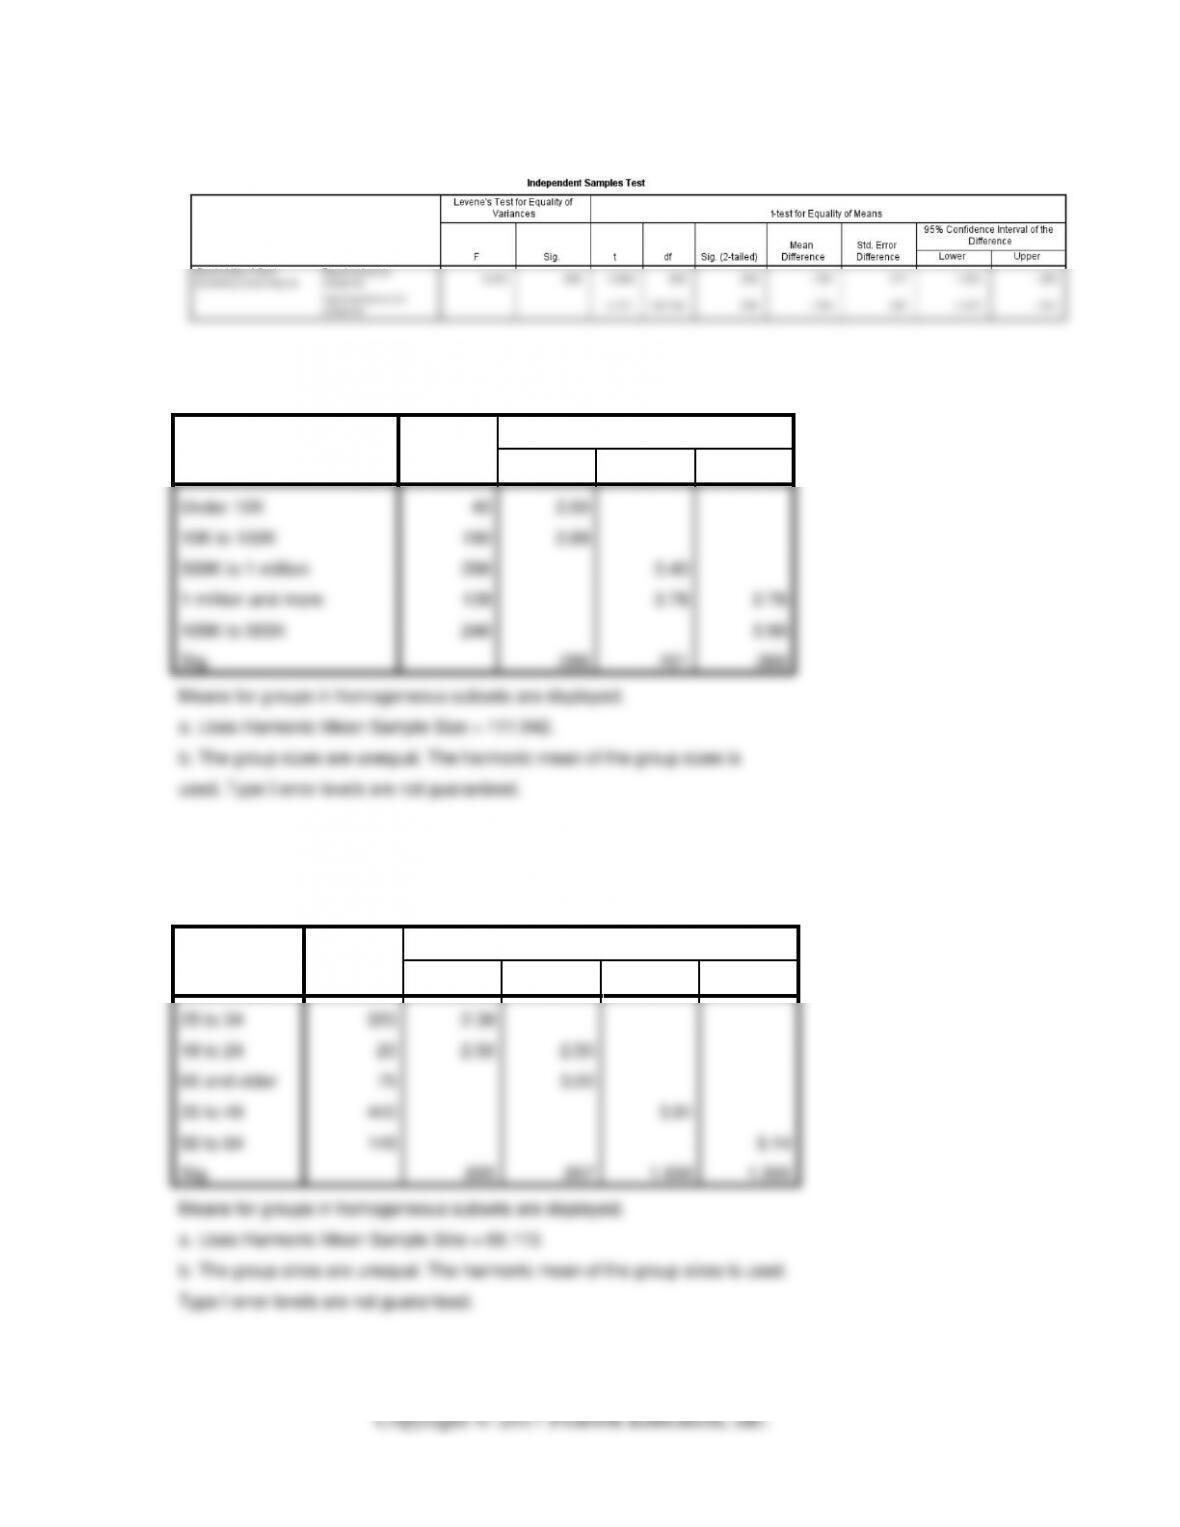
Desirability: 1 Seat Motorcycle Electric
Duncana,b
Size of home town or city
N
Subset for alpha = 0.05
1
2
100K to 500K
246
2.49
500K to 1 million
396
2.51
10K to 100K
190
2.55
Under 10K
40
2.63
1 million and more
128
3.48
Sig.
.454
1.000
Means for groups in homogeneous subsets are displayed.
a. Uses Harmonic Mean Sample Size = 111.942.
b. The group sizes are unequal. The harmonic mean of the group
sizes is used. Type I error levels are not guaranteed.
Desirability: 1 Seat Motorcycle Electric
Duncana,b
Age category
N
Subset for alpha = 0.05
1
2
3
4
25 to 34
320
2.12
65 and older
75
2.40
2.40
35 to 49
440
2.77
2.77
50 to 64
145
3.06
18 to 24
20
6.05
Sig.
.139
.050
.118
1.000
Means for groups in homogeneous subsets are displayed.
a. Uses Harmonic Mean Sample Size = 66.113.
b. The group sizes are unequal. The harmonic mean of the group sizes is used.
Type I error levels are not guaranteed.
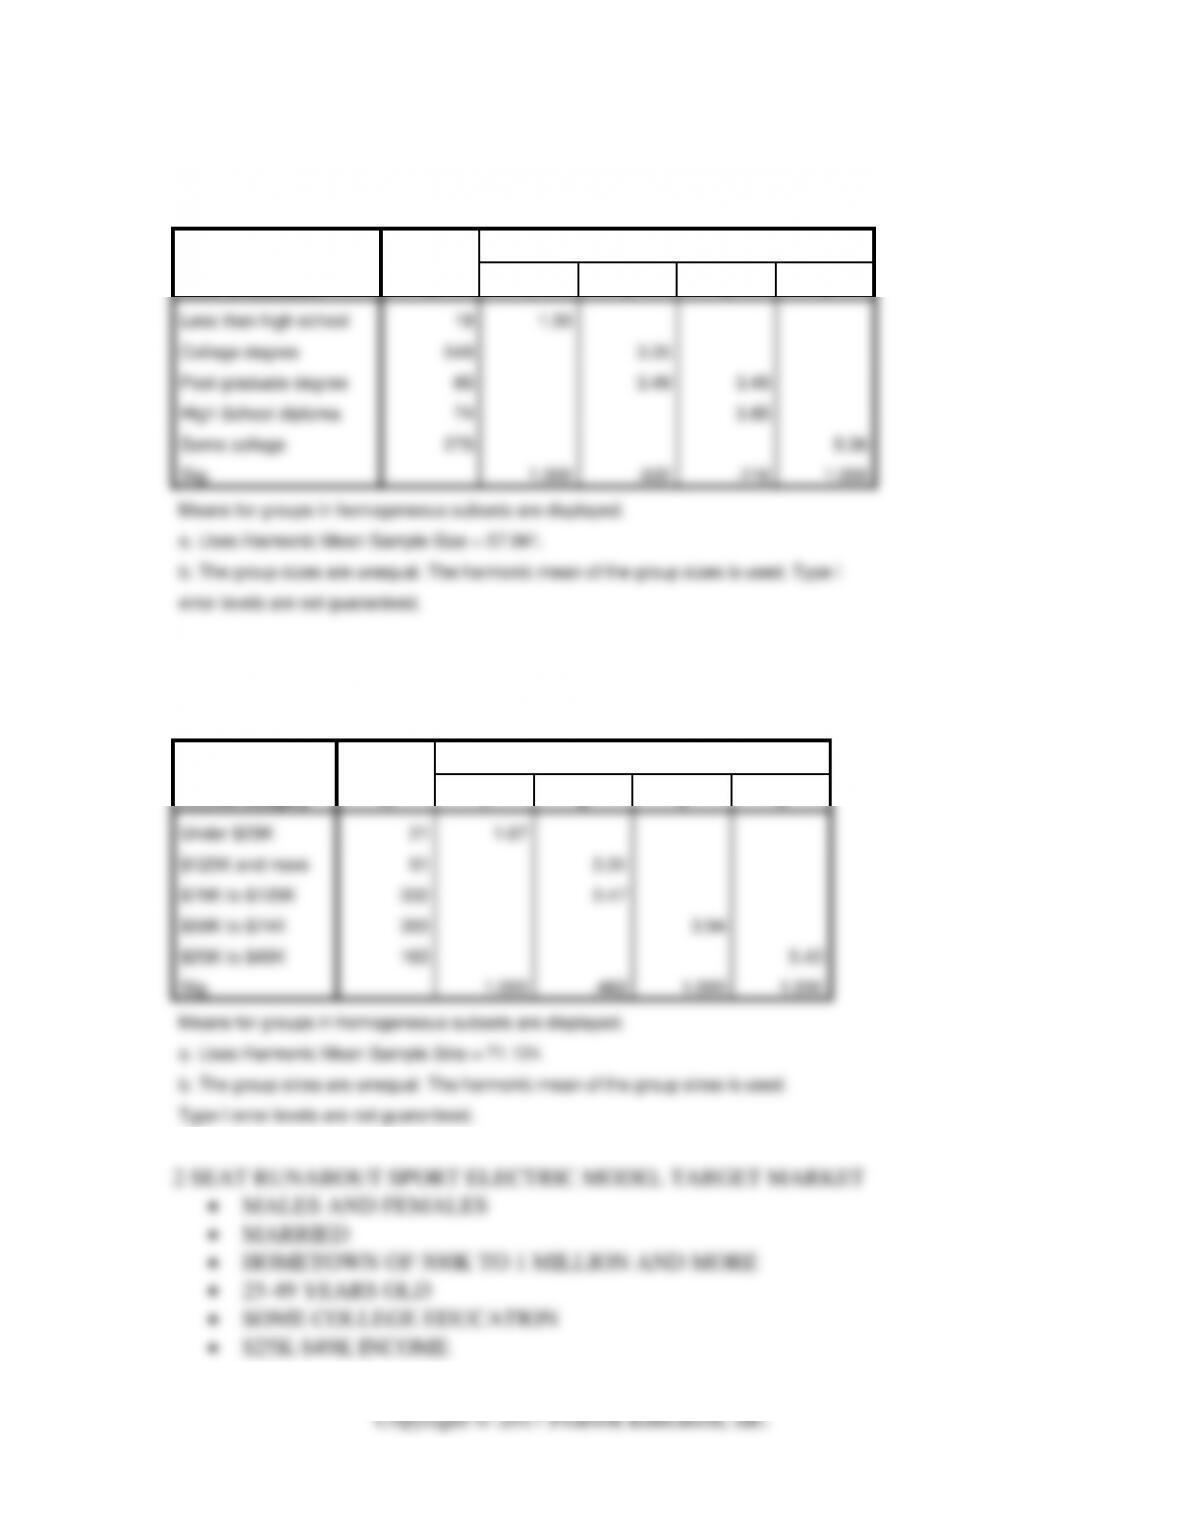
Desirability: 1 Seat Motorcycle Electric
Duncana,b
Level of education
N
Subset for alpha = 0.05
1
2
3
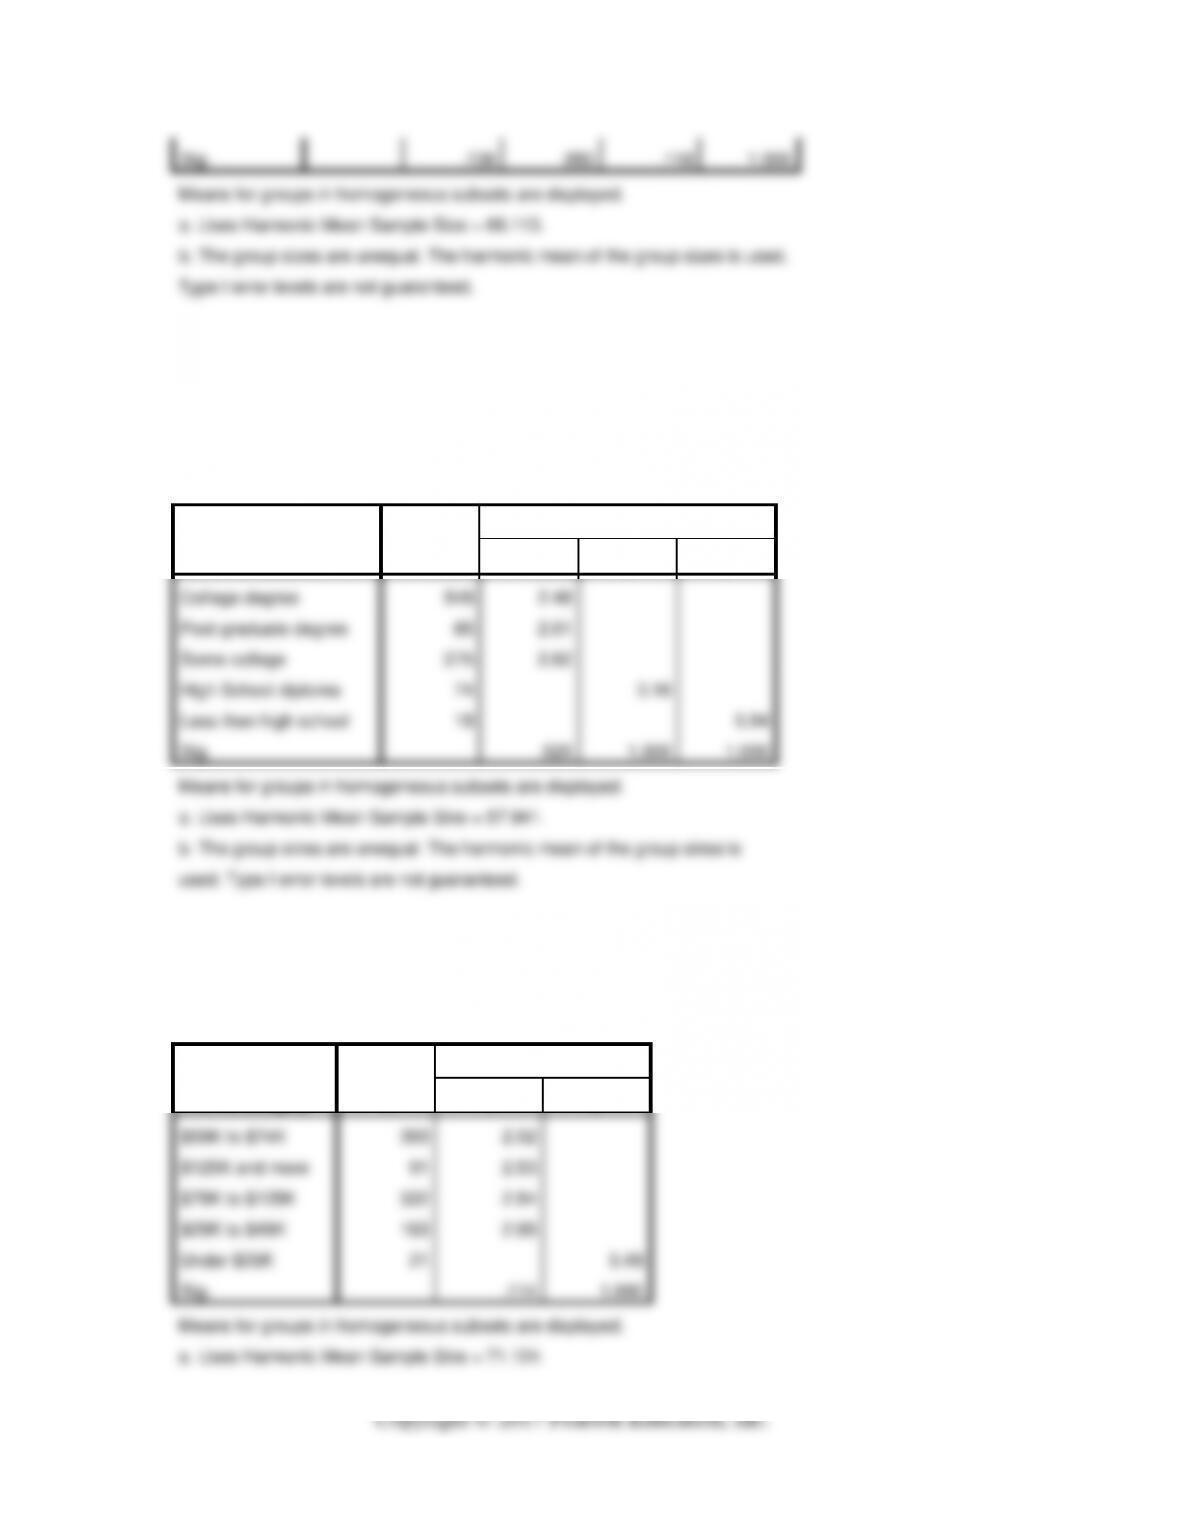
College degree
548
2.48
Post graduate degree
85
2.61
Some college
275
2.62
High School diploma
74
3.16
Less than high school
18
5.94
Sig.
.525
1.000
1.000
Means for groups in homogeneous subsets are displayed.
a. Uses Harmonic Mean Sample Size = 57.941.
b. The group sizes are unequal. The harmonic mean of the group sizes is
used. Type I error levels are not guaranteed.
Desirability: 1 Seat Motorcycle Electric
Duncana,b
Income category
N
Subset for alpha = 0.05
1
2
$50K to $74K
393
2.52
$125K and more
91
2.53
$75K to $125K
332
2.54
$25K to $49K
163
2.85
Under $25K
21
5.48
Sig.
.114
1.000
Means for groups in homogeneous subsets are displayed.
a. Uses Harmonic Mean Sample Size = 71.124.
b. The group sizes are unequal. The harmonic mean of the
group sizes is used. Type I error levels are not guaranteed.
2. “Runabout Sport,” Two-Seat All Electric, mpg-e 99; estimated MSRP $35,000; range
150 miles.
Group Statistics
Gender
N
Mean
Std. Deviation
Std. Error Mean
Desirability: 2 Seat
Runabout Sport Electric
Male
560
3.90
1.584
.067
Female
440
3.95
1.476
.070
Group Statistics
Marital status
N
Mean
Std. Deviation
Std. Error Mean
Desirability: 2 Seat Runabout
Sport Electric
Unmarried
110
3.50
2.089
.199
Married (Includes
Cohabitation)
890
3.97
1.447
.049
Desirability: 2 Seat Runabout Sport Electric
Duncana,b
Size of home town or city
N
Subset for alpha = 0.05
1
2
3
4
Under 10K
40
2.10
10K to 100K
190
3.00
100K to 500K
246
3.61
1 million and more
128
4.50
500K to 1 million
396
4.56
Sig.
1.000
1.000
1.000
.760
Means for groups in homogeneous subsets are displayed.
a. Uses Harmonic Mean Sample Size = 111.942.
b. The group sizes are unequal. The harmonic mean of the group sizes is used. Type I error
levels are not guaranteed.
Desirability: 2 Seat Runabout Sport Electric
Duncana,b
Age category
N
Subset for alpha = 0.05
1
2
3
4
18 to 24
20
1.55
65 and older
75
2.44
50 to 64
145
3.41
25 to 34
320
4.15
35 to 49
440
4.28
Sig.
1.000
1.000
1.000
.606
Means for groups in homogeneous subsets are displayed.
a. Uses Harmonic Mean Sample Size = 66.113.
b. The group sizes are unequal. The harmonic mean of the group sizes is used.
Type I error levels are not guaranteed.
Desirability: 2 Seat Runabout Sport Electric
Duncana,b
Level of education
N
Subset for alpha = 0.05
1
2
3
4
Less than high school
18
1.50
College degree
548
3.35
Post graduate degree
85
3.49
3.49
High School diploma
74
3.85
Some college
275
5.36
Sig.
1.000
.532
.116
1.000
Means for groups in homogeneous subsets are displayed.
a. Uses Harmonic Mean Sample Size = 57.941.
b. The group sizes are unequal. The harmonic mean of the group sizes is used. Type I
error levels are not guaranteed.
Desirability: 2 Seat Runabout Sport Electric
Duncana,b
Income category
N
Subset for alpha = 0.05
1
2
3
4
Under $25K
21
1.67
$125K and more
91
3.31
$75K to $125K
332
3.47
$50K to $74K
393
3.94
$25K to $49K
163
5.43
Sig.
1.000
.462
1.000
1.000
Means for groups in homogeneous subsets are displayed.
a. Uses Harmonic Mean Sample Size = 71.124.
b. The group sizes are unequal. The harmonic mean of the group sizes is used.
Type I error levels are not guaranteed.
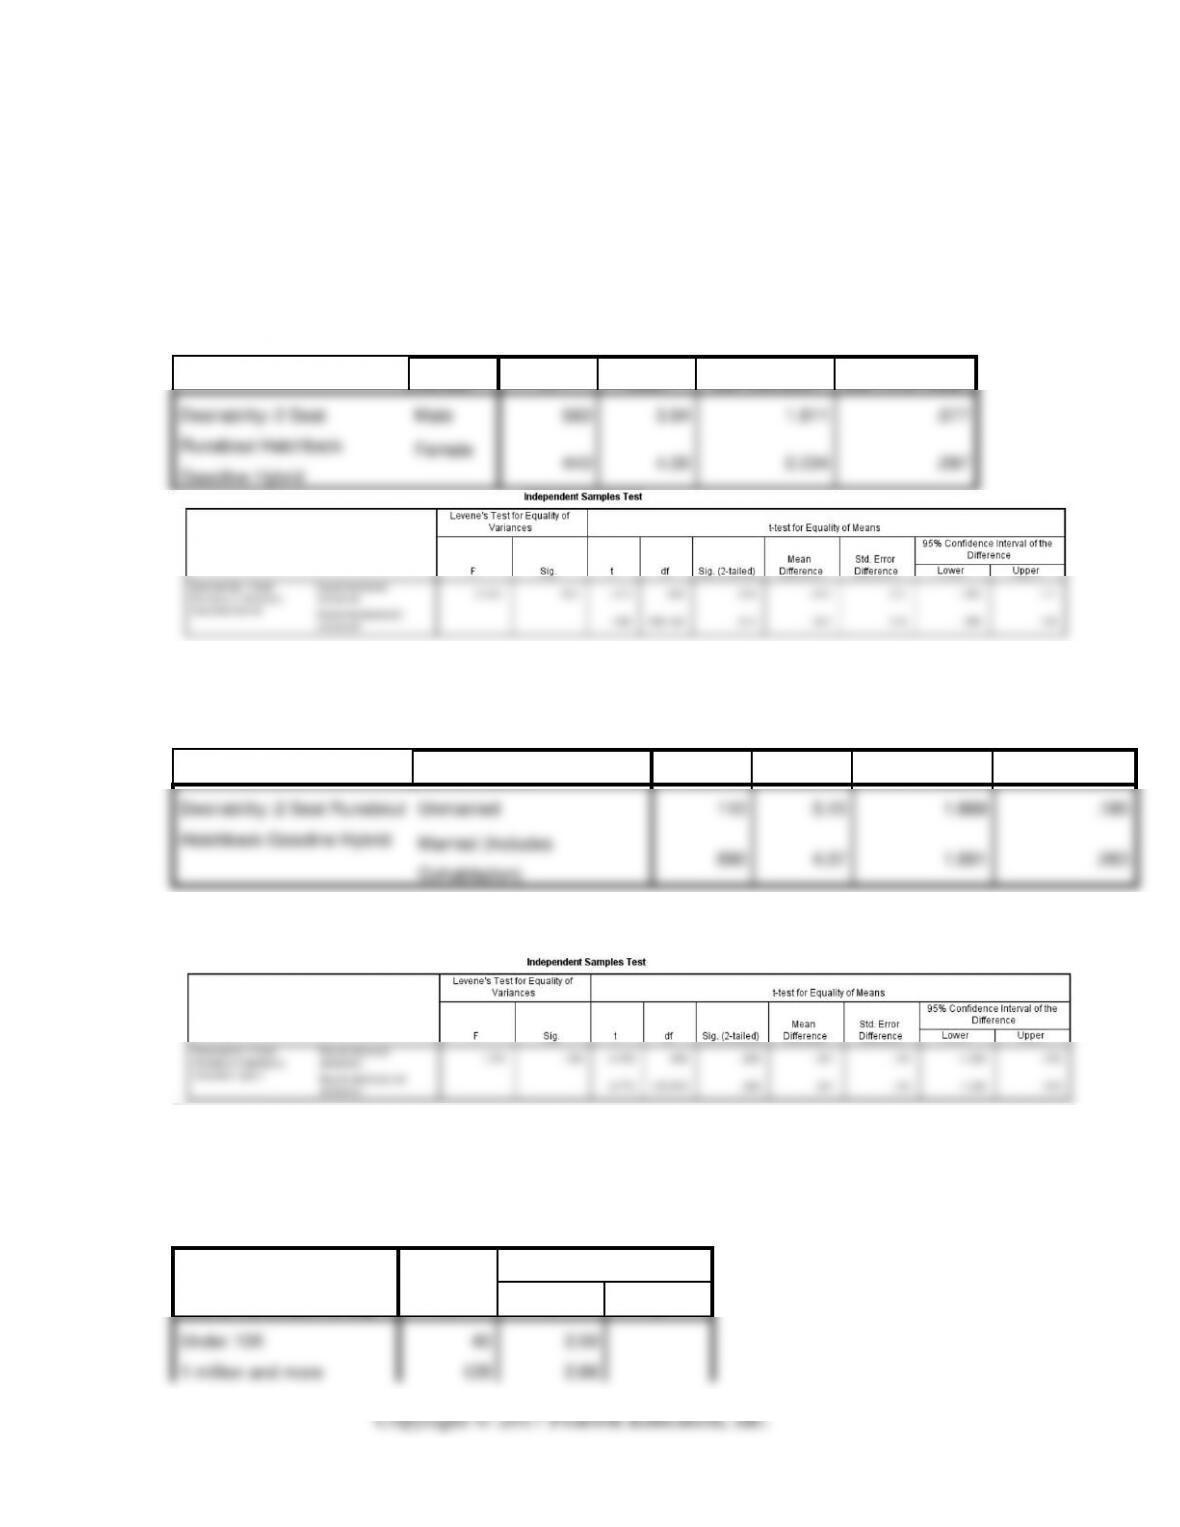
3. “Runabout Hatchback,” Two-Seat Gasoline Hybrid, mpg-e 50; runs on battery
for 50 miles and then switches to gas engine; estimated MSRP $35,000, range
250 miles.
Group Statistics
Gender
N
Mean
Std. Deviation
Std. Error Mean
Desirability: 2 Seat
Runabout Hatchback
Gasoline Hybrid
Male
560
3.94
1.811
.077
Female
440
4.00
2.034
.097
Group Statistics
Marital status
N
Mean
Std. Deviation
Std. Error Mean
Desirability: 2 Seat Runabout
Hatchback Gasoline Hybrid
Unmarried
110
3.15
1.888
.180
Married (Includes
Cohabitation)
890
4.07
1.891
.063
Desirability: 2 Seat Runabout Hatchback Gasoline Hybrid
Duncana,b
Size of home town or city
N
Subset for alpha = 0.05
1
2
Under 10K
40
2.50
1 million and more
128
2.66
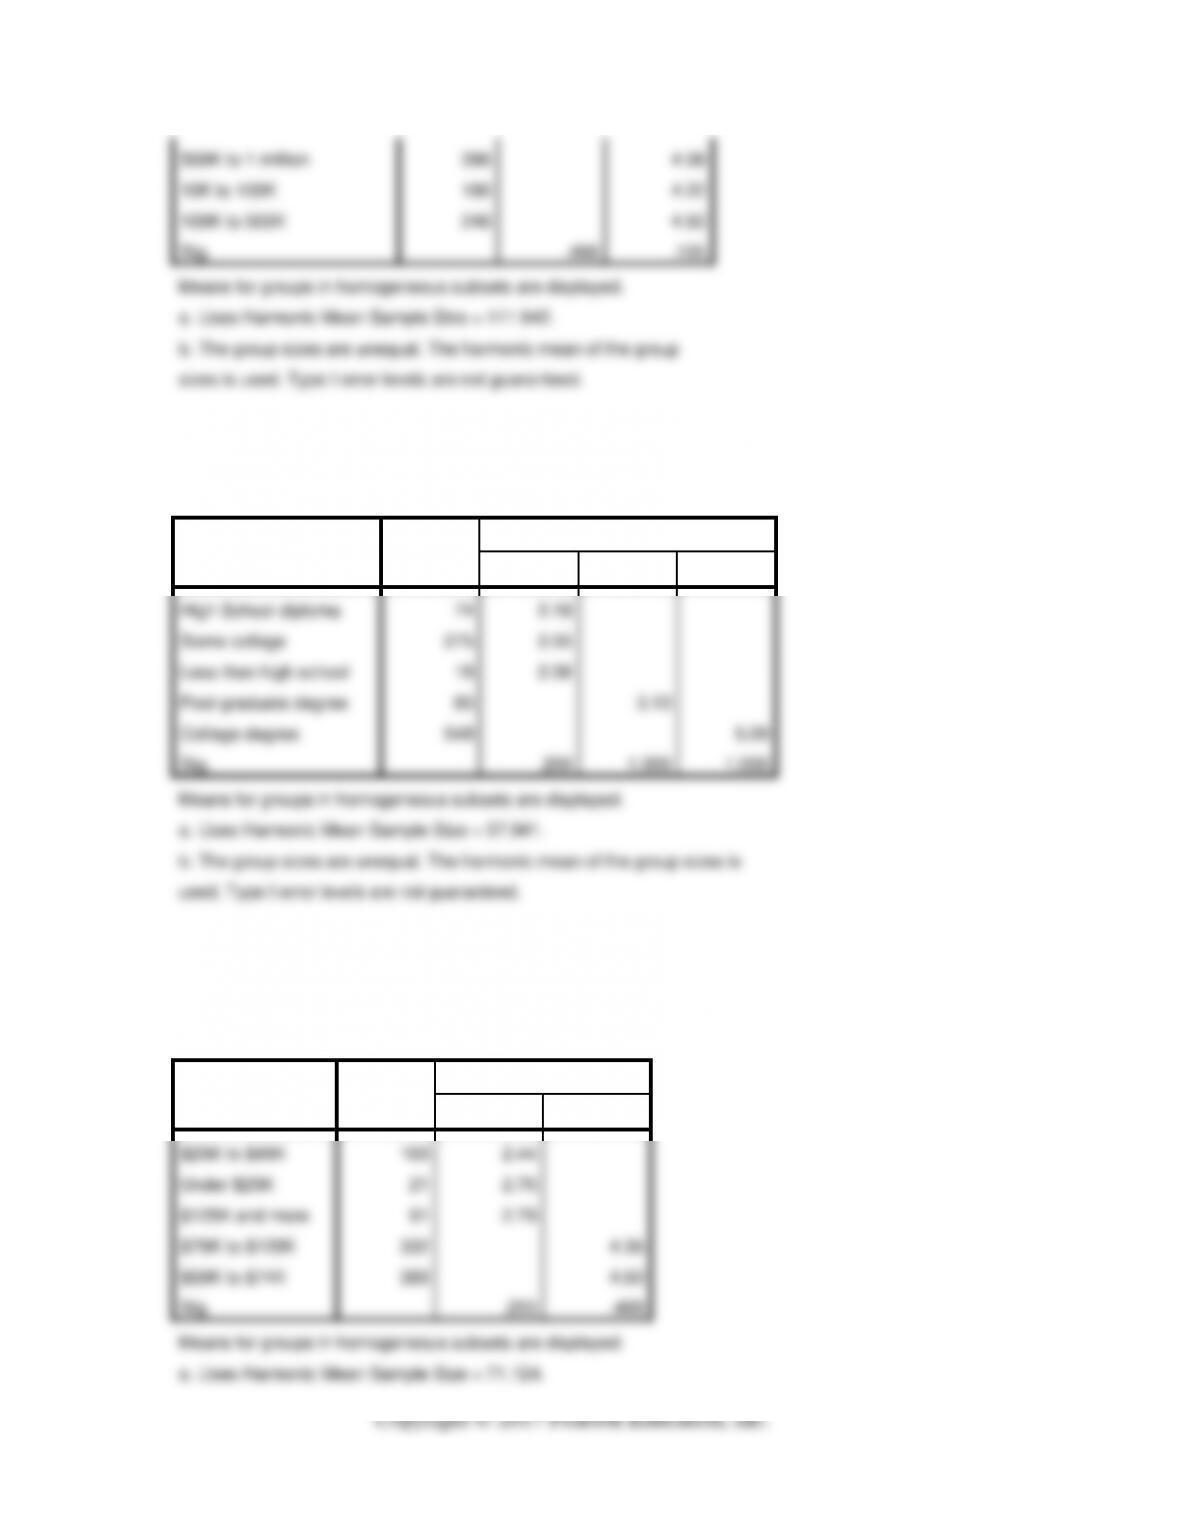
500K to 1 million
396
4.08
10K to 100K
190
4.22
100K to 500K
246
4.50
Sig.
.498
.105
Means for groups in homogeneous subsets are displayed.
a. Uses Harmonic Mean Sample Size = 111.942.
b. The group sizes are unequal. The harmonic mean of the group
sizes is used. Type I error levels are not guaranteed.
Desirability: 2 Seat Runabout Hatchback Gasoline Hybrid
Duncana,b
Level of education
N
Subset for alpha = 0.05
1
2
3
High School diploma
74
2.19
Some college
275
2.55
Less than high school
18
2.56
Post graduate degree
85
3.13
College degree
548
5.09
Sig.
.200
1.000
1.000
Means for groups in homogeneous subsets are displayed.
a. Uses Harmonic Mean Sample Size = 57.941.
b. The group sizes are unequal. The harmonic mean of the group sizes is
used. Type I error levels are not guaranteed.
Desirability: 2 Seat Runabout Hatchback Gasoline
Hybrid
Duncana,b
Income category
N
Subset for alpha = 0.05
1
2
$25K to $49K
163
2.44
Under $25K
21
2.76
$125K and more
91
2.79
$75K to $125K
332
4.36
$50K to $74K
393
4.60
Sig.
.253
.409
Means for groups in homogeneous subsets are displayed.
a. Uses Harmonic Mean Sample Size = 71.124.
b. The group sizes are unequal. The harmonic mean of the
group sizes is used. Type I error levels are not guaranteed.
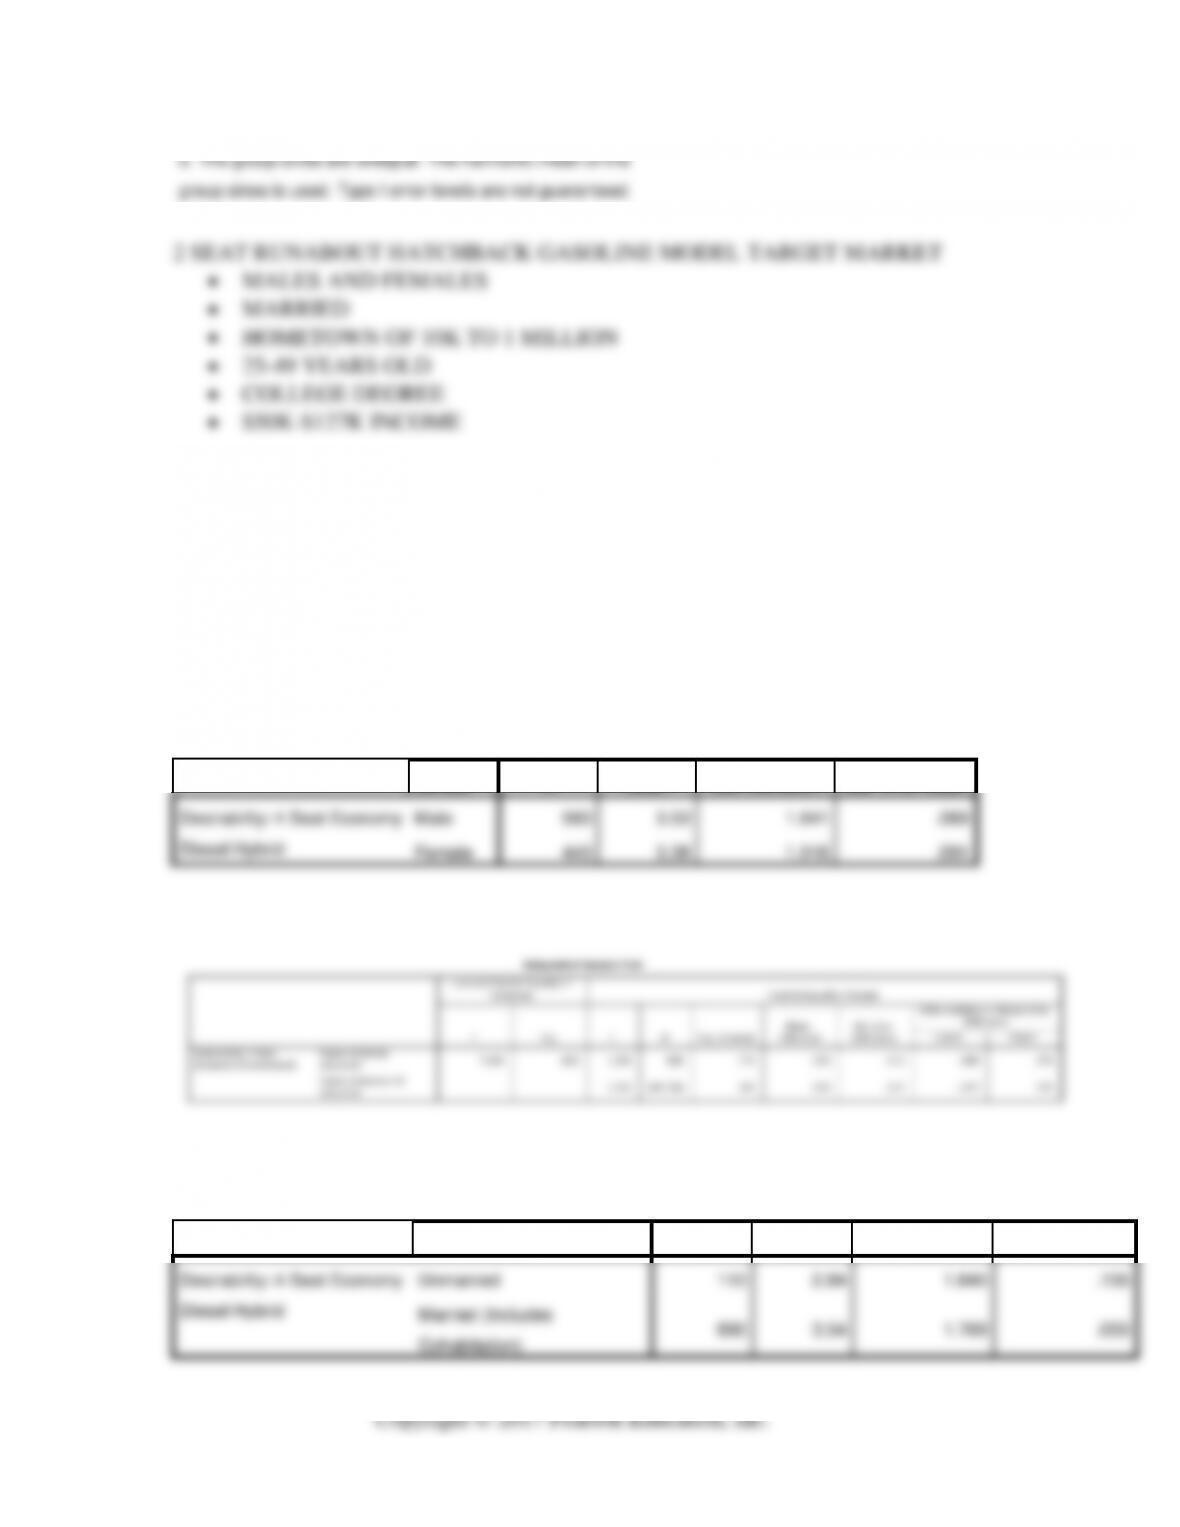
2 SEAT RUNABOUT HATCHBACK GASOLINE MODEL TARGET MARKET
• MALES AND FEMALES
• MARRIED
• HOMETOWN OF 10K TO 1 MILLION
• 25-49 YEARS OLD
• COLLEGE DEGREE
• $50K-$127K INCOME
4. “Economy Hybrid,” Four-Seat Diesel Hybrid, mpg-e 75; runs on battery for 75 miles
and then switches to efficient diesel engine; estimated MSRP $38,000, range 300
miles.
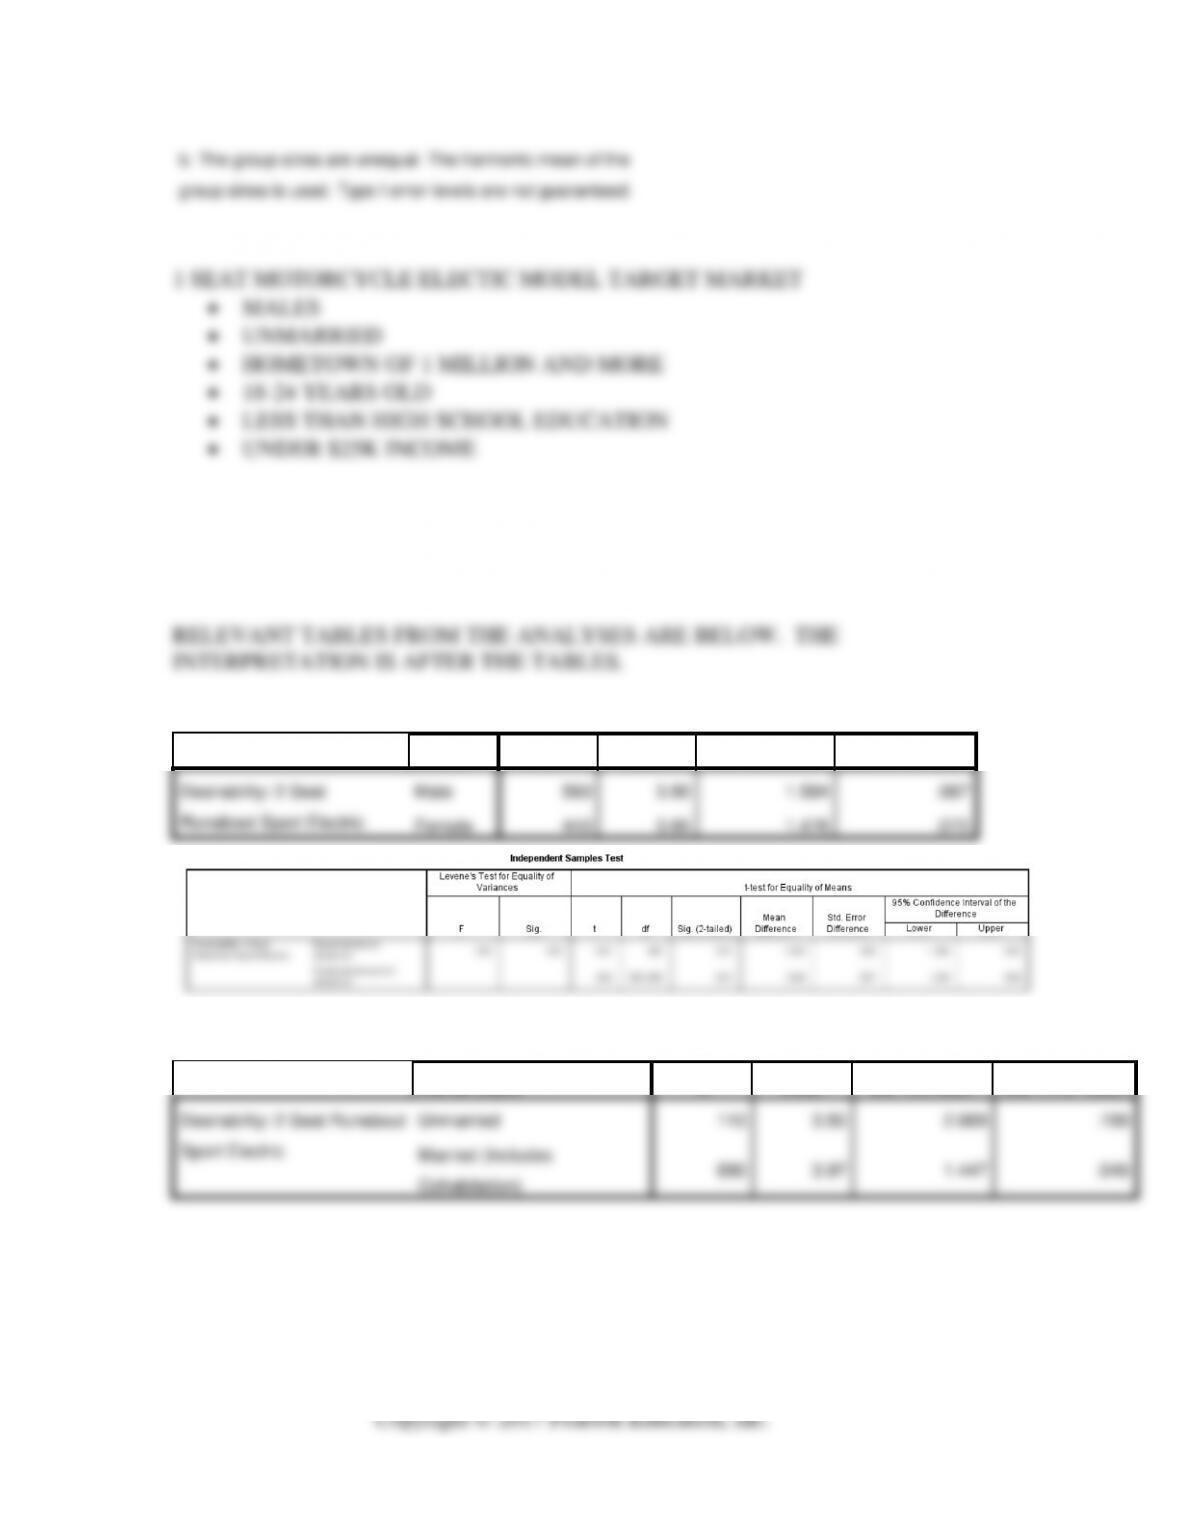
RELEVANT TABLES FROM THE ANALYSES ARE BELOW. THE
INTERPRETATION IS AFTER THE TABLES.
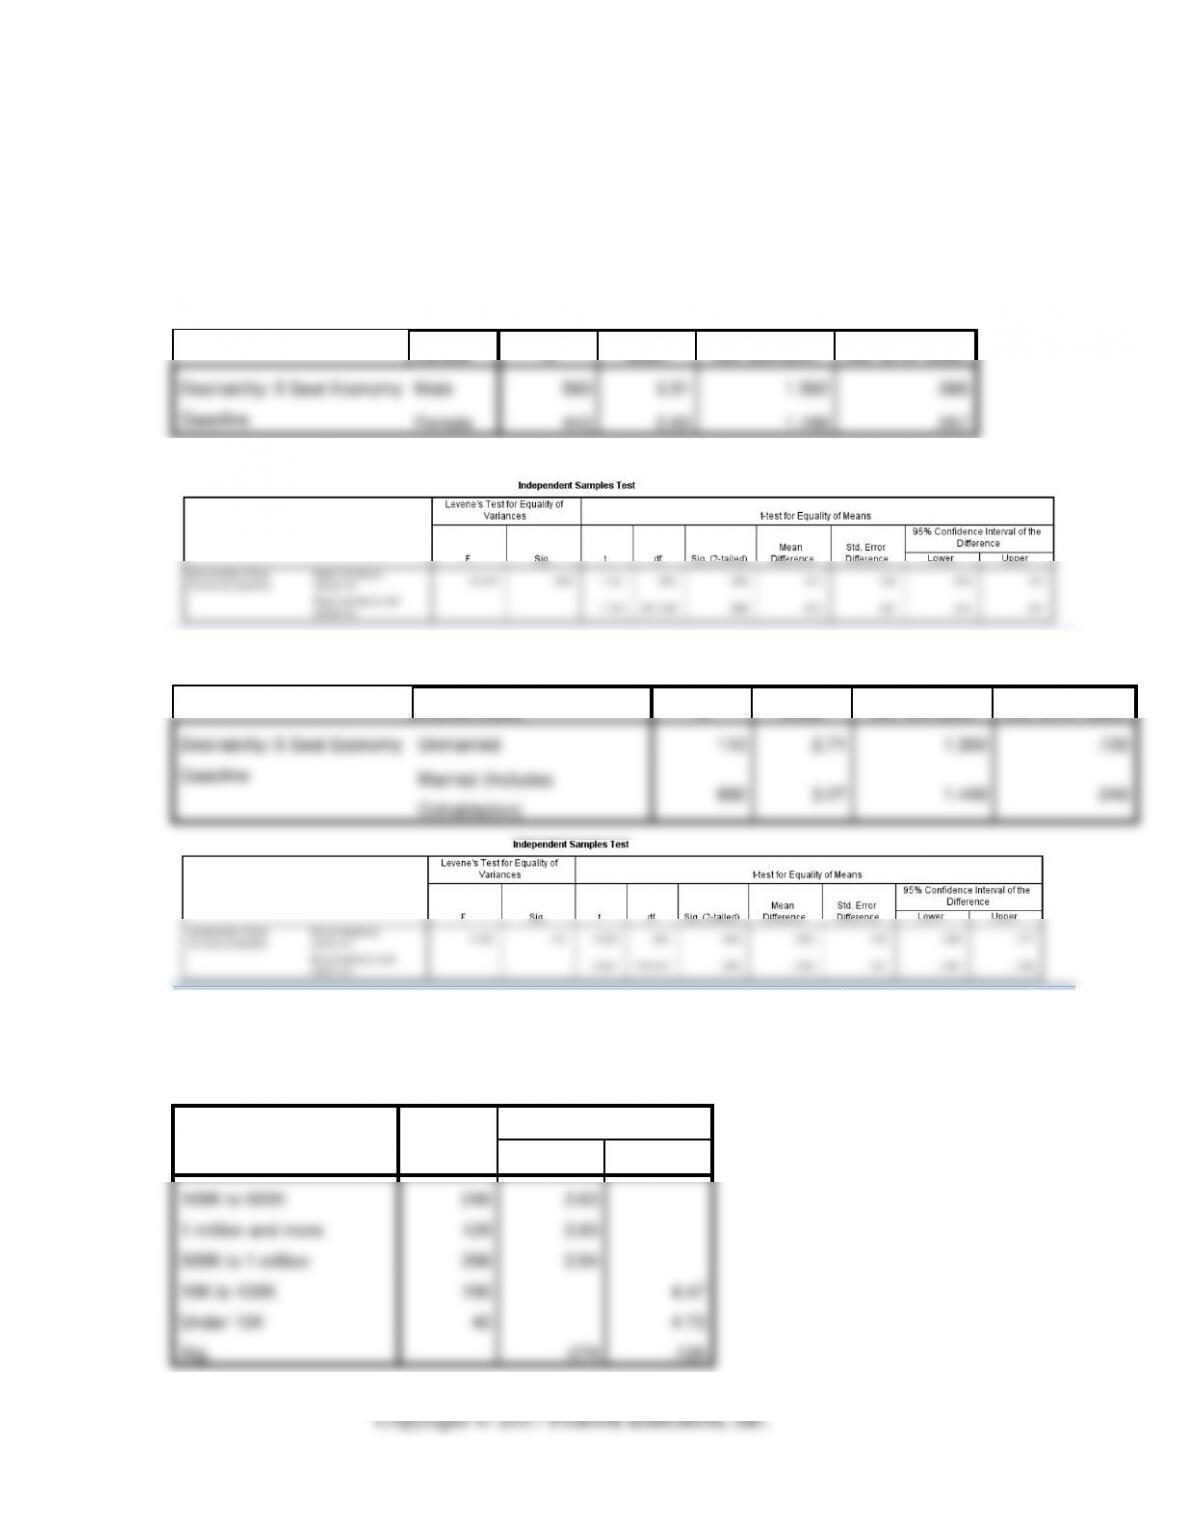
Group Statistics
Gender
N
Mean
Std. Deviation
Std. Error Mean
Desirability: 4 Seat Economy
Diesel Hybrid
Male
560
3.53
1.641
.069
Female
440
3.38
1.916
.091
Group Statistics
Marital status
N
Mean
Std. Deviation
Std. Error Mean
Desirability: 4 Seat Economy
Diesel Hybrid
Unmarried
110
2.84
1.640
.156
Married (Includes
Cohabitation)
890
3.54
1.769
.059
Desirability: 4 Seat Economy Diesel Hybrid
Duncana,b
Size of home town or city
N
Subset for alpha = 0.05
1
2
3
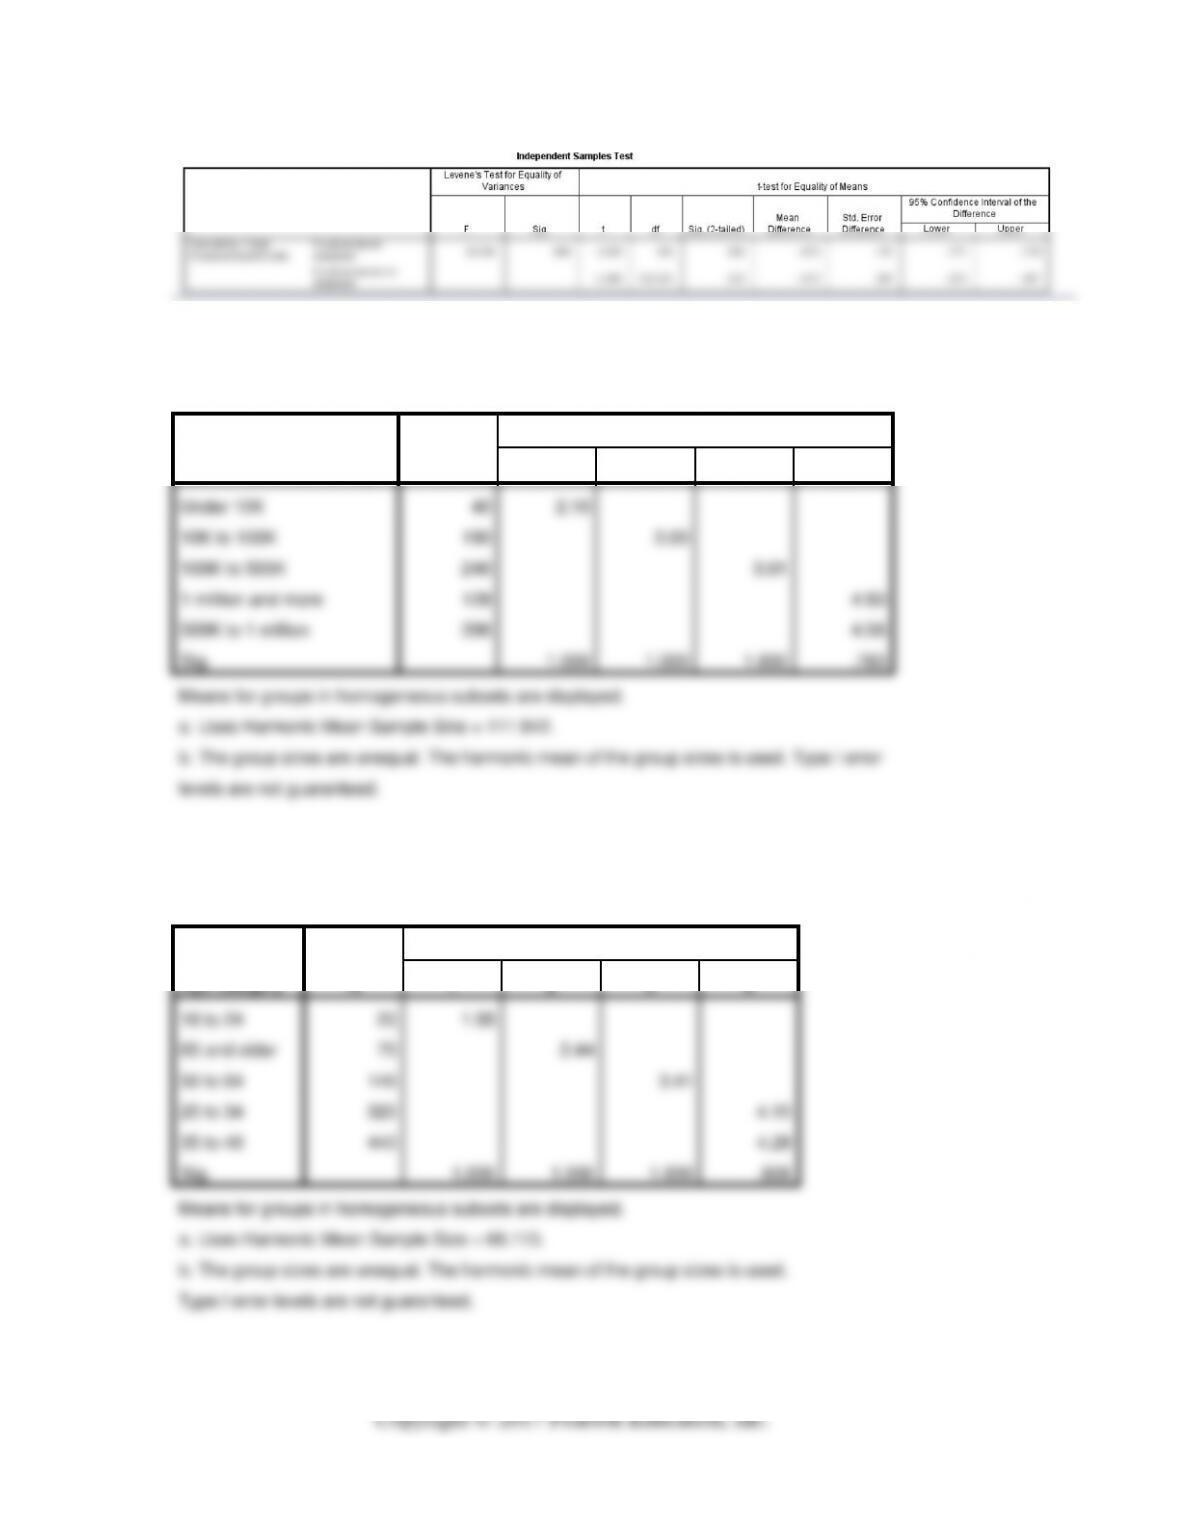
Under 10K
40
2.50
10K to 100K
190
2.89
500K to 1 million
396
3.40
1 million and more
128
3.78
3.78
100K to 500K
246
3.99
Sig.
.086
.101
.369
Means for groups in homogeneous subsets are displayed.
a. Uses Harmonic Mean Sample Size = 111.942.
b. The group sizes are unequal. The harmonic mean of the group sizes is
used. Type I error levels are not guaranteed.
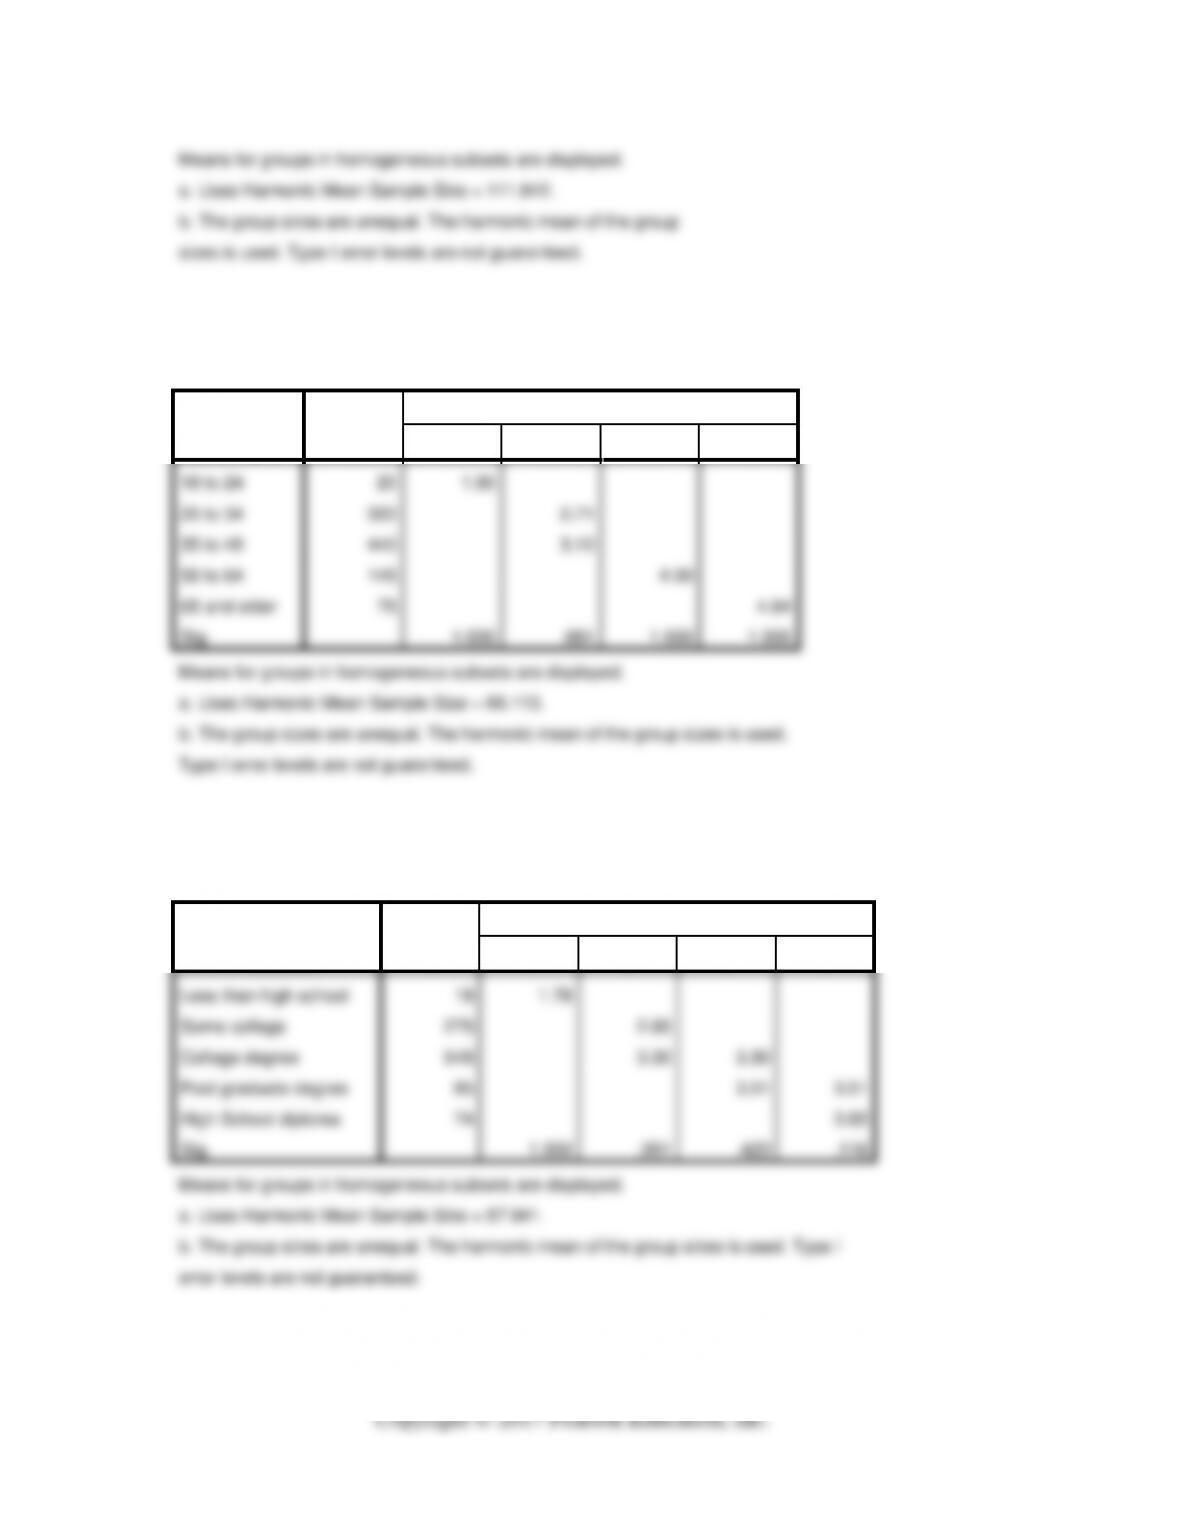
Desirability: 4 Seat Economy Diesel Hybrid
Duncana,b
Age category
N
Subset for alpha = 0.05
1
2
3
4
25 to 34
320
2.39
18 to 24
20
2.50
2.50
65 and older
75
3.00
35 to 49
440
3.81
50 to 64
145
5.14
Sig.
.685
.057
1.000
1.000
Means for groups in homogeneous subsets are displayed.
a. Uses Harmonic Mean Sample Size = 66.113.
b. The group sizes are unequal. The harmonic mean of the group sizes is used.
Type I error levels are not guaranteed.
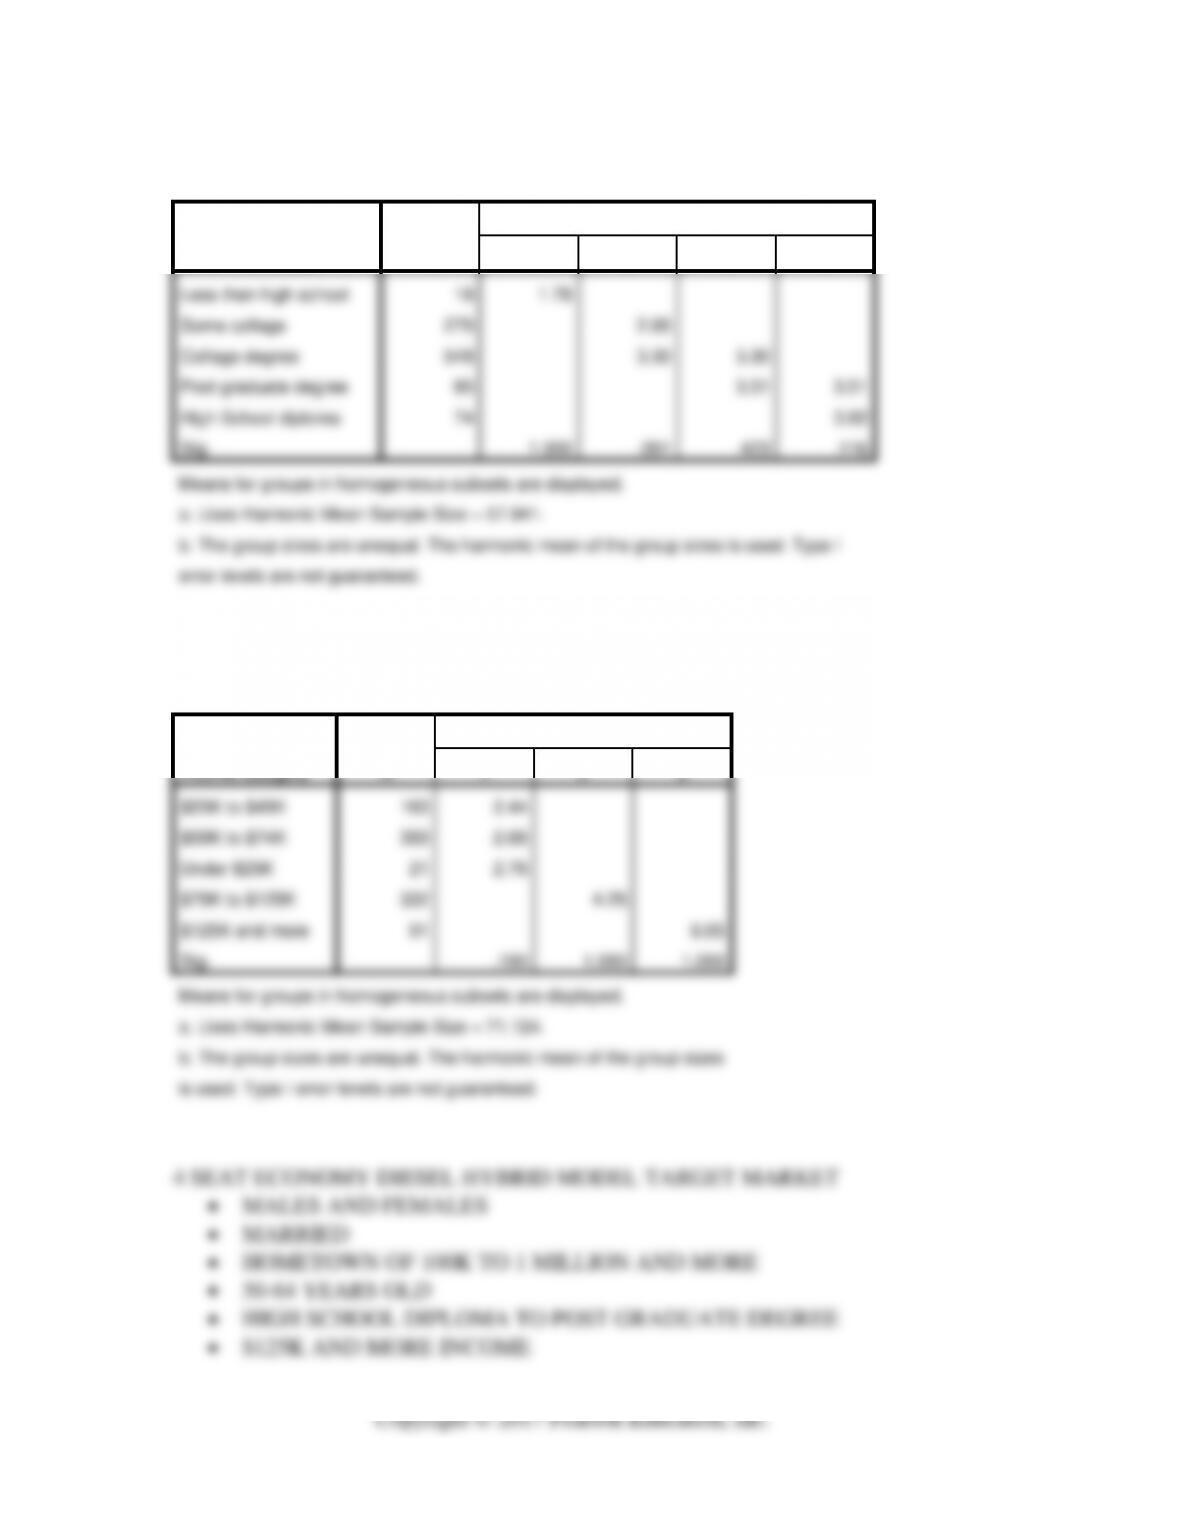
Desirability: 5 Seat Economy Gasoline
Duncana,b
Level of education
N
Subset for alpha = 0.05
1
2
3
4
Less than high school
18
1.78
Some college
275
2.85
College degree
548
3.30
3.30
Post graduate degree
85
3.51
3.51
High School diploma
74
3.92
Sig.
1.000
.091
.423
.116
Means for groups in homogeneous subsets are displayed.
a. Uses Harmonic Mean Sample Size = 57.941.
b. The group sizes are unequal. The harmonic mean of the group sizes is used. Type I
error levels are not guaranteed.
Desirability: 4 Seat Economy Diesel Hybrid
Duncana,b
Income category
N
Subset for alpha = 0.05
1
2
3
$25K to $49K
163
2.44
$50K to $74K
393
2.66
Under $25K
21
2.76
$75K to $125K
332
4.25
$125K and more
91
6.05
Sig.
.190
1.000
1.000
Means for groups in homogeneous subsets are displayed.
a. Uses Harmonic Mean Sample Size = 71.124.
b. The group sizes are unequal. The harmonic mean of the group sizes
is used. Type I error levels are not guaranteed.
5. “Economy Gasoline,” Five-Seat Economy Gasoline, mpg 36; runs on gasoline
with computer control for maximum efficiency, estimated MSRP $37,000, range
350 miles.
Group Statistics
Gender
N
Mean
Std. Deviation
Std. Error Mean
Desirability: 5 Seat Economy
Gasoline
Male
560
3.51
1.562
.066
Female
440
2.83
1.199
.057
Group Statistics
Marital status
N
Mean
Std. Deviation
Std. Error Mean
Desirability: 5 Seat Economy
Gasoline
Unmarried
110
2.71
1.390
.133
Married (Includes
Cohabitation)
890
3.27
1.449
.049
Desirability: 5 Seat Economy Gasoline
Duncana,b
Size of home town or city
N
Subset for alpha = 0.05
1
2
100K to 500K
246
2.63
1 million and more
128
2.83
500K to 1 million
396
2.94
10K to 100K
190
4.47
Under 10K
40
4.73
Sig.
.079
.128
Means for groups in homogeneous subsets are displayed.
a. Uses Harmonic Mean Sample Size = 111.942.
b. The group sizes are unequal. The harmonic mean of the group
sizes is used. Type I error levels are not guaranteed.
Desirability: 5 Seat Economy Gasoline
Duncana,b
Age category
N
Subset for alpha = 0.05
1
2
3
4
18 to 24
20
1.80
25 to 34
320
2.71
35 to 49
440
3.10
50 to 64
145
4.00
65 and older
75
4.84
Sig.
1.000
.081
1.000
1.000
Means for groups in homogeneous subsets are displayed.
a. Uses Harmonic Mean Sample Size = 66.113.
b. The group sizes are unequal. The harmonic mean of the group sizes is used.
Type I error levels are not guaranteed.
Desirability: 5 Seat Economy Gasoline
Duncana,b
Level of education
N
Subset for alpha = 0.05
1
2
3
4
Less than high school
18
1.78
Some college
275
2.85
College degree
548
3.30
3.30
Post graduate degree
85
3.51
3.51
High School diploma
74
3.92
Sig.
1.000
.091
.423
.116
Means for groups in homogeneous subsets are displayed.
a. Uses Harmonic Mean Sample Size = 57.941.
b. The group sizes are unequal. The harmonic mean of the group sizes is used. Type I
error levels are not guaranteed.
Desirability: 5 Seat Economy Gasoline
Duncana,b
Income category
N
Subset for alpha = 0.05
1
2
3
Under $25K
21
2.24
$25K to $49K
163
3.01
$75K to $125K
332
3.16
3.16
$50K to $74K
393
3.28
3.28
$125K and more
91
3.65
Sig.
1.000
.290
.055
Means for groups in homogeneous subsets are displayed.
a. Uses Harmonic Mean Sample Size = 71.124.
b. The group sizes are unequal. The harmonic mean of the group sizes
is used. Type I error levels are not guaranteed.