CHAPTER 10
DETERMINING THE SIZE OF A SAMPLE
LEARNING OBJECTIVES
In this chapter you will learn:
10-1 Several axioms about sample size
10-2 What is means to compute sample size using the confidence interval
10-3 How to compute sample size using the sample size formula
10-4 Practical considerations in sample size determination
10-5 Other methods of sample size determination and reasons why most of them are
undesirable
10-6 Three sample size determination special situations: sampling small populations,
using nonprobability samples methods, and using a panel company
CHAPTER OUTLINE
Sample Size Axioms
The Confidence Interval Method of Determining Sample Size
• Sample Size and Accuracy
• p and q : The Concept of Variability
• The Concept of a Confidence Interval
• How Population Size (N) Affects Sample Size
The Sample Size Formula
• Determining Sample Size via the Confidence Interval Formula
o Variability: p x q
o Acceptable margin of sample error: e
o Level of confidence: z
Practical Considerations in Sample Size Determination
• How to Estimate Variability in the Population
• How to Determine the Amount of Acceptable Sample Error
• How to Decide on the Level of Confidence
• How to Balance Sample Size with the Cost of Data Collection

Other Methods of Sample Size Determination
• Arbitrary “Percent Rule of Thumb” Sample Size
• Conventional Sample Size Specification
• Statistical Analysis Requirements Sample Size Specification
• Cost Basis of Sample Size Specification
Three Special Sample Size Determination Situations
• Sampling from Small Populations
• Sample Size Using Nonprobability Sampling
• Sampling From Panels
KEY TERMS
Sample accuracy Large sample size bias
Confidence interval approach Nonsampling error
Margin of sampling error Variability
Minimum margin of sample error Confidence interval
Central limit theorem Confidence Interval Method
Acceptable margin of sample error Worst-case variability
Arbitrary approach Conventional approach
Statistical analysis approach “All-you-can-afford” approach
Small population Finite multiplier
TEACHING SUGGESTIONS
1. The eight axioms is an attempt to take some of the complexity out of sample size
determination and to make the material easier for students to understand. The axioms
2. The percentage rule of thumb method for determining sample size can be shown to be
senseless in the case of small population sizes. Business marketing situations often
3. The claim that national opinion polls tend to be around 1,000-1,200 in sample size
can be easily verified. Have students do background research on opinion polls
(perhaps there is a political campaign underway) and bring to class their findings on
sample size and reported error.
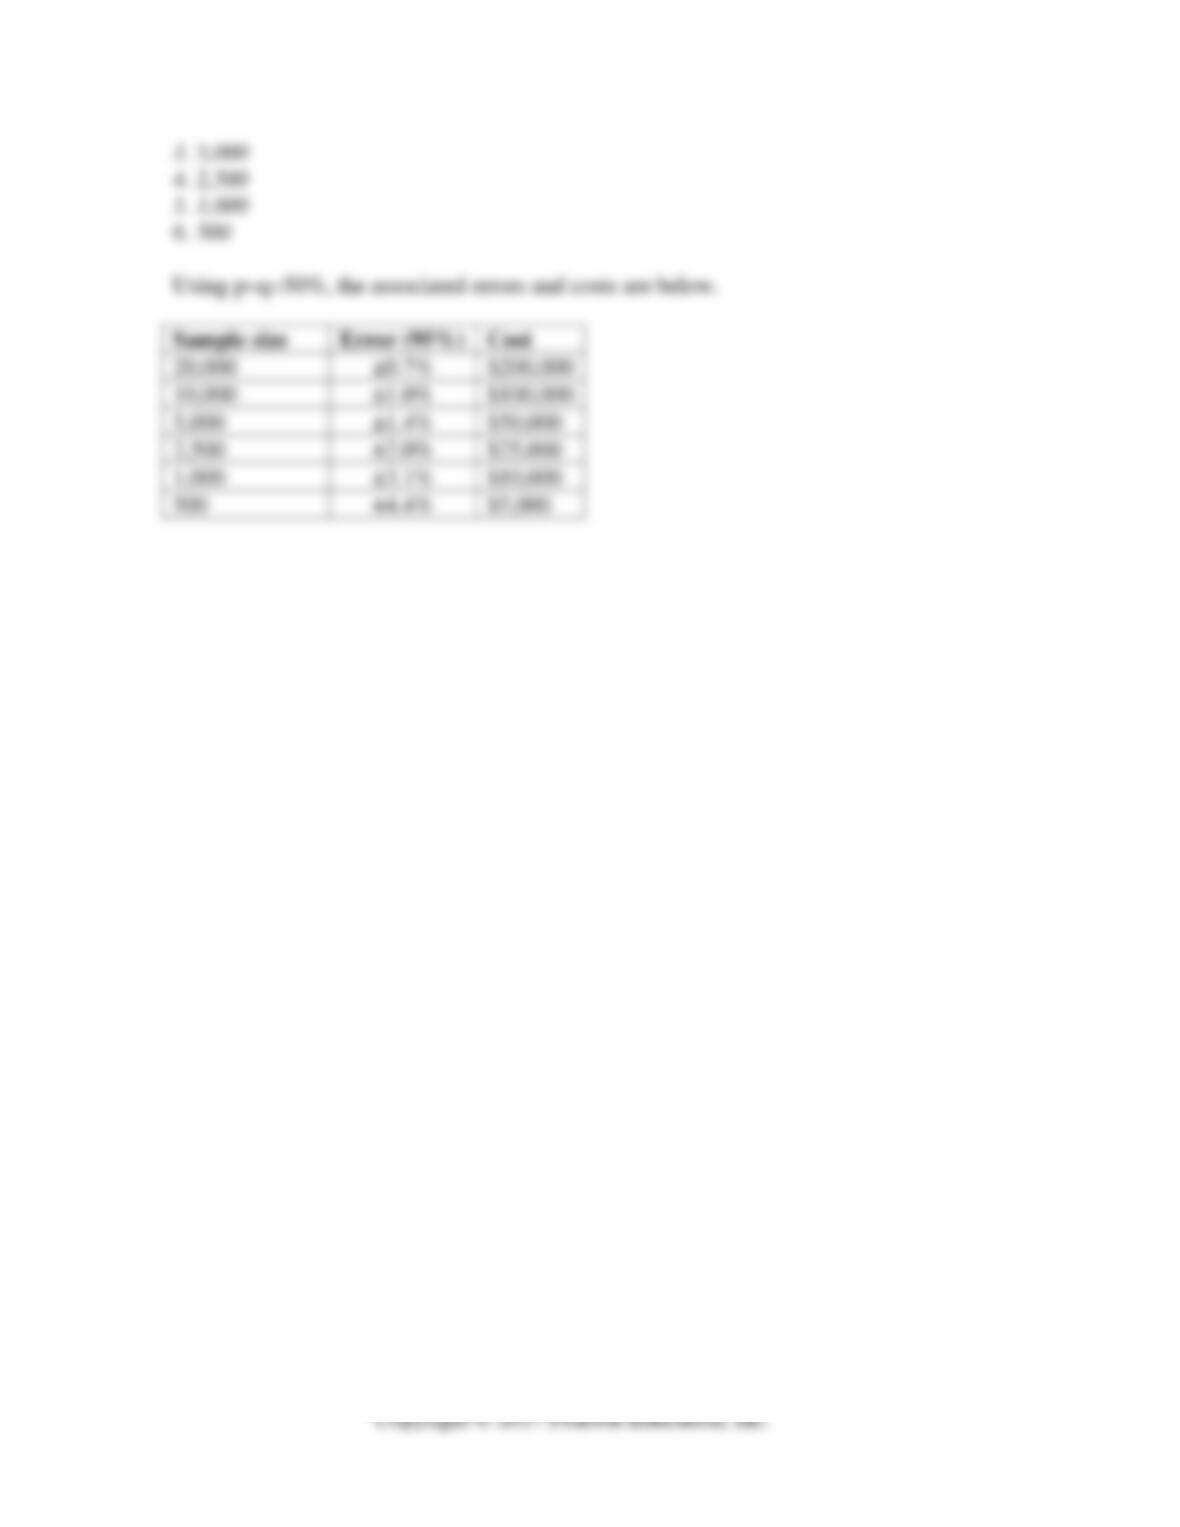
4. Figure 10.1 illustrates visually how large sample sizes fail to add to the accuracy of a
survey. Because the graph is difficult to read with precision, consider using the
following table to illustrate to students how little additional accuracy is gained with
increases in the sample size, especially with large samples.
Sample
Size
95%
Accuracy
Accuracy
Increase
100
9.8%
–
250
6.2%
3.6%
500
4.4%
1.8%
750
3.6%
0.8%
1000
3.1%
0.5%
1250
2.8%
0.3%
1500
2.5%
0.3%
1750
2.3%
0.2%
2000
2.2%
0.1%
5. The confidence interval approach to sample size involves several statistical concepts.
Although they are described in the chapter, it is necessary to review them thoroughly
6. Students do not easily grasp the concept of a sampling distribution. If you have a
class of, say, 30 students, you can pair them up and simulate 15 different samples.
Have each pair give its average age (other variables might be: hours carried this term,
hours worked per week, minutes to commute to campus), and plot all of the sample
means in a distribution. If you select a variable where students are quite similar (e.g.,
age), the sampling distribution will be quite compact, but if you use a variable where
students are dissimilar (e.g., distance of hometown away from campus), the sampling
distribution will be much less compact.
7. It is recommended to teach the percentage sample size formula before the mean
sample size formula, and we have placed the formula for a mean in a Marketing
8. Use the 95% level of confidence in the sample size determination examples. The 1.96
z value is about 2, and students have an easier time following the squaring
computations than they do with the 2.58 z value for the 99% level of confidence.
9. If students are literate in a spreadsheet program such as Microsoft Excel, they can be
asked to make a sample size calculator. The calculator should allow the user to input
the variability (p) and the allowable error (e) whereupon the calculator should
calculate the sample size at 95% level of confidence. Ambitious students can add a
99% level of confidence calculation. If students want to check their work, they can
do a simple Internet search and find a sample size calculator easily.
10. Although the topic is relegated to the end of the chapter, sample sizes for
nonprobability samples are determined primarily by cost factors. The sample size
determination formulas assume that a random sampling method will be applied to
draw the sample after its size has been calculated. If a nonprobability sample is to be
drawn, there is no justification for computing the sample size with the formula
(except for comparison purposes).
ACTIVE LEARNING EXERCISES
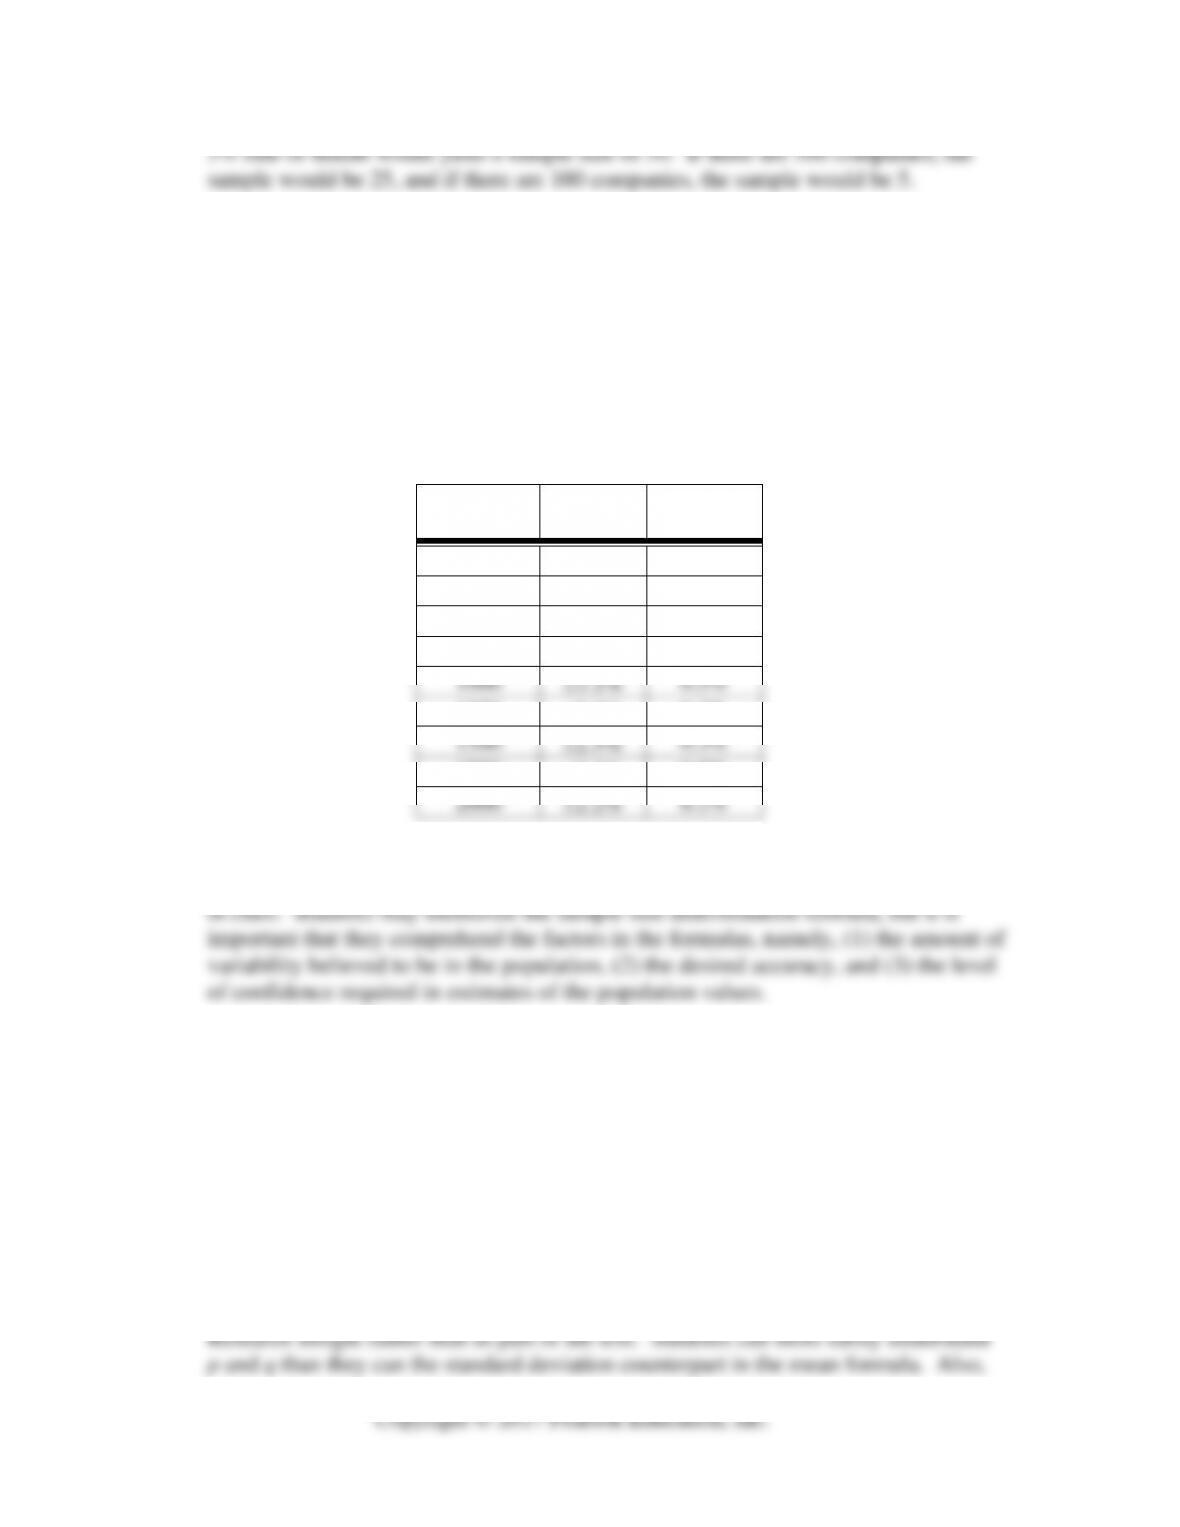
How Does the Level of Confidence Affect the Sample Accuracy Curve?
This exercise requires students to calculate the sample error for 99% level of confidence
at sample sizes of 100, 500, 1000, and 200 and to compare the curve to the curve in
Figure 10.1.
The sample errors and curves are below.
0%
2%
4%
6%
8%
10%
12%
14%
100 500 1000 2000
99%
95%
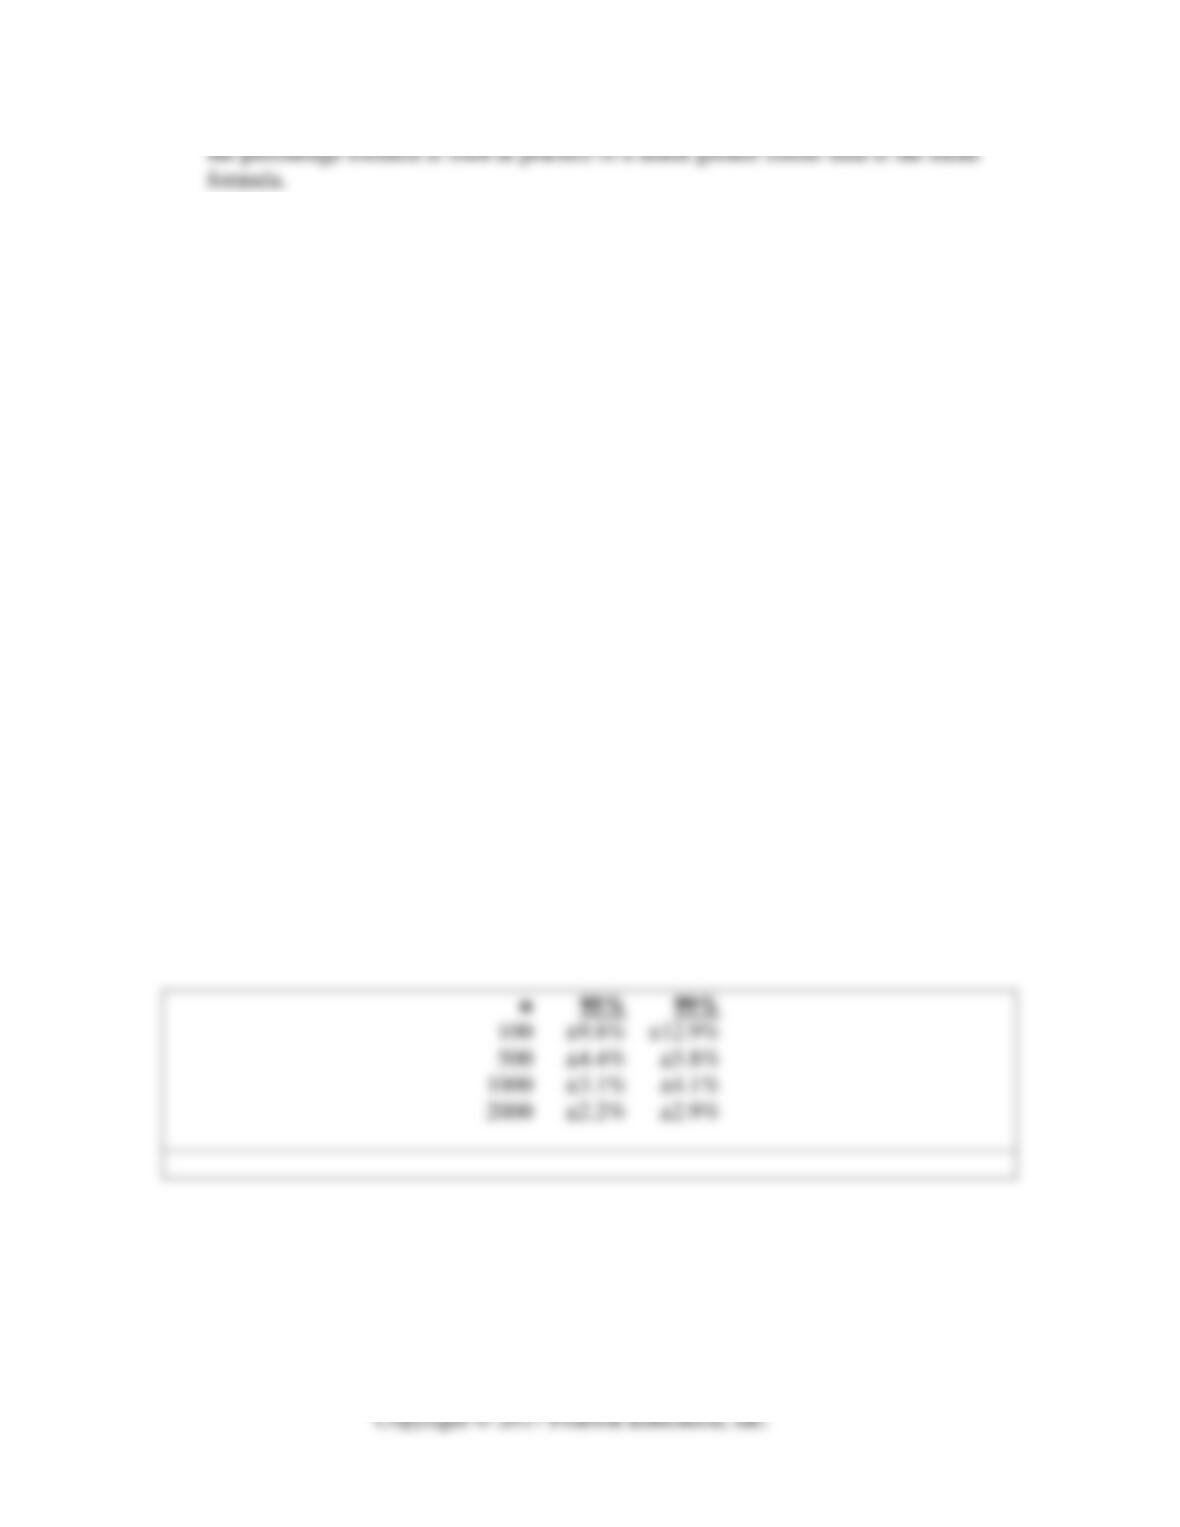
Write down 2 things you can conclude about the effect of a level of confidence different
from 95% on the amount of sample error with samples in the range of the horizontal axis
in Figure 10.3.
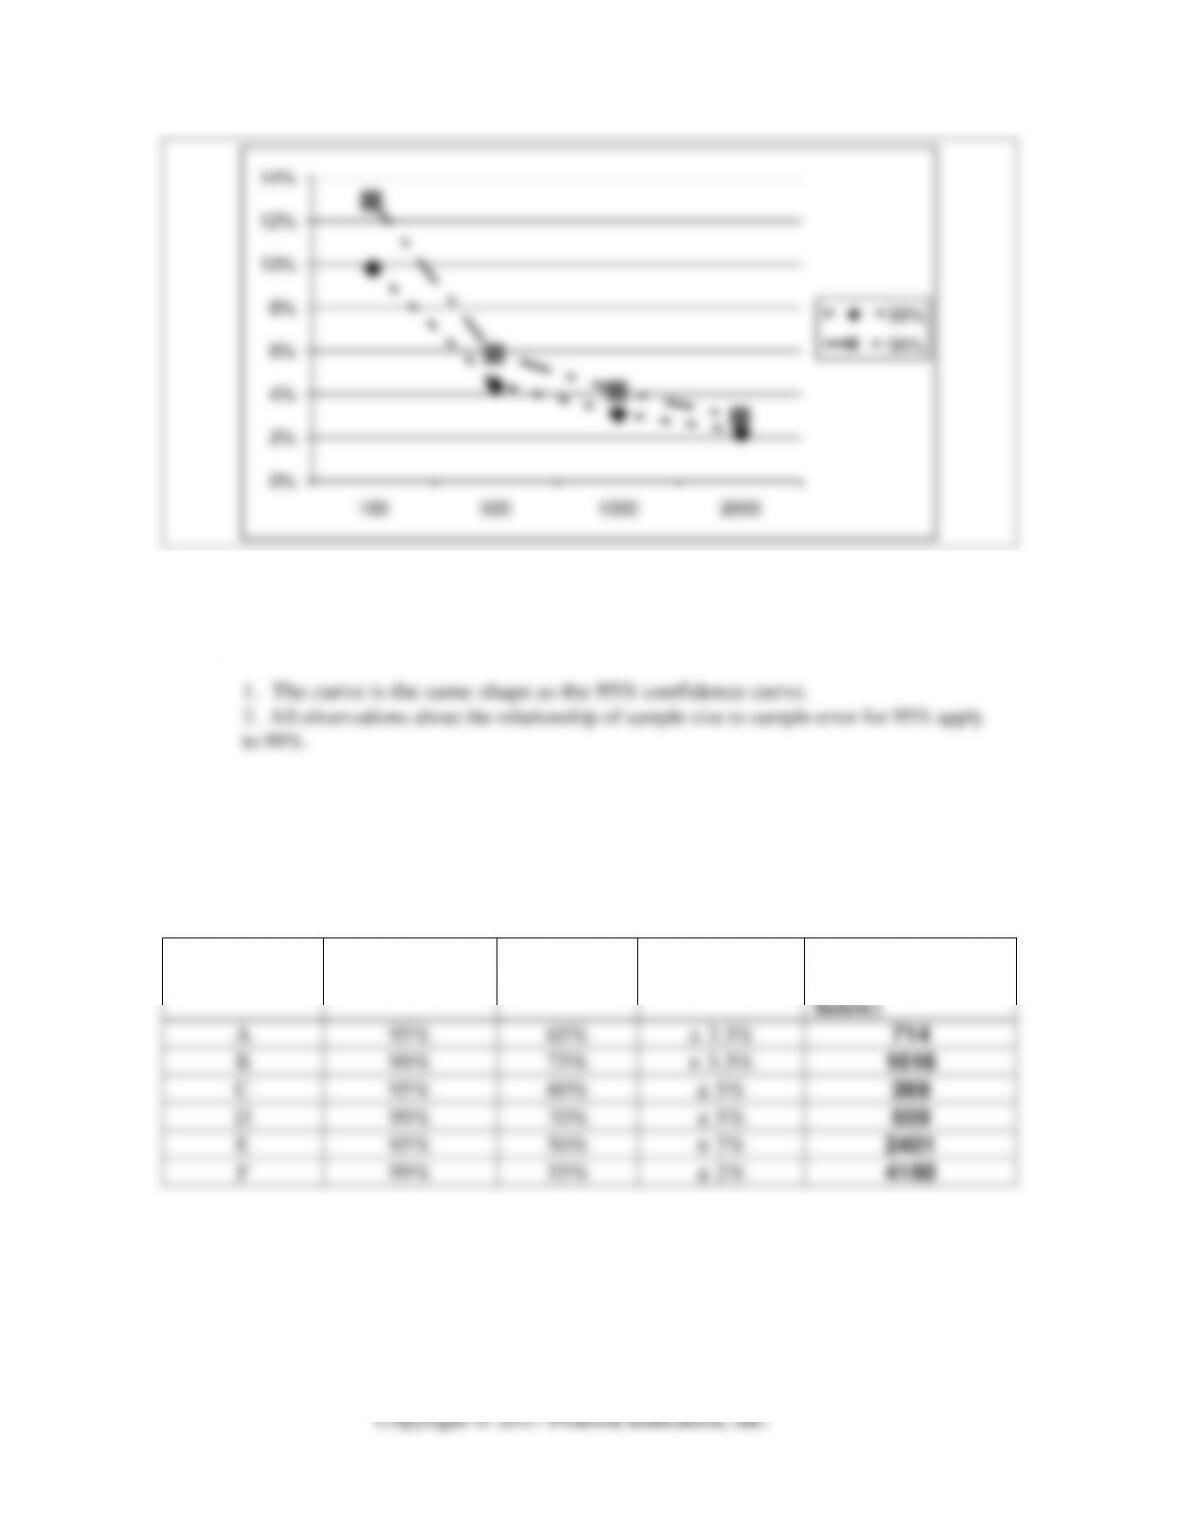
Sample Size Calculations Practice
This exercise requires students to calculate sample size using the standard formula at
either the 95% or 99% level of confidence with different values of p and e. The
(truncated) answers are in the table below.
Case
Confidence
level
Value of p
Allowable
Error
Sample size (enter
your answer
below)
A
95%
65%
± 3.5%
714
B
99%
75%
± 3.5%
1016
C
95%
60%
± 5%
369
D
99%
70%
± 5%
559
E
95%
50%
± 2%
2401
F
99%
55%
± 2%
4160
SYNTHESIZE YOUR LEARNING
Niagara Falls Tourism Association
This learning synthesis exercise requires students to assess sample size and sample
selection issues together.
1. What is the sample frame in each bid?
2. Identify the type of sample method and assess the representativeness of the sample
with respect to American tourists visiting the Niagara Falls area.
3. Evaluate the accuracy (sample error) with each bid.
4. The Niagara Falls Tourism Association has budgeted $5,000 for data collection in this
survey. Using information from your answers to Questions 1–3, and further considering
the total cost of data collection, which one of the proposals do you recommend that the
Niagara Falls Tourist Association accept? Justify your recommendation
ANSWERS TO END-OF-CHAPTER QUESTIONS
1. Describe each of the following methods of sample size determination and indicate a
critical flaw in the use of each one.
The descriptions and critical flaws follow.
2. Describe and provide illustrations of each of the following concepts:
The descriptions and illustrations are listed below.
a. Variability
3. What are the three fundamental considerations involved with the confidence interval
approach to sample size determination?
In order to calculate the proper sample size for a survey, only three factors need be
4. When calculating sample size, how can a researcher decide on the level of accuracy
to use? What about level of confidence? What about variability with a percentage?
The accuracy or precision level is discussed with the decision-maker, and it is
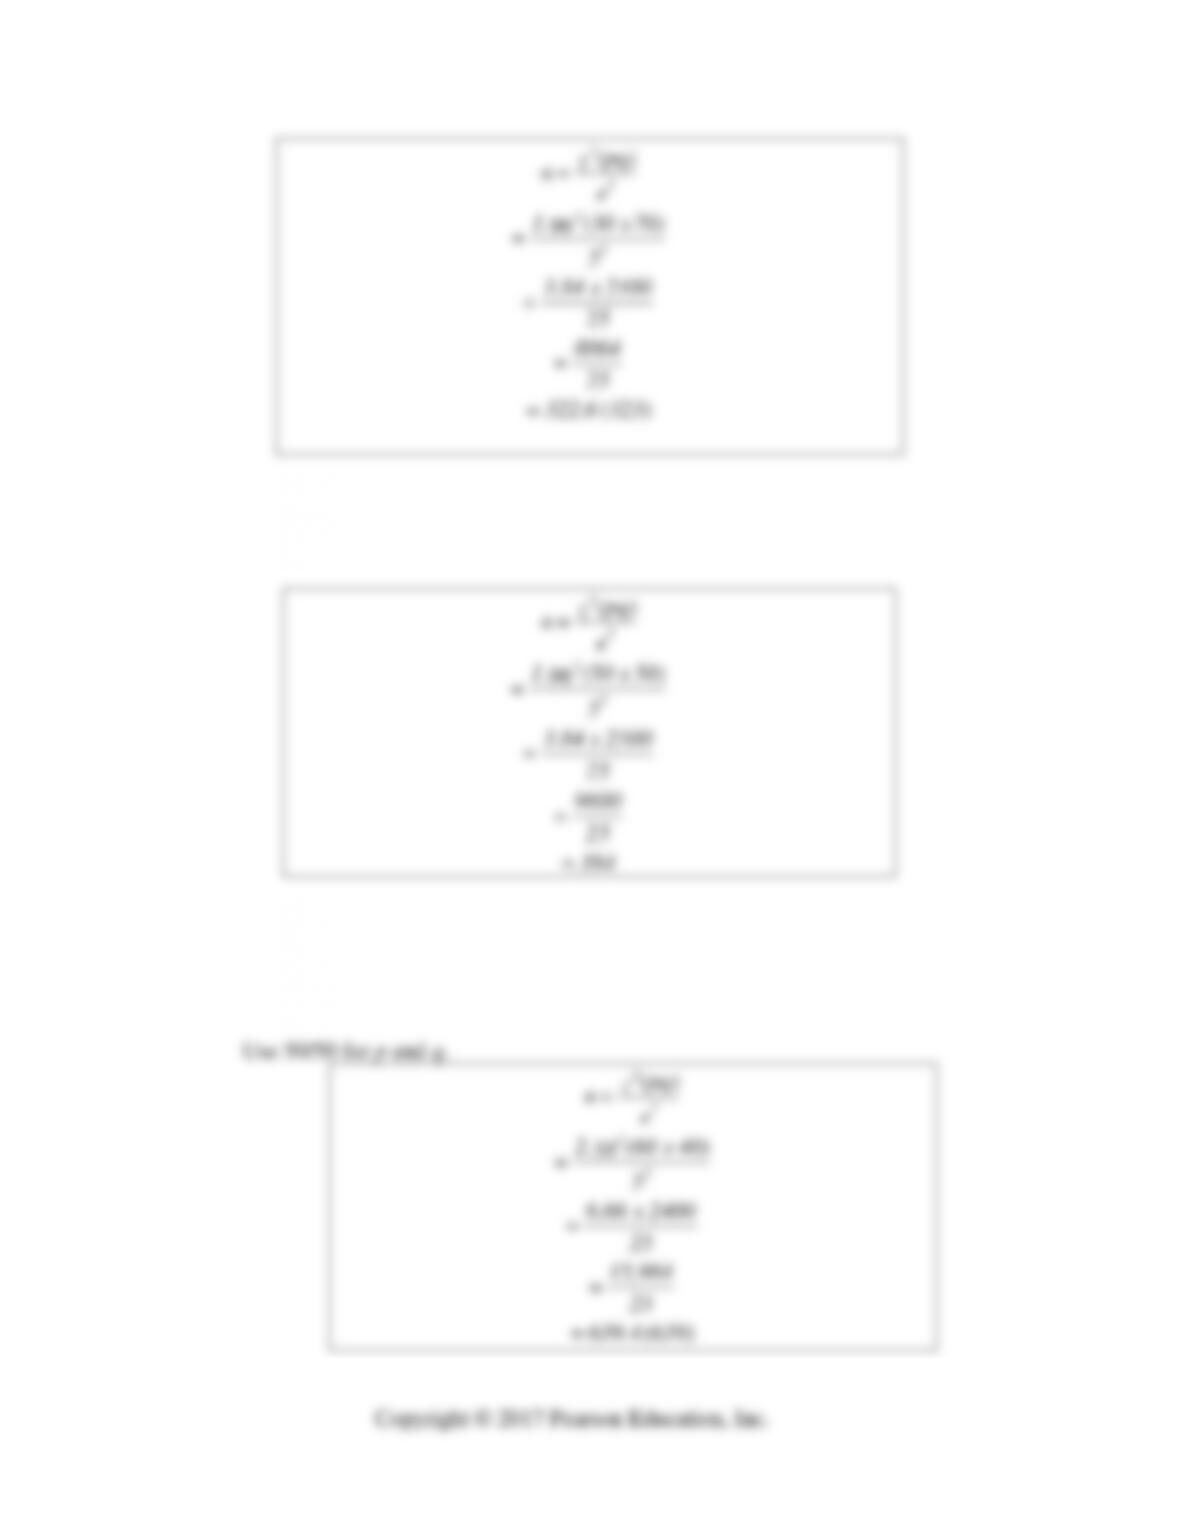
5. Using the formulas provided in your text, determine the approximate sample sizes for
each of the following cases, all with precision (allowable error) of ±5%:
(323) 322.6 = 25
8064
=
25
2100 x 3.84
=
5
70) x (30
96
1.
=
e
(pq)
z
= n
2
2
2
2
b. Variability of 60%, confidence level of 99%
6. Indicate how a pilot study can help a researcher understand variability in the
population.
7. Why is it important for the researcher and the marketing manager to discuss the
accuracy level associated with the research project at hand?
8. What are the benefits to be gained by knowing that a proposed sample is more than
5% of the total population’s size? In what marketing situation might this be a
common occurrence?
9. A researcher knows from experience the average costs of various data collection
alternatives:
If $2,500 is allocated in the research budget for data collection, what are the levels of
accuracy for the sample sizes allowable for each data collection method? Based on
10. Last year, Lipton Tea Company conducted a mall-intercept study at six regional
malls around the country and found that 20% of the public preferred tea over coffee
as a midafternoon hot drink. This year, Lipton wants to have a nationwide telephone
survey performed with random digit dialing. What sample size should be used in this
year’s study in order to achieve an accuracy level of ± 2.5% at the 99% level of
confidence? What about at the 95% level of confidence?
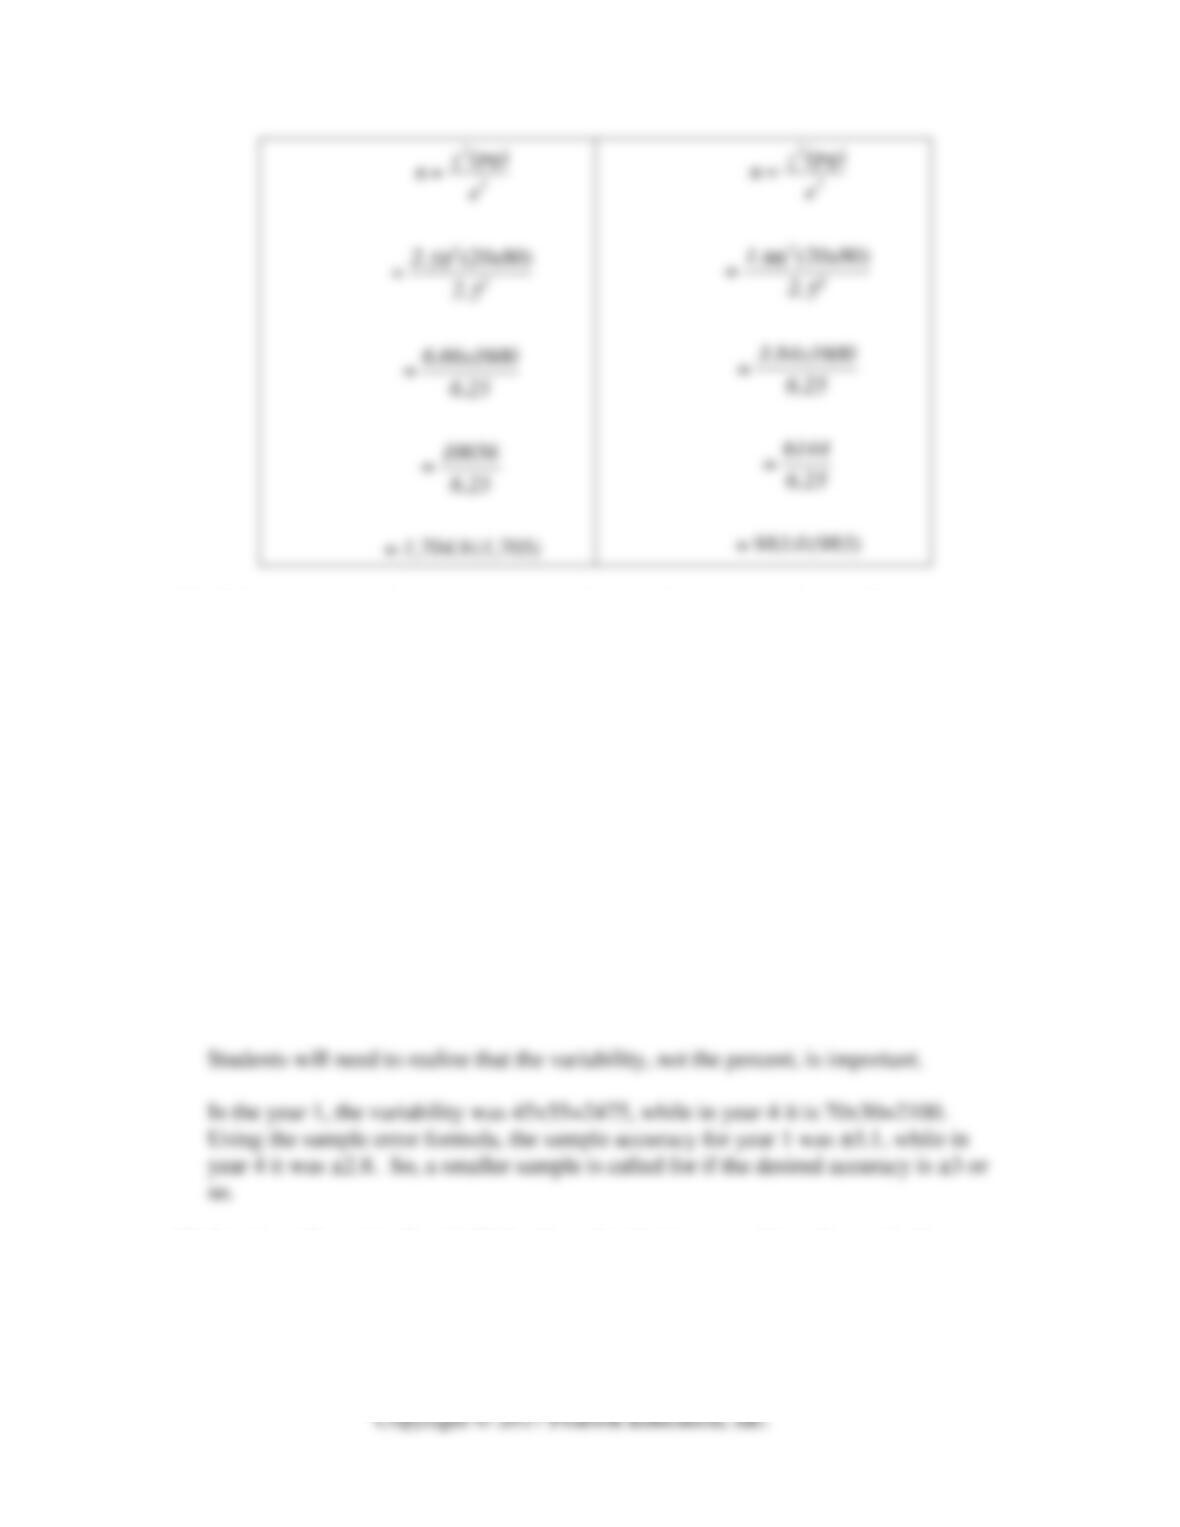
(1,705) 1,704.9=
6.25
10656
=
6.25
6.66×1600
=
5
2.
(20×80)
58
2.
=
e
(pq)
z
= n
2
2
2
2
(983) 983.0 =
6.25
6144
=
6.25
3.84×1600
=
5
2.
(20×80)
96
1.
=
e
(pq)
z
= n
2
2
2
2
11. Allbookstores.com has a used textbook division. It buys its books in bulk from used
book buyers who set up kiosks on college campuses during final exams, and it sells
the used textbooks to students who log on to the allbookstores.com web site via a
secured credit card transaction. The used texts are then sent by United Parcel
Service to the student.
The company has conducted a survey of used book buying by college students each
year for the past four years. In each survey, 1,000 randomly selected college students
have been asked to indicate whether or not they bought a used textbook in the
previous year. The results are as follows:
Years Ago
1 2 3 4
Percentage buying used text(s) 45% 50% 60% 70%
What are the sample size implications of these data?
12. American Ceramics, Inc. (ACI) has been developing a new form of ceramic that can
stand high temperatures and sustained use. Because of its improved properties, the
project development engineer in charge of this project thinks that the new ceramic
will compete as a substitute for the ceramics currently used in spark plugs. She talks
to ACI’s market research director about conducting a survey of prospective buyers of
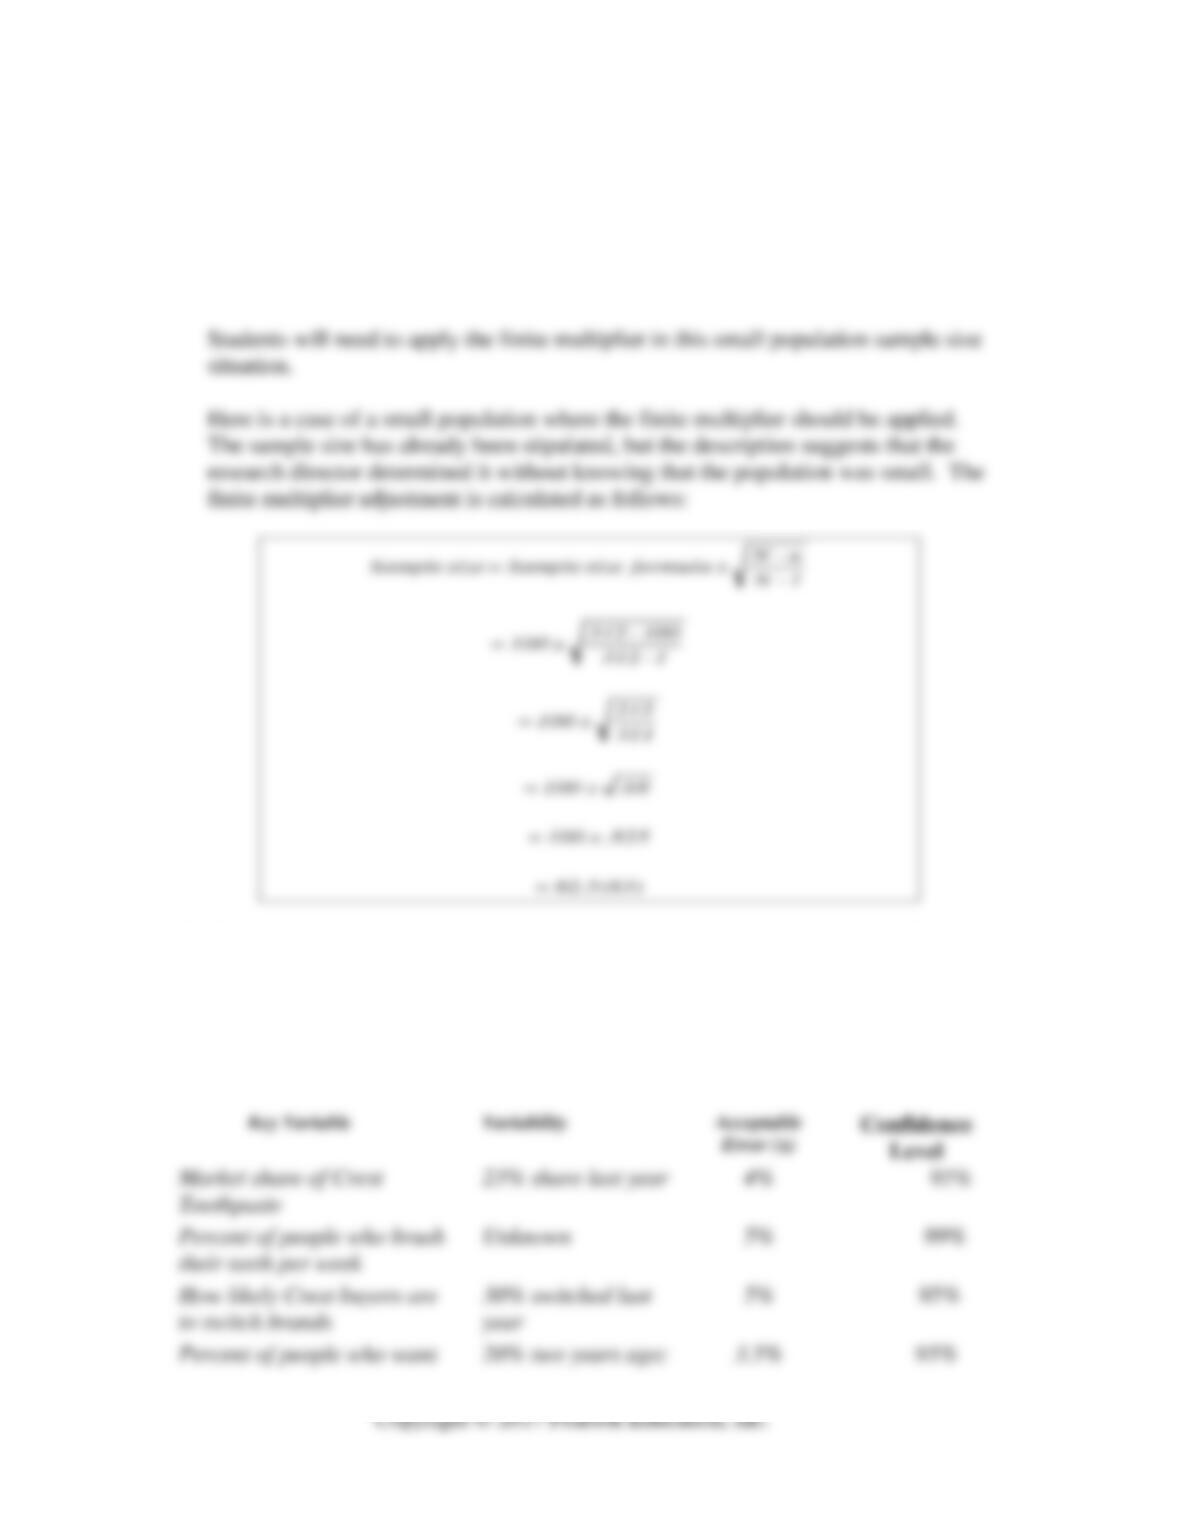
the new ceramic material. During their phone conversation, the research director
suggests a study using about 100 companies as a means of determining market
demand. Later that day, the research director does some background using the
Thomas Register as a source of names of companies manufacturing spark plugs. A
total of 312 companies located in the continental United States are found in the
Register. How should this finding impact the final sample size of the survey?
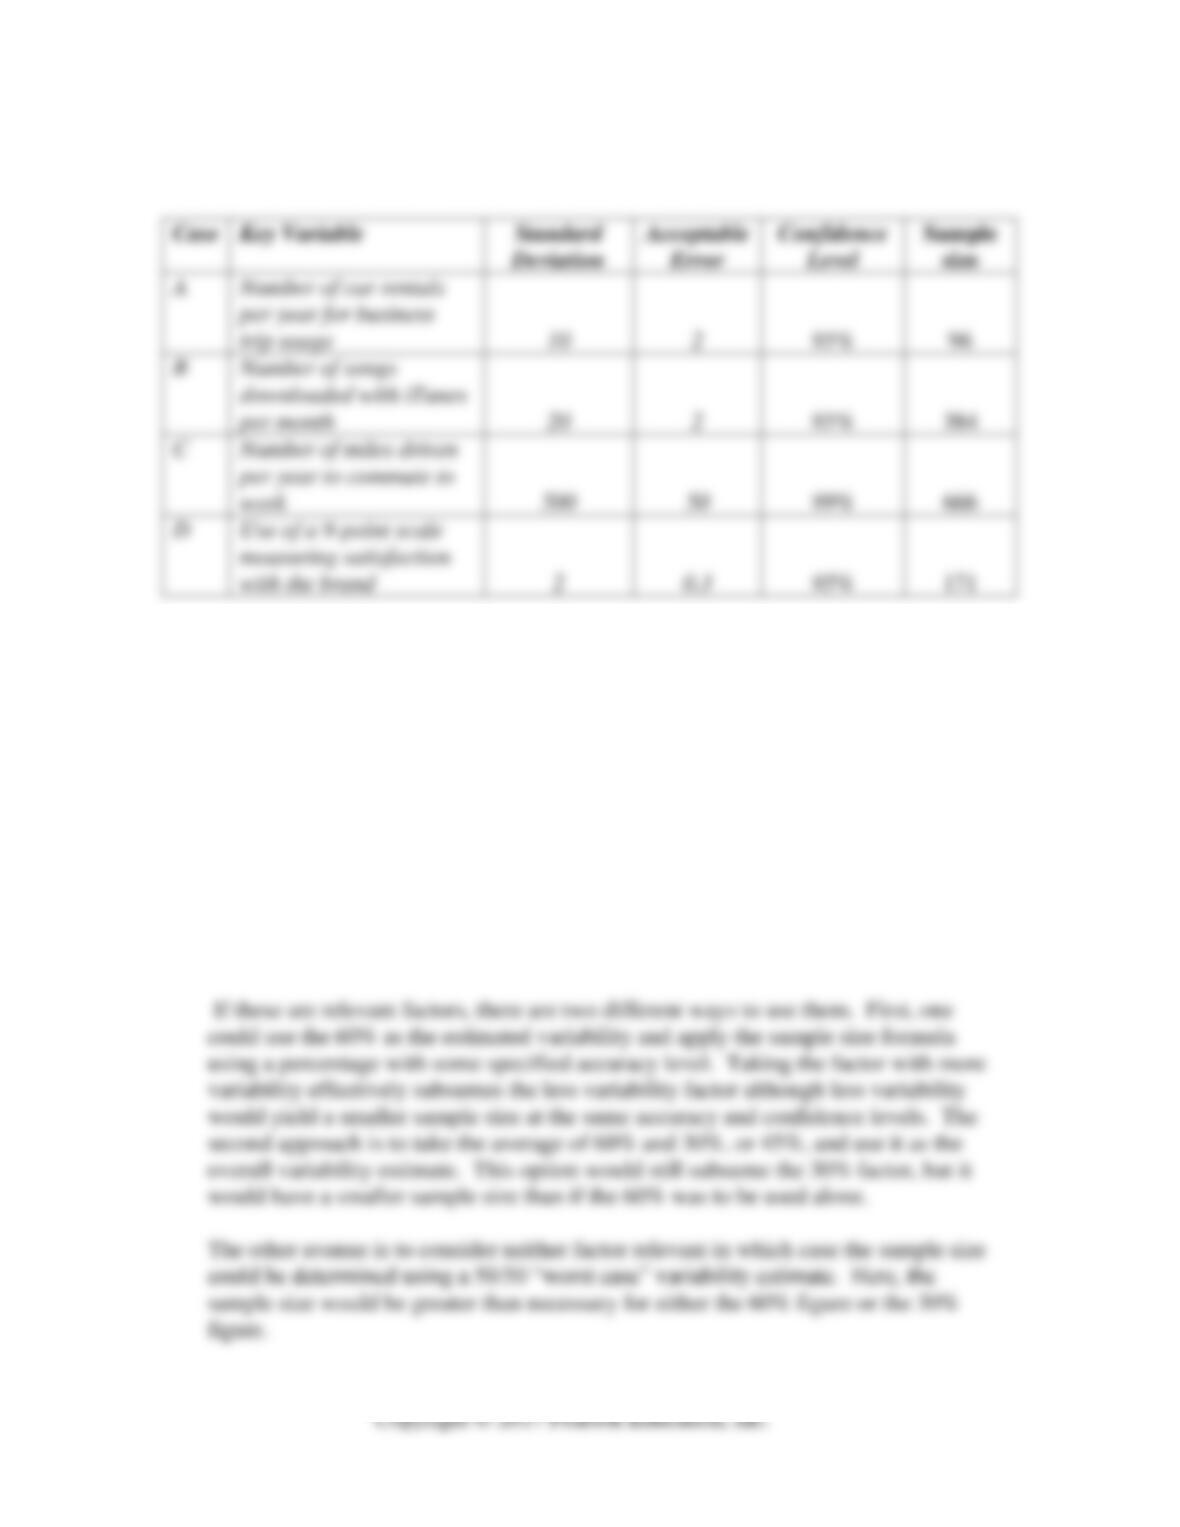
13. Here are some numbers that you can use to sharpen your computational skills for
sample size determination. Crest Toothpaste is reviewing plans for its annual survey
of toothpaste purchasers. With each case that follows, calculate the sample size
pertaining to the key variable under consideration. Where information is missing,
provide reasonable assumptions.
Key Variable
Variability
Acceptable
Error (±)
Confidence
Level
Market share of Crest
Toothpaste
23% share last year
4%
95%
Percent of people who brush
their teeth per week
Unknown
5%
99%
How likely Crest buyers are
to switch brands
30% switched last
year
5%
95%
Percent of people who want
20% two years ago;
3.5%
95%
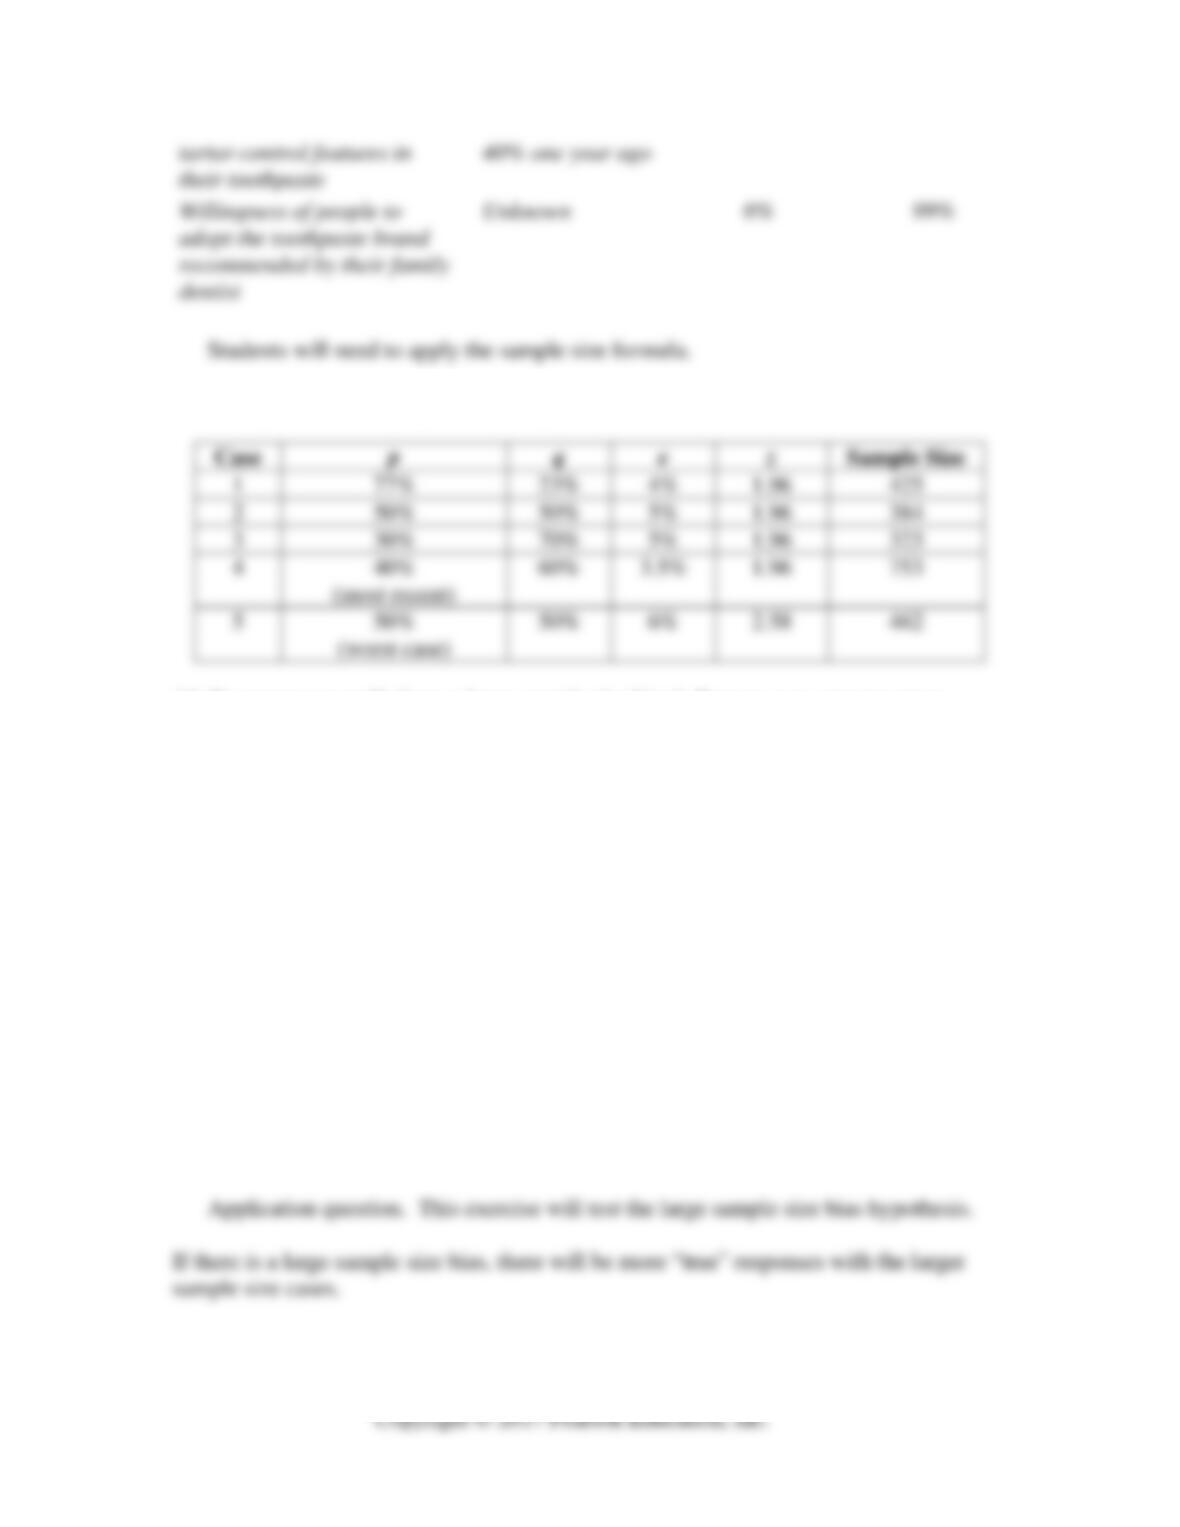
tartar-control features in
their toothpaste
40% one year ago
Willingness of people to
adopt the toothpaste brand
recommended by their family
dentist
Unknown
6%
99%
Students will need to apply the sample size formula.
The calculations and rationale for each follow.
14. Do managers really have a large sample size bias? Because you cannot survey
managers easily, this exercise will use surrogates. Ask any five seniors majoring in
business administration who have not taken a marketing research class the following
questions. Indicate whether each of the following statements is true or false.
a. A random sample of 500 is large enough to represent all the full-time college
students in the United States. True or False.
b. A random sample of 1,000 is large enough to represent all the full-time college
students in the United States. True or False.
c. A random sample of 2,000 is large enough to represent all the full-time college
students in the United States. True or False.
d. A random sample of 5,000 is large enough to represent all the full-time college
students in the United States. True or False.
What have you found out about sample size bias?
15. The following items pertain to determining sample size when a mean is involved.
Calculate the sample size for each case.
The sample size has been appended to the table as a last column.
17. Donald Heel is the Microwave Oven Division Manager of Sharp Products. Don
proposes a $40 cash rebate program as a means of promoting Sharp’s new crisp–
broil-and-grill microwave oven. However, Sharp’s president wants evidence that the
program would increase sales by at least 25%, so Don applies some of his research
budget to a survey. He uses National Phone Systems Company to conduct a
nationwide survey using random digit dialing. National Phone Systems is a fully
integrated telephone polling company, and it has the capability of providing daily
tabulations. Don decides to use this option, and instead of specifying a final sample
size, he chooses to have National Phone Systems perform 50 completions each day.
At the end of five days of field work, the daily results are as follows:
Day 1 2 3 4 5
Total Sample Size 50 100 150 200 250
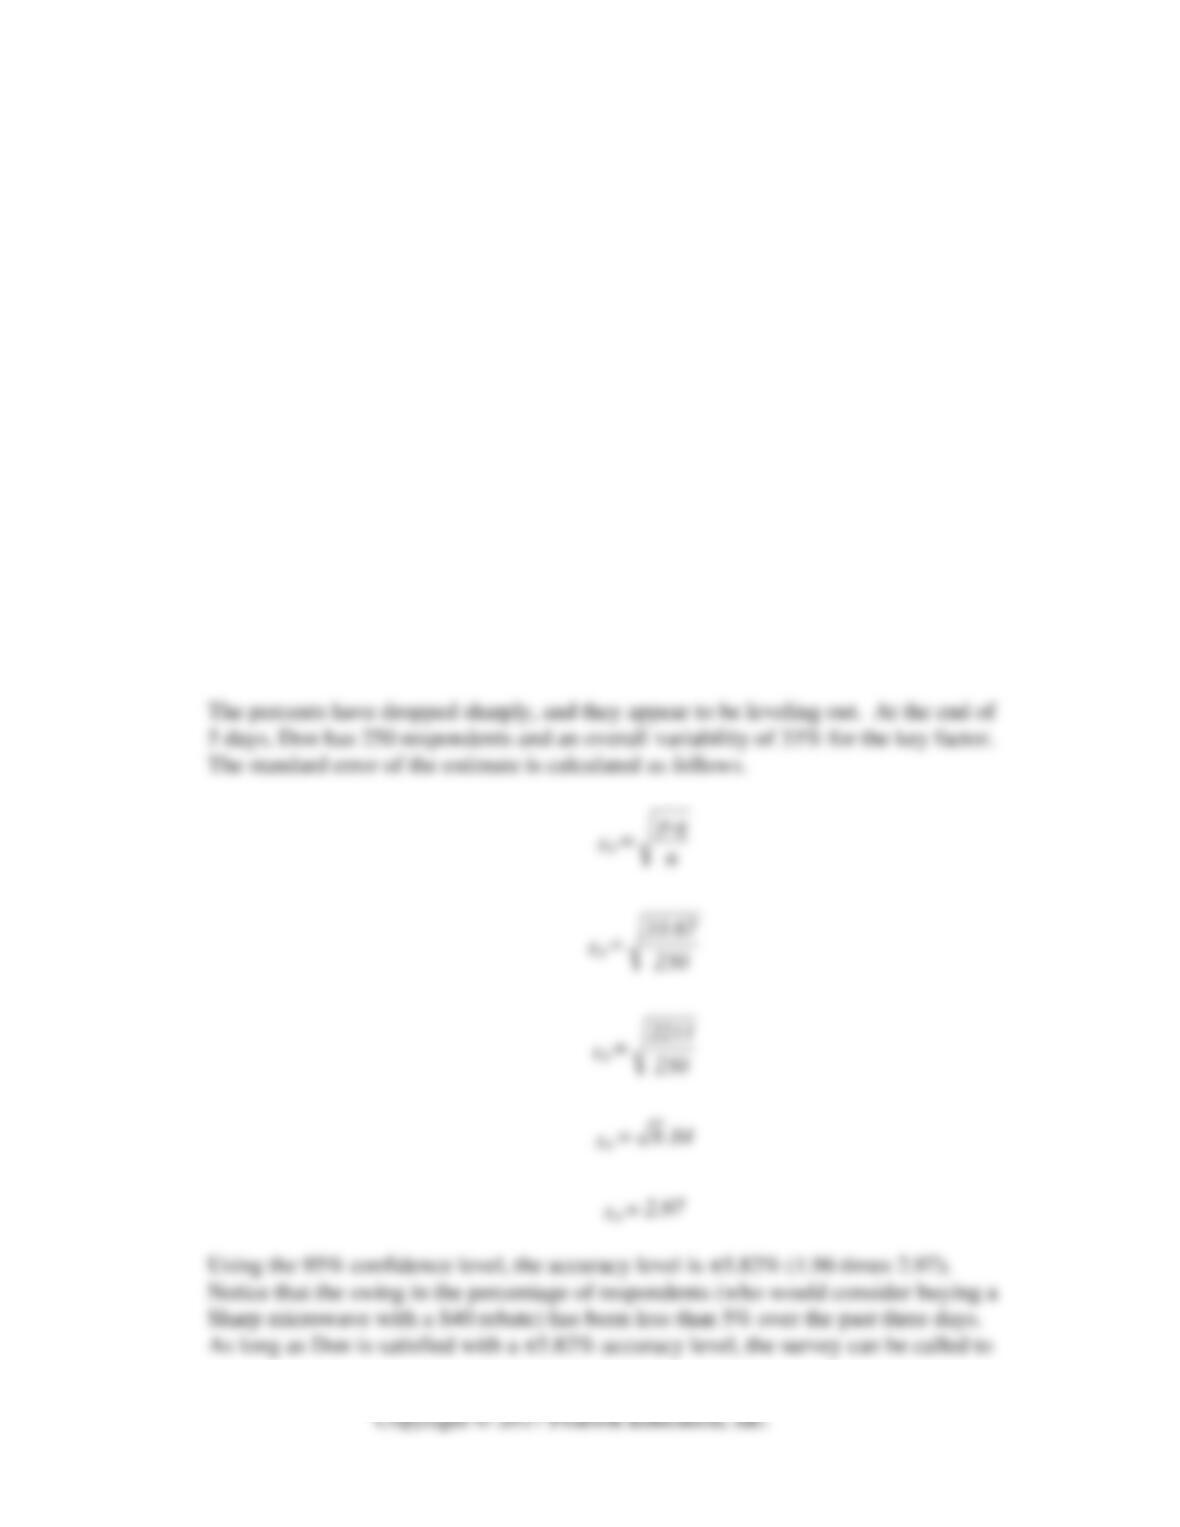
Percent of respondents who
would consider buying a Sharp
microwave with a $40 rebate 50% 40% 35% 30% 33%
For how much longer should Don continue the survey? Indicate your rationale.
Students will need to figure out the implications of a “moving target” estimate.
a halt. If not, Don’s required accuracy level must be identified and used in the sample
size determination formula to calculate the appropriate sample size.
CASE SOLUTIONS
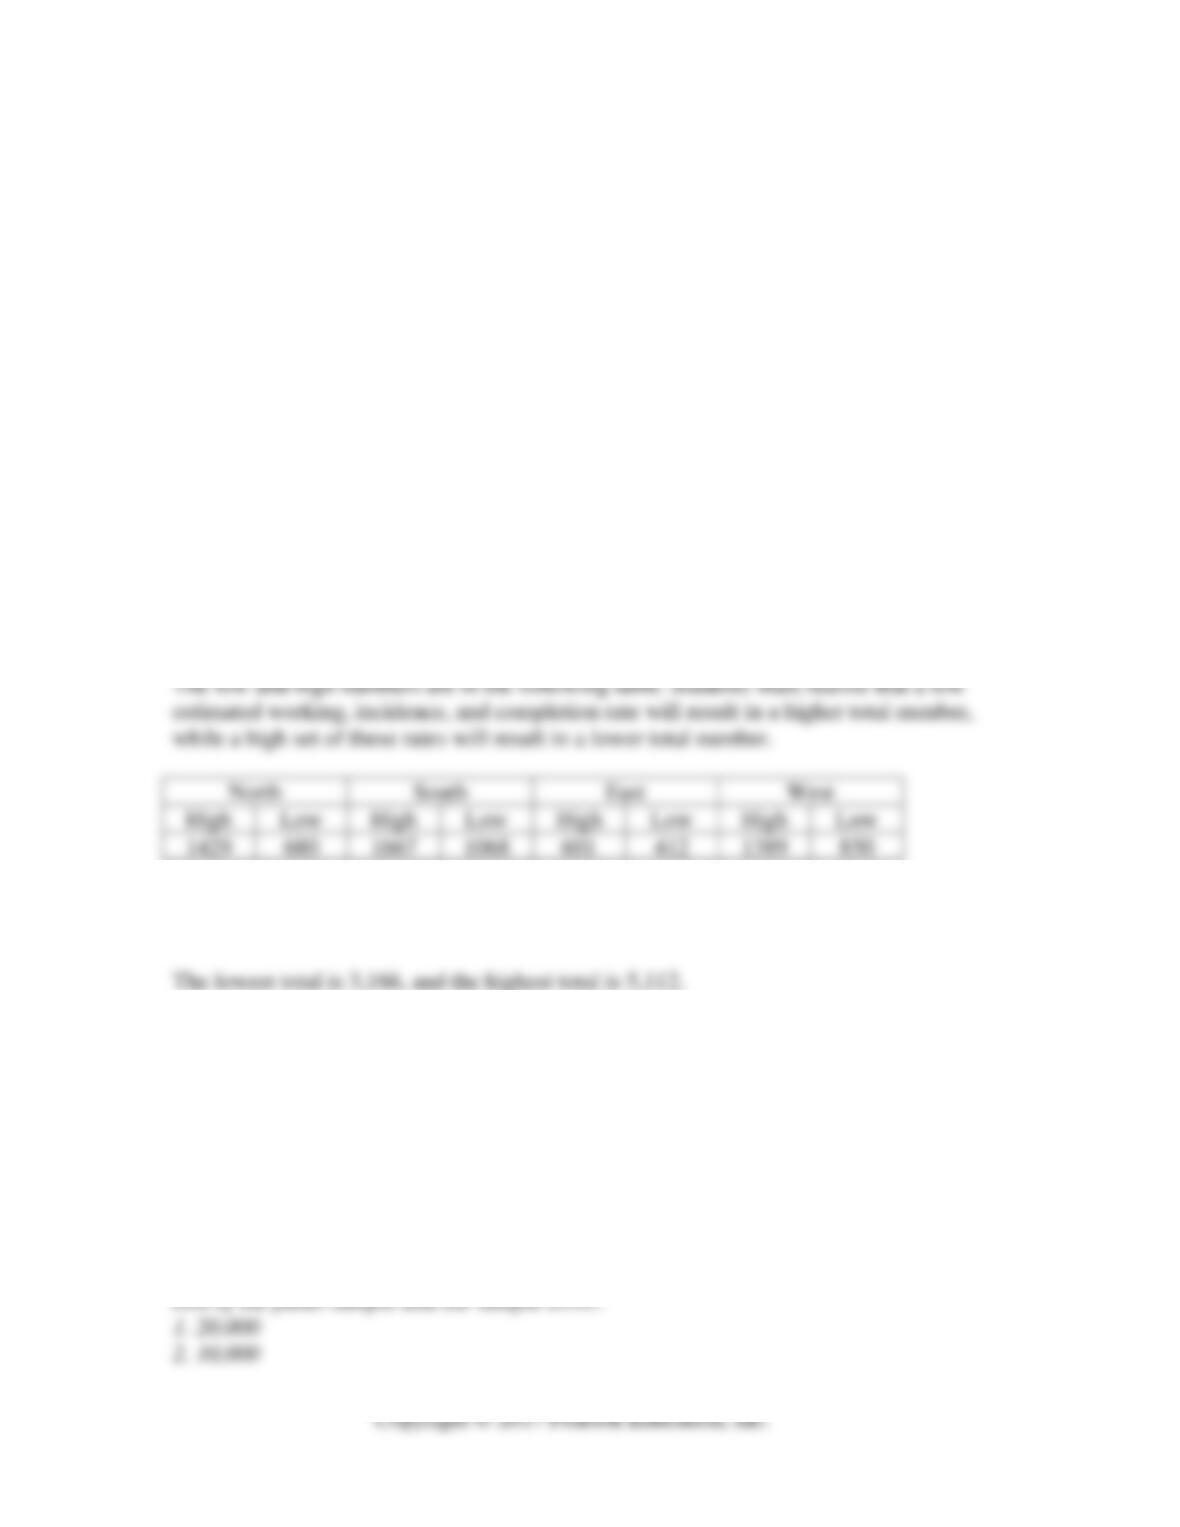
Case 10.1 Target: Deciding on the Number of Telephone Numbers
Case Objective
With this case students must use the formula for the number of telephone numbers
needed in order to obtain a target final sample size.
Answers to Case Questions
1. With a desired final sample size of 250 for each region, what is the lowest total
number of telephone numbers that should be purchased for each region?
2. With a desired final sample size of 250 for each region, what is the highest total
number of telephone numbers that should be purchased for each region?