Solutions to Case Problems
Case 9.1Brett Runs Some Technical Measures on a Stock
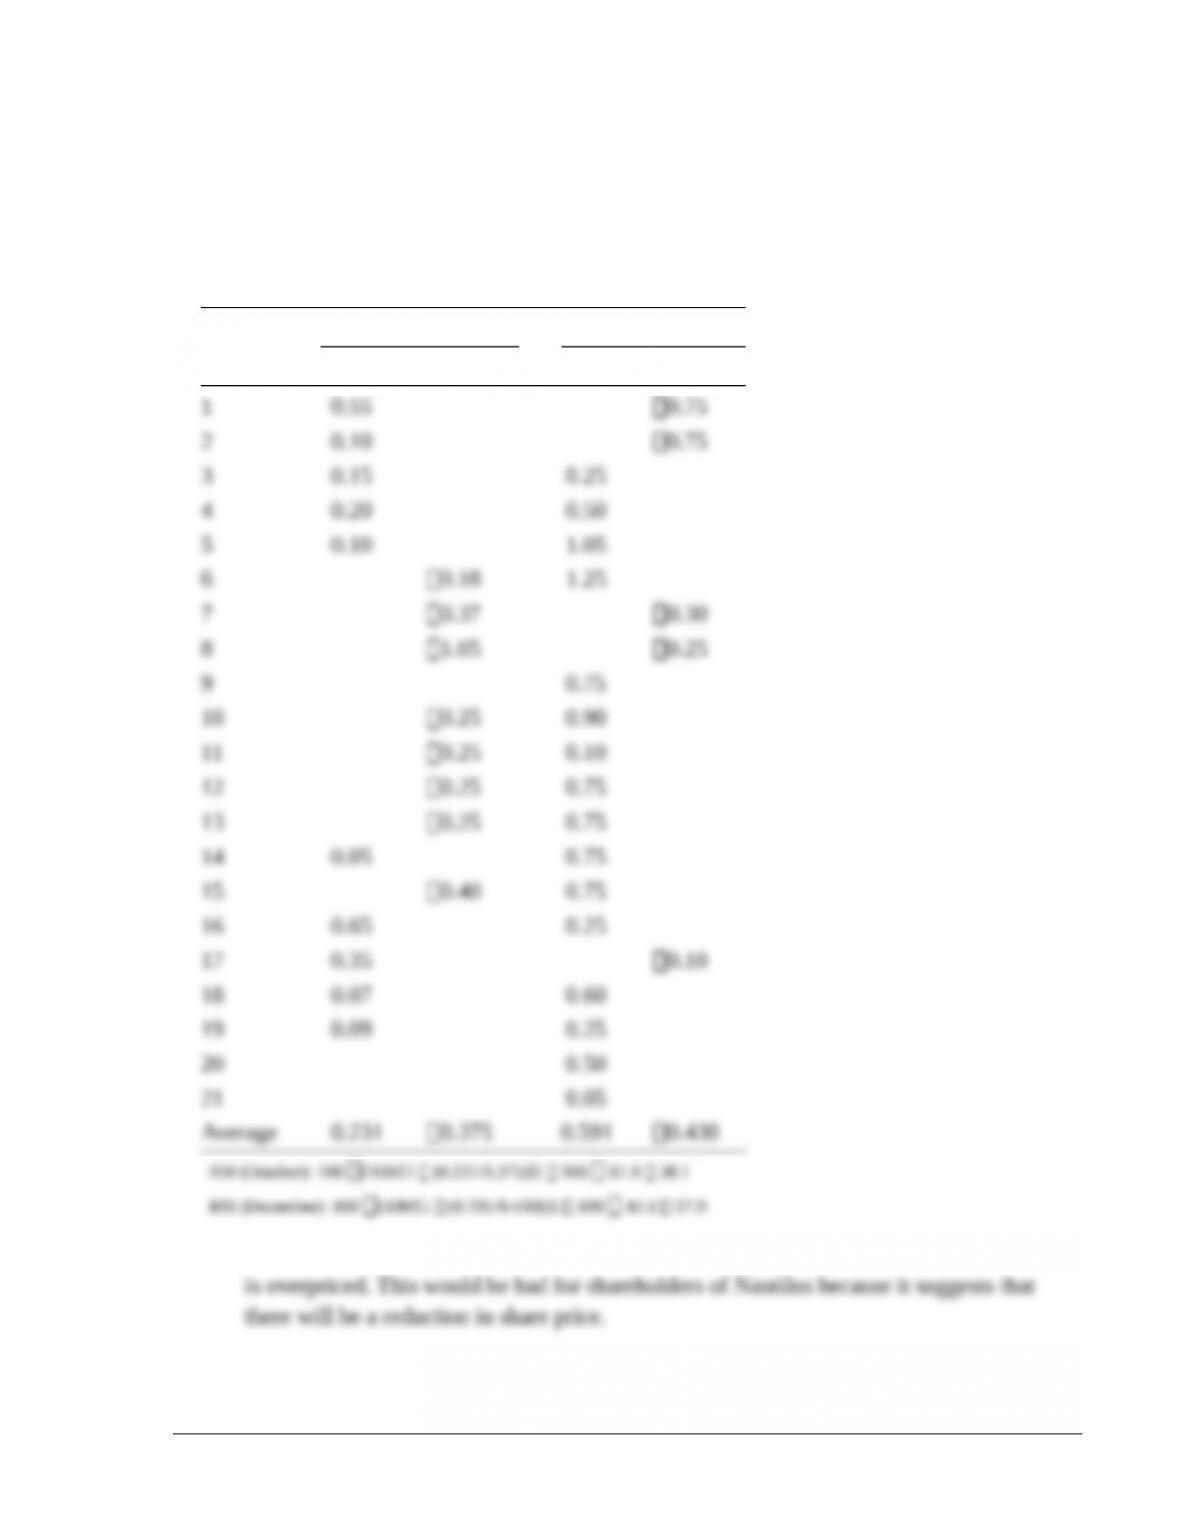
a. RSI 100 [100/(1 APCup days/APCdown days)]
APC Average price change
Day of
Period
11/30/16–12/31/16
Advance Decline Advance Decline
1. The RSI is getting bigger, suggesting that Nautilus Navigation is reaching a point where it
©2017 Pearson Education, Inc.
162 Smart/Gitman/Joehnk • Fundamentals of Investing,Thirteenth Edition
2. The higher RSI value suggests that prices will decline. As such, it is giving a sell signal.
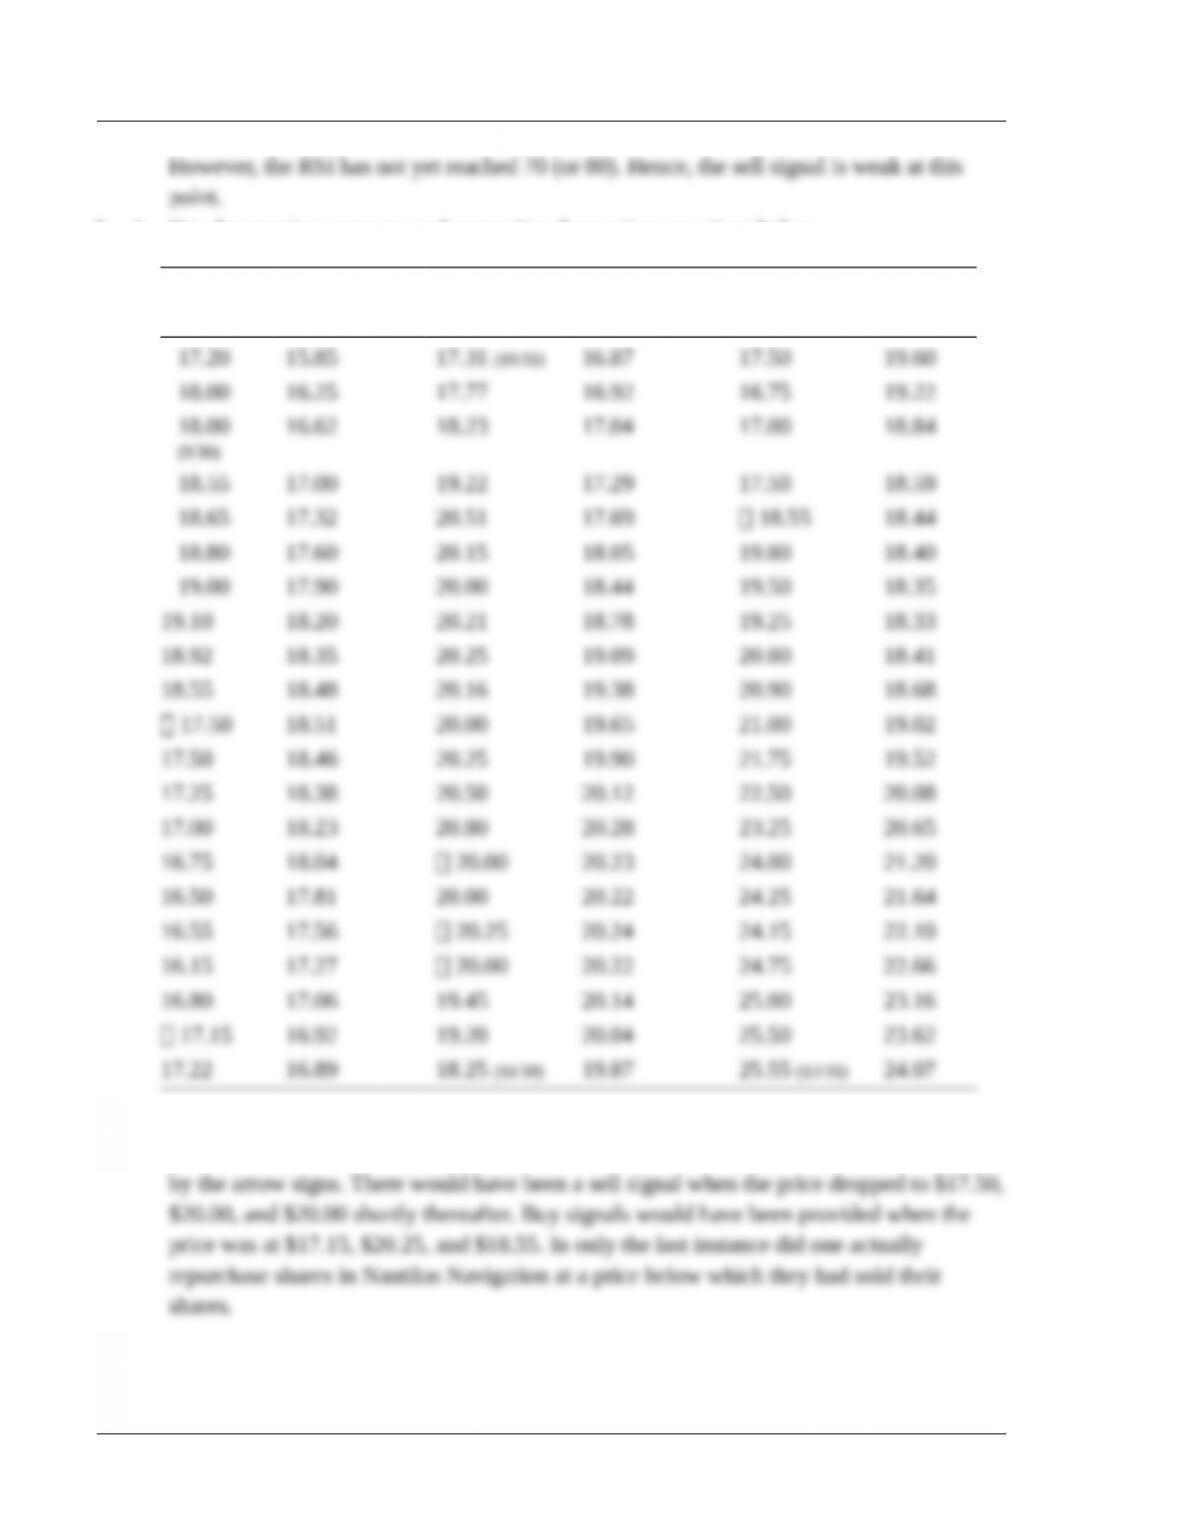
b. 1. Ten-day moving averages and respective share prices are given below.
Price
Moving
Average Price
Moving
Average Price
Moving
Average
B 1 & 2. At the end of August, the price is above the moving average. From that point
forward, there are six times when the price crosses the moving average value, as signified
©2017 Pearson Education, Inc.
Chapter 9 Market Efficiency and Behavioral Finance 163
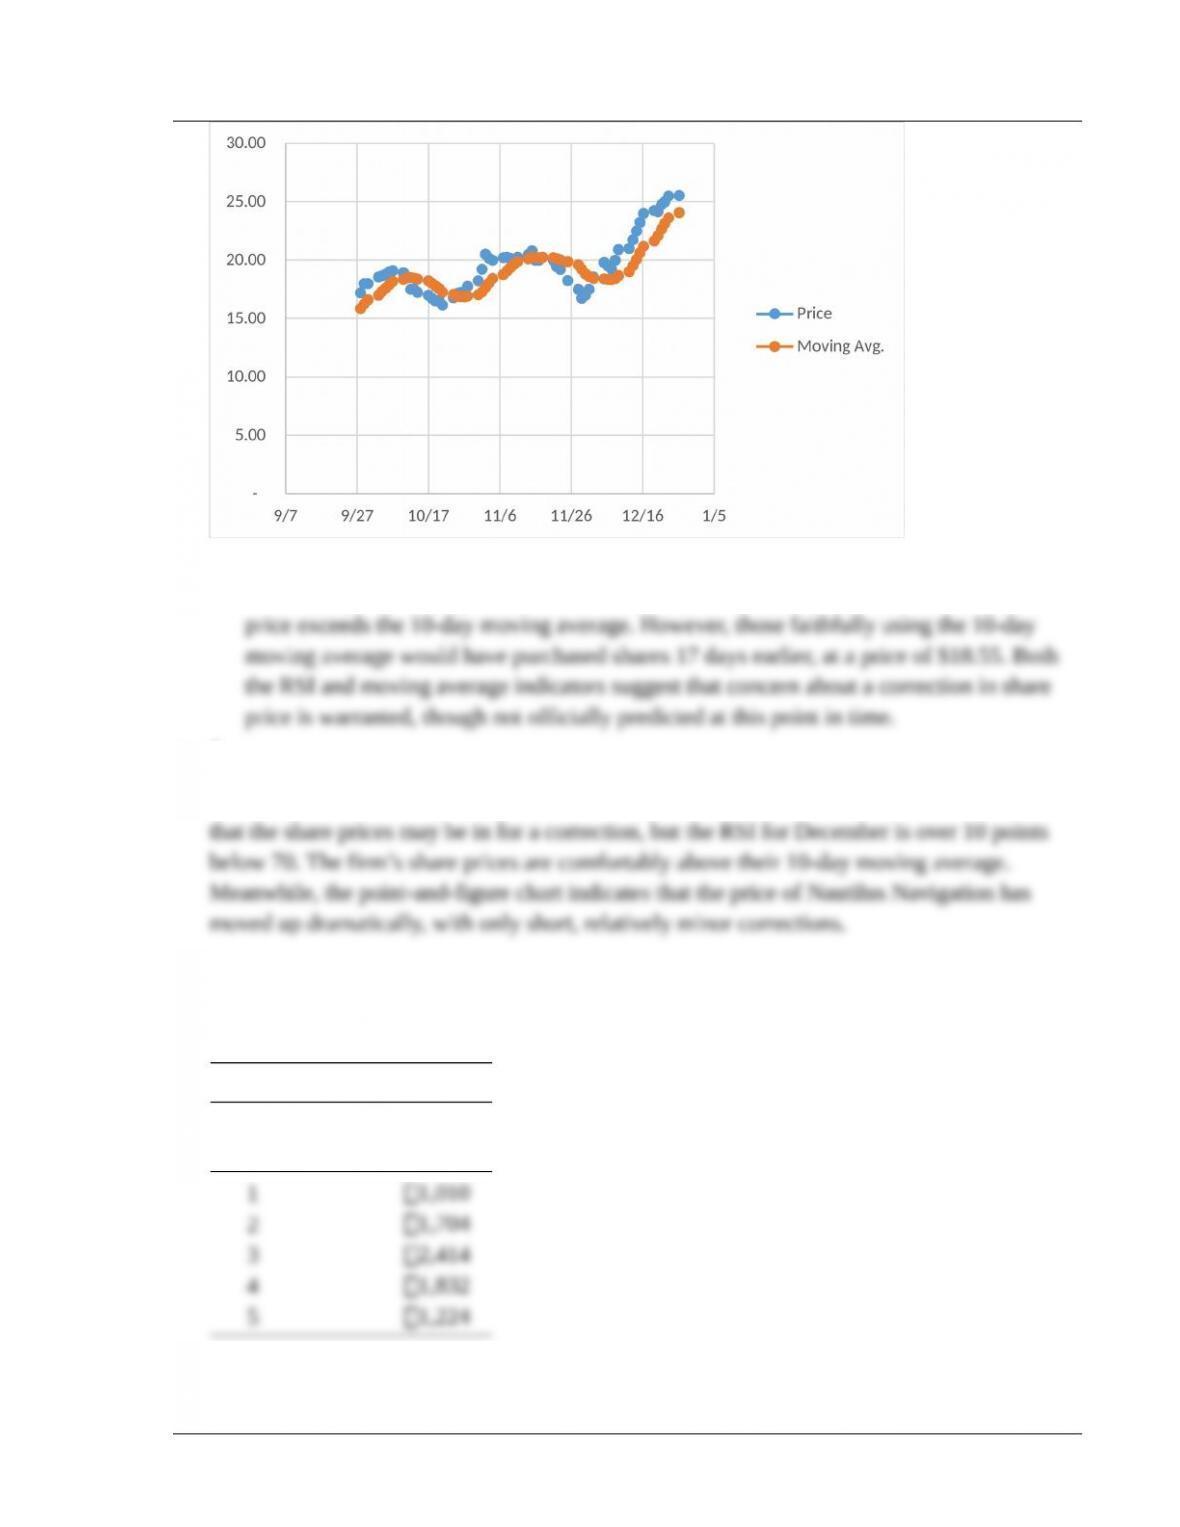
c. The moving average signal as of 12/31/16would be to buy shares since its current share
c. 1
d. The technical indicators are in general sending Brett a positive signal. The RSI index suggests
Case 9.2Deb Takes Measure of the Market
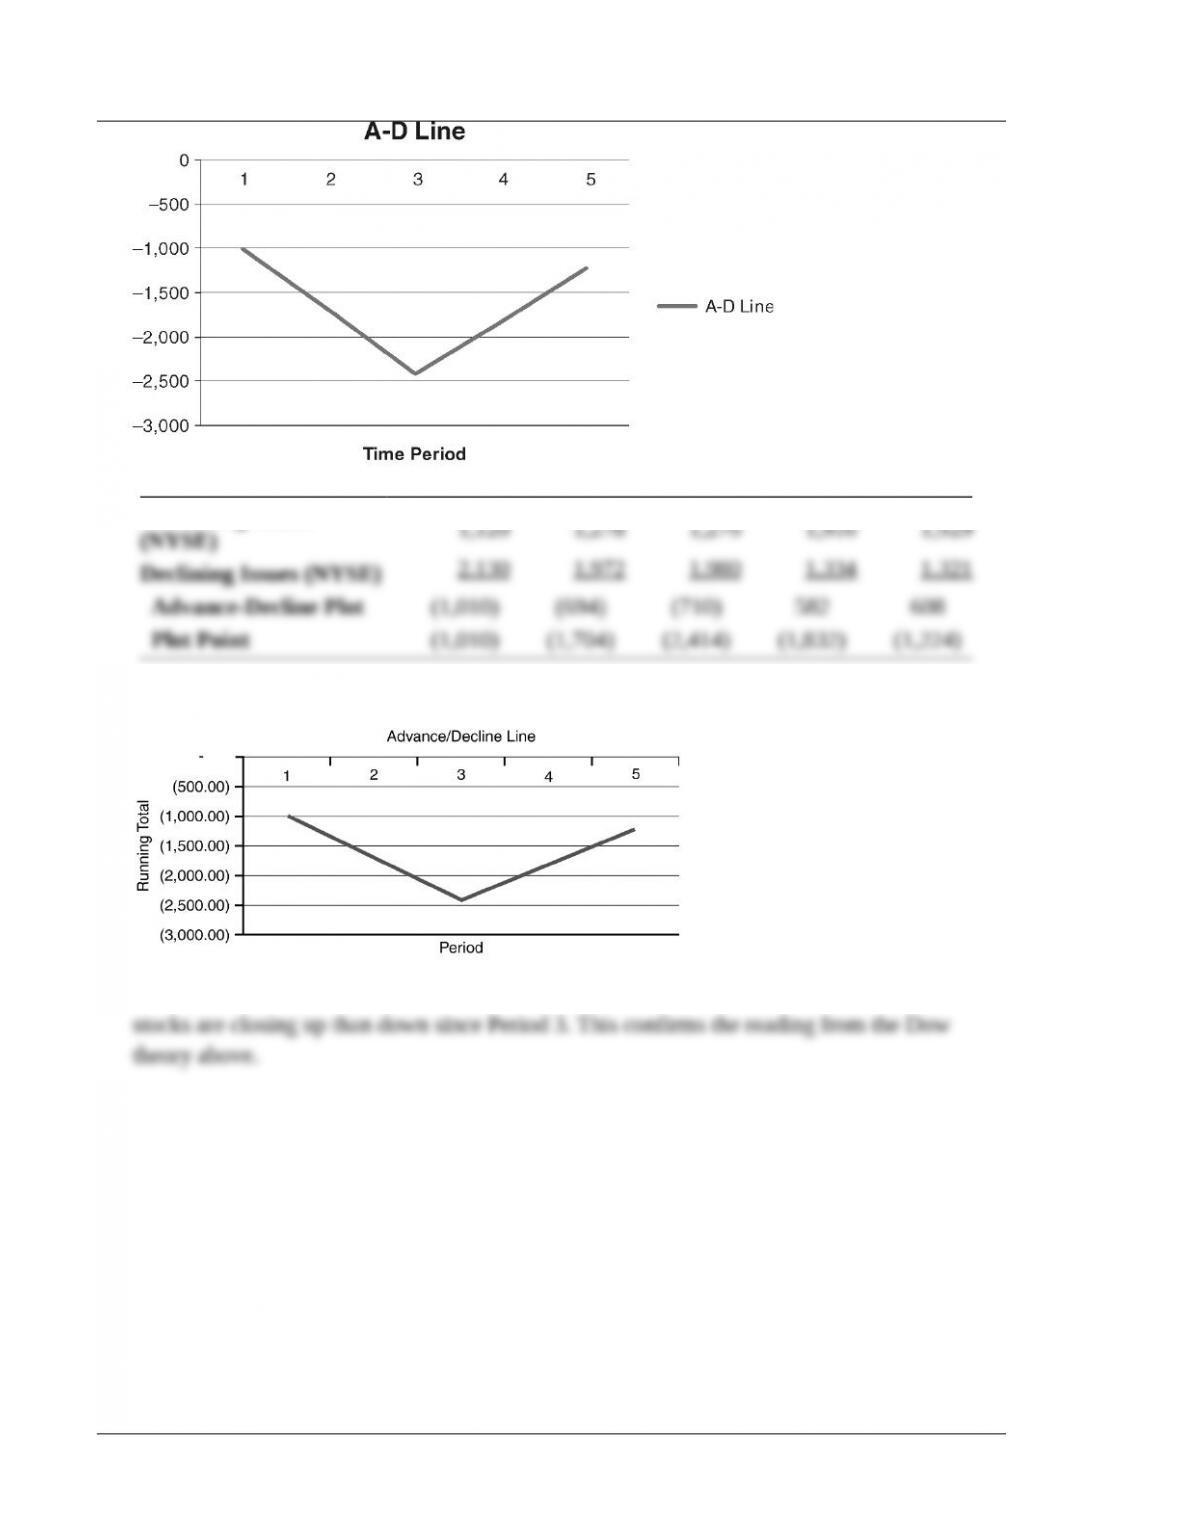
a-b.Advance-Decline Line. The advance-decline chart based on the data from the table:
Advance-Decline Line
x y
Time Period A-D Line
©2017 Pearson Education, Inc.
164 Smart/Gitman/Joehnk • Fundamentals of Investing,Thirteenth Edition
Advancing Issues
The advance-decline line, adding the net advance/decline from previous period (plot point):
Based on the rising advance-decline line, it appears the market has turned bullish. Many more
©2017 Pearson Education, Inc.
Chapter 9 Market Efficiency and Behavioral Finance 165
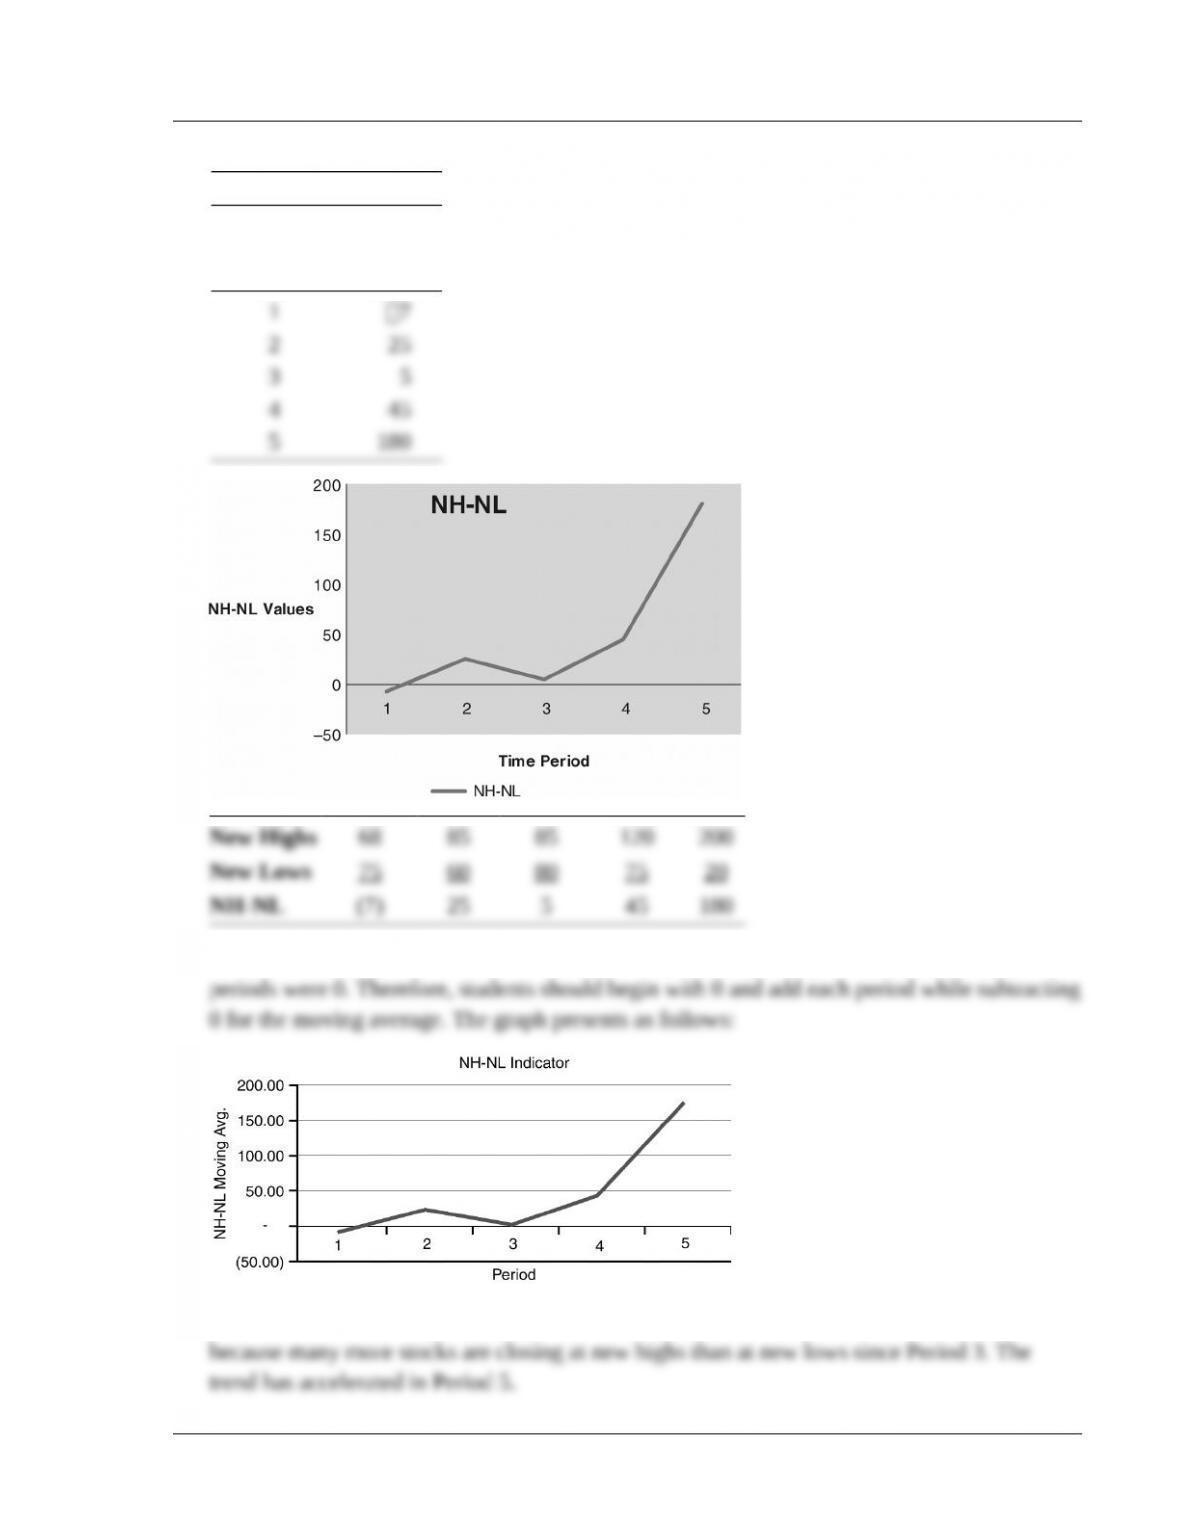
. New highs–new lows (the NH-NL indicator):
NH-NL
x y
Time Period NH-NL
The problem states that the current NH-NL 10-day moving average is 0 and that the past 10
The NH-NL indicator is very positive. This is further confirmation of the bullish trend
©2017 Pearson Education, Inc.
166 Smart/Gitman/Joehnk • Fundamentals of Investing,Thirteenth Edition
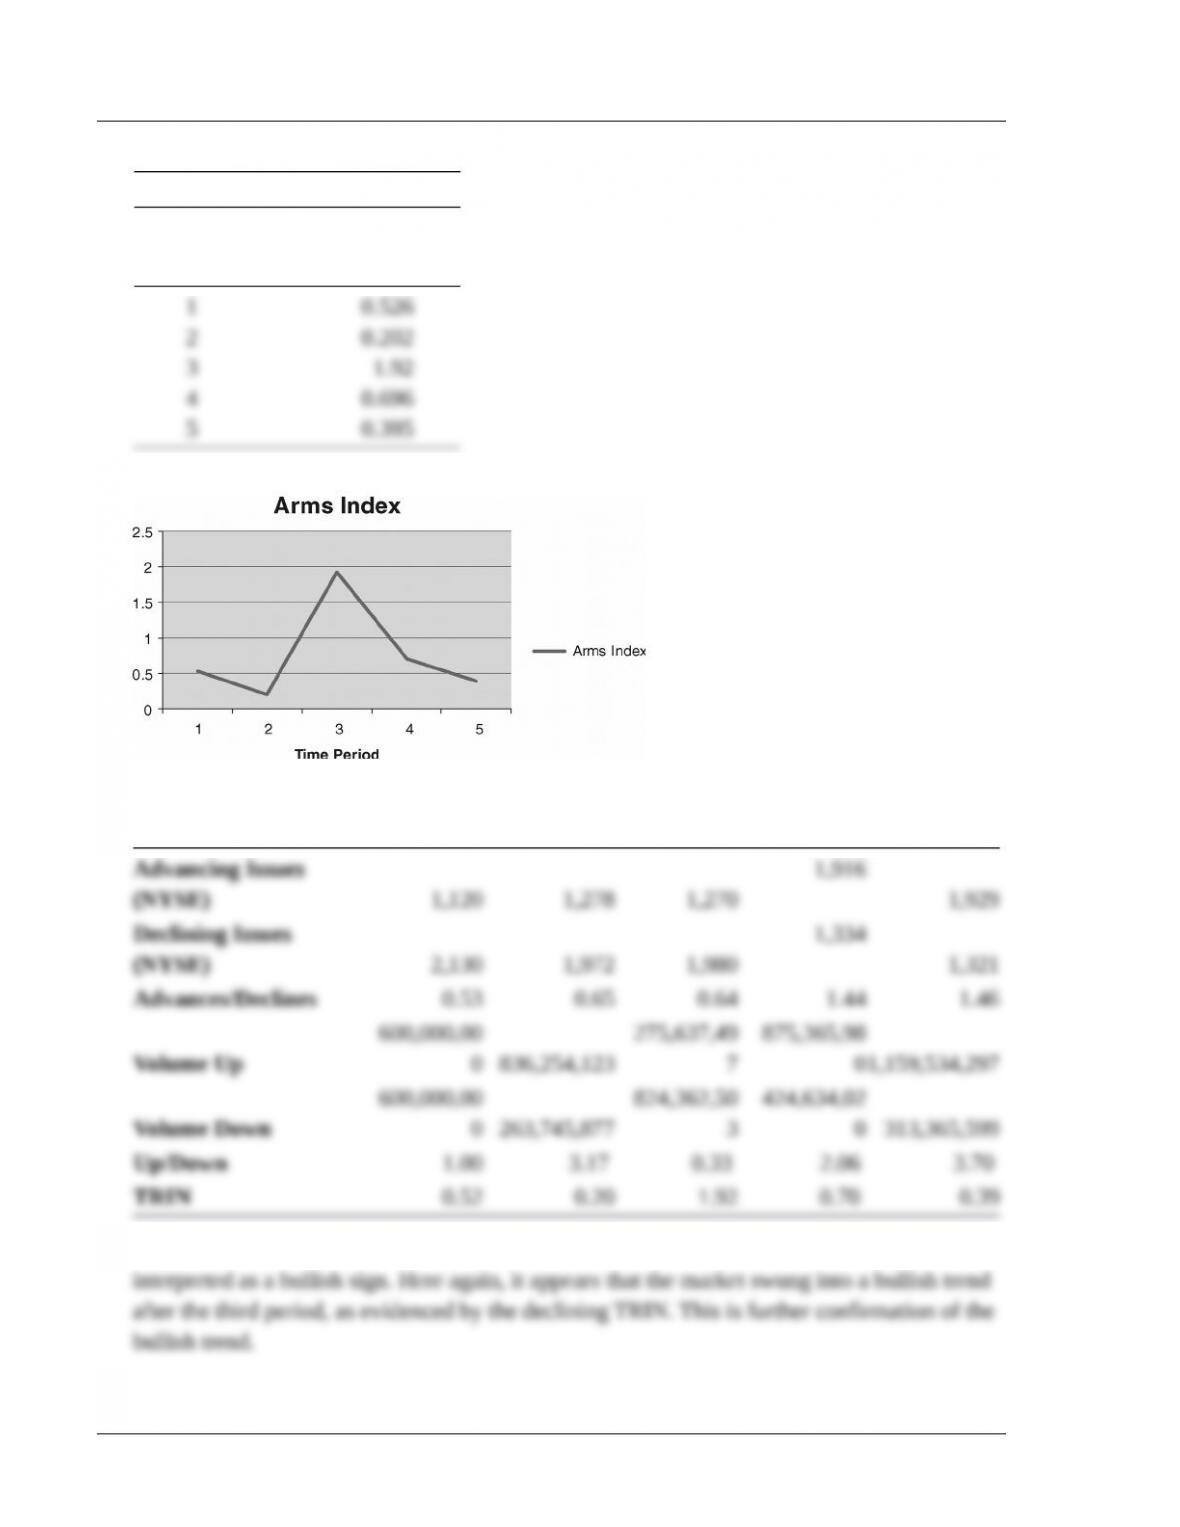
. The Arms Index, or TRIN, is calculated as follows:
Arms Index
x y
Time Period Arms Index
TRIN [(# of up stocks)/(# of down stocks)]/[(volume in up stocks)/(volume in down
stocks)]
Higher TRIN values are interpreted as bad for the market, while lower TRIN values are
©2017 Pearson Education, Inc.
Chapter 9 Market Efficiency and Behavioral Finance 167
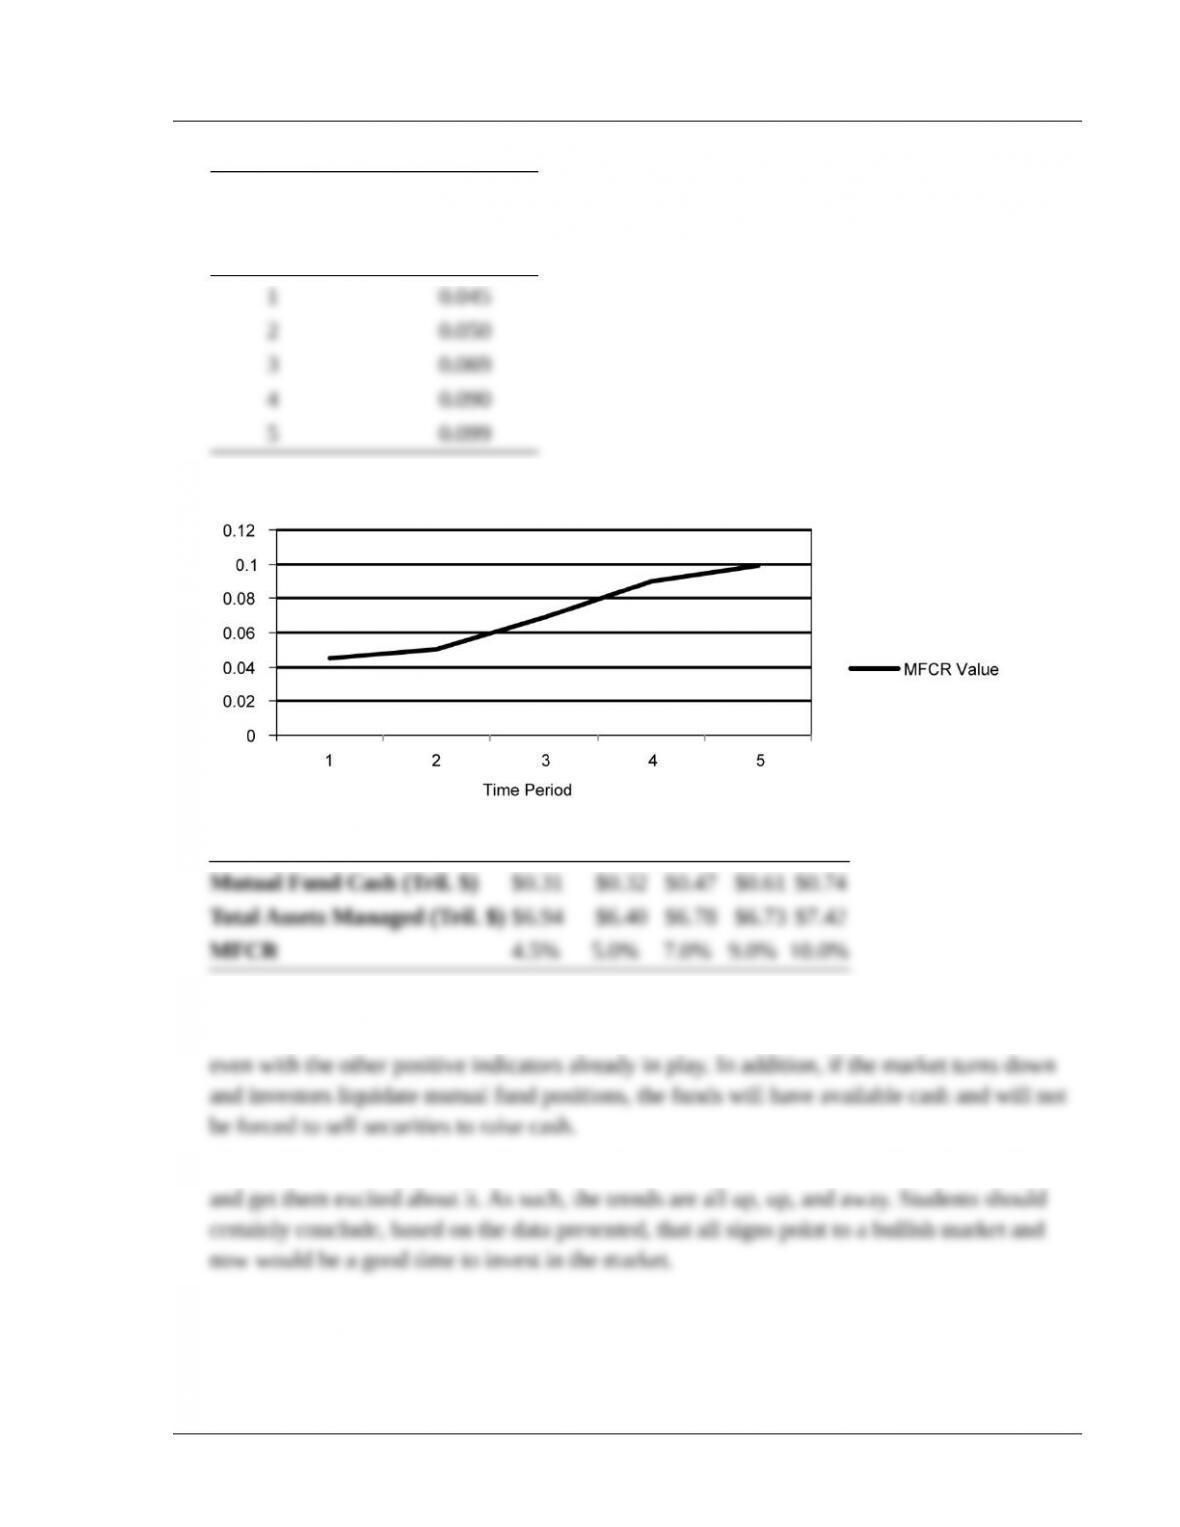
. The mutual fund cash ratio is calculated as follows:
Mutal Fund Cash Ratio
x y
Time Period MFCR Value
MFCR Mutual fund cash position/Total assets under management
The MFCR is also positive, again confirming the bullish trend. Funds are holding a large
amount of cash in Period 5 at 10% of total assets. There could be pent-up demand for stocks
This problem has been designed to give students a positive experience with market analysis
©2017 Pearson Education, Inc.
168 Smart/Gitman/Joehnk • Fundamentals of Investing,Thirteenth Edition
c. Time period comment:Some students may point to changes in the trends over the five period
One way to address this issue is to discuss the time period as an issue and conclude that if the
Answers to CFA Questions (Part III)
©2017 Pearson Education, Inc.