Chapter 2 Securities Markets and Transactions 15
Suggested Answers to Discussion Questions
9.1 Answers will vary by student. The main points to include would be:
a. An efficient market is one in which securities fully reflect all possible information quickly and
b. Market prices may not always be correctly set especially in the securities markets of emerging
c. The key reason for using fundamental analysis arises from the fact that firm success will be a
9.2 The EMH says that “beating the market” in any given year is a matter of chance. This means that
in any given year, some managers will beat the market, even on a risk-adjusted basis, and some will
9.3 Several of the key assumptions about investor behavior that serve as a basis for behavioral finance are
given below.
a. Loss aversion is the tendency for individuals to dislike losses more than they like gains. As a
b. Representativeness reflects an individual’s tendency to make strong conclusions from limited
c. Investors guilty of narrow framing analyze an investment on its own merits without considering
d. Overconfidence refers to the tendency for individuals to over estimate their skills and/or their
e. Investors guilty of biased self-attribution will take undue credit for good selections and blame
©2017 Pearson Education, Inc.
16 Smart/Gitman/Joehnk • Fundamentals of Investing, Thirteenth Edition
9.4 Stock valuation is often based on forecasts of dividends and discount rates. If representativeness leads
9.5 Technical analysis involves the study of historical patterns in stock prices. Technical analysts argue
that internal market factors, such as trading volume and price movements, often create repeating
9.6 a. The Confidence Index is the ratio of the average yield on high-grade corporate bonds to
the average yield on low-grade corporate bonds. Low-rated bonds always provide a higher yield
b. The Arms Index builds on the advance-decline line by considering the volume in advancing and
c. Odd-lot trading is based on the assumption that small investors will be the last to invest in a bull
market and last to sell in a bear market. Hence, as the number of odd-lot purchases increases,
d. Charting results in a visual summary of share price over time. Technical analysts believe the
e. Moving averages compare current share price to the average share price over a specified period.
The period might, for instance, be 200 days. Every new day is added to the average, and the
f. On balance volume (OBV) is a momentum indicator that relates volume to price change. When
the security closes higher than the previous day, all the day’s volume is considered up volume
9.7 a. Breadth of the market deals with advances and declines. So long as the number of stocks
©2017 Pearson Education, Inc.
Chapter 2 Securities Markets and Transactions 17
b. Short interest deals with the amount of sharesinvestors who borrow stocks to sell in anticipation
c. The relative strength index (RSI) is the ratio of the average price change on up days versus down
d. The theory of contrary opinion is a technical indicator that uses the amount and type of odd-lot
Solutions to Problems
9.1 TRIN (# of up stocks/# of down stocks)/(Up volume/Down volume)
More stocks rose than fell on all three days. Hence, the numerator is always greater than 1. On Day 2,
9.2 a.
Period 1 Period 2 Period 3 Period 4
High-grade yield/average yield
b. The yield spread has fallen from 155 to 25 over the past year (remember, each period lasts six
c. The higher Confidence Index suggests that investors are more confident about future economic
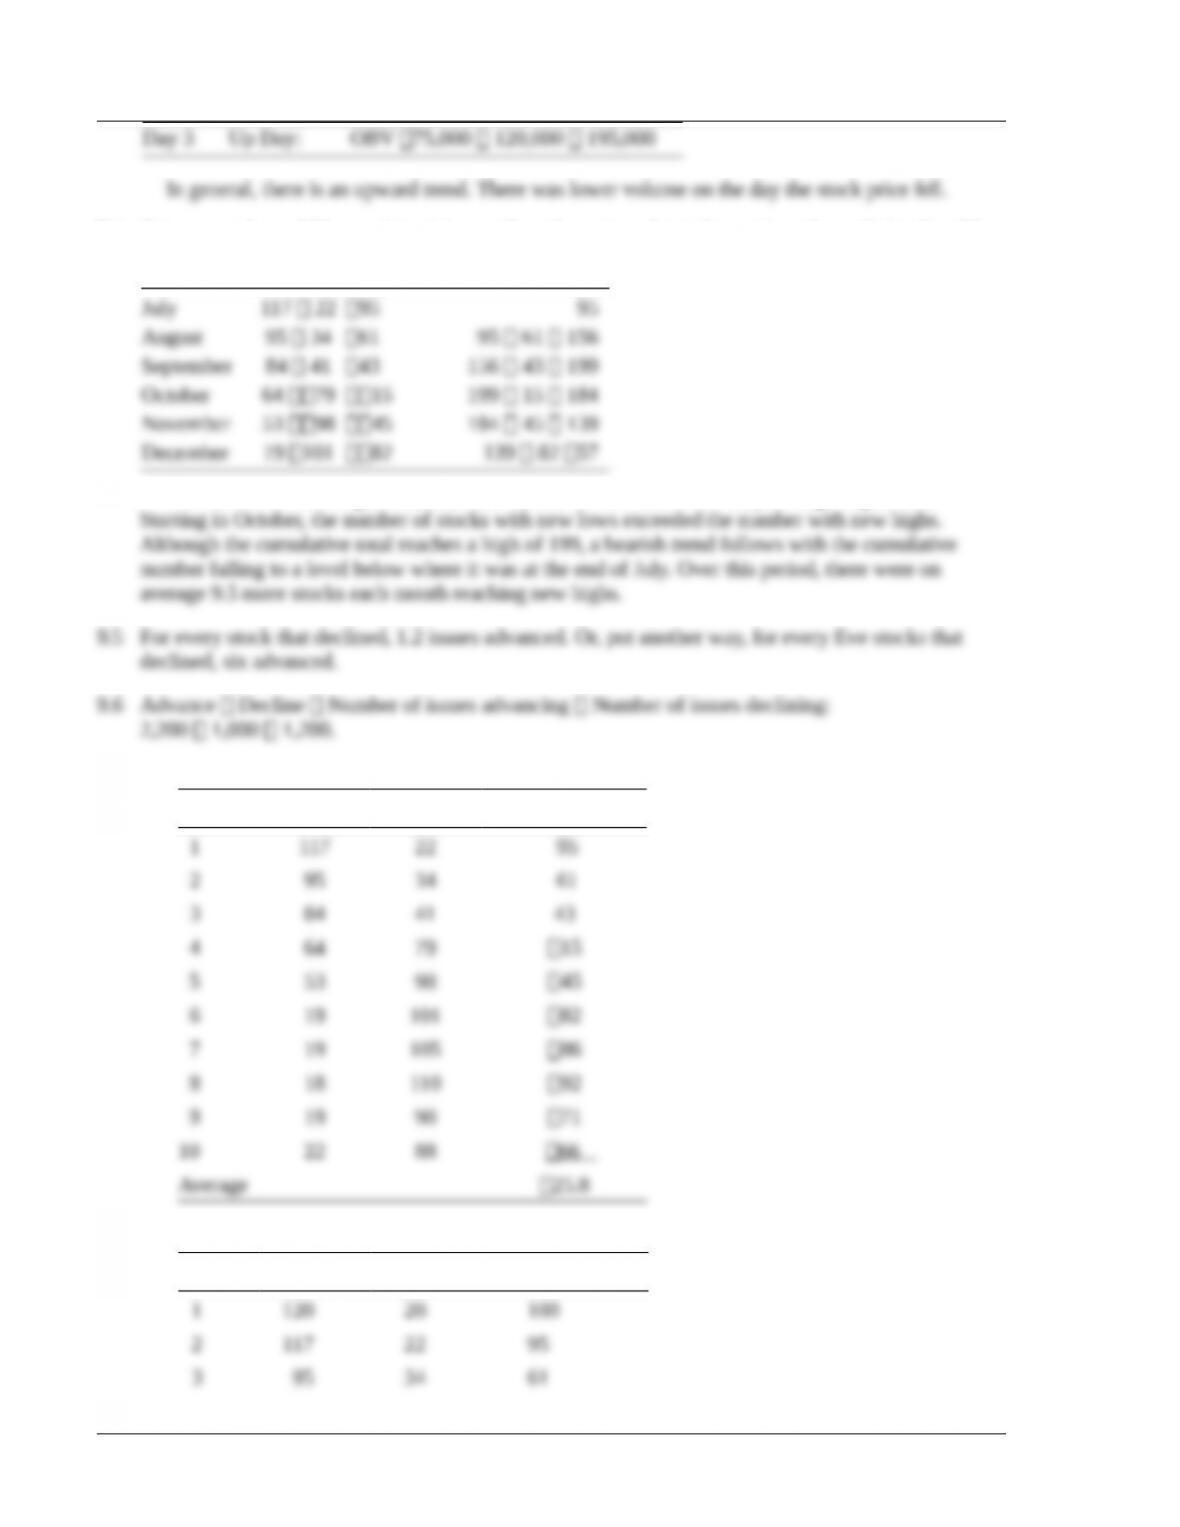
9.3 OBVt+1 OBVt Total volume if price rose (or less Total volume if price fell)
©2017 Pearson Education, Inc.
18 Smart/Gitman/Joehnk • Fundamentals of Investing, Thirteenth Edition
9.4 One approach would be to subtract the number of new lows from the number of new highs. Resulting
values are added together, as shown below.
The number of new highs exceeded the number of new lows from July through September.
9.7 a.
Day New Highs New Lows NH-NL Indicator
b.
Day New Highs New Lows NH-NL Indicator
©2017 Pearson Education, Inc.
Chapter 2 Securities Markets and Transactions 19
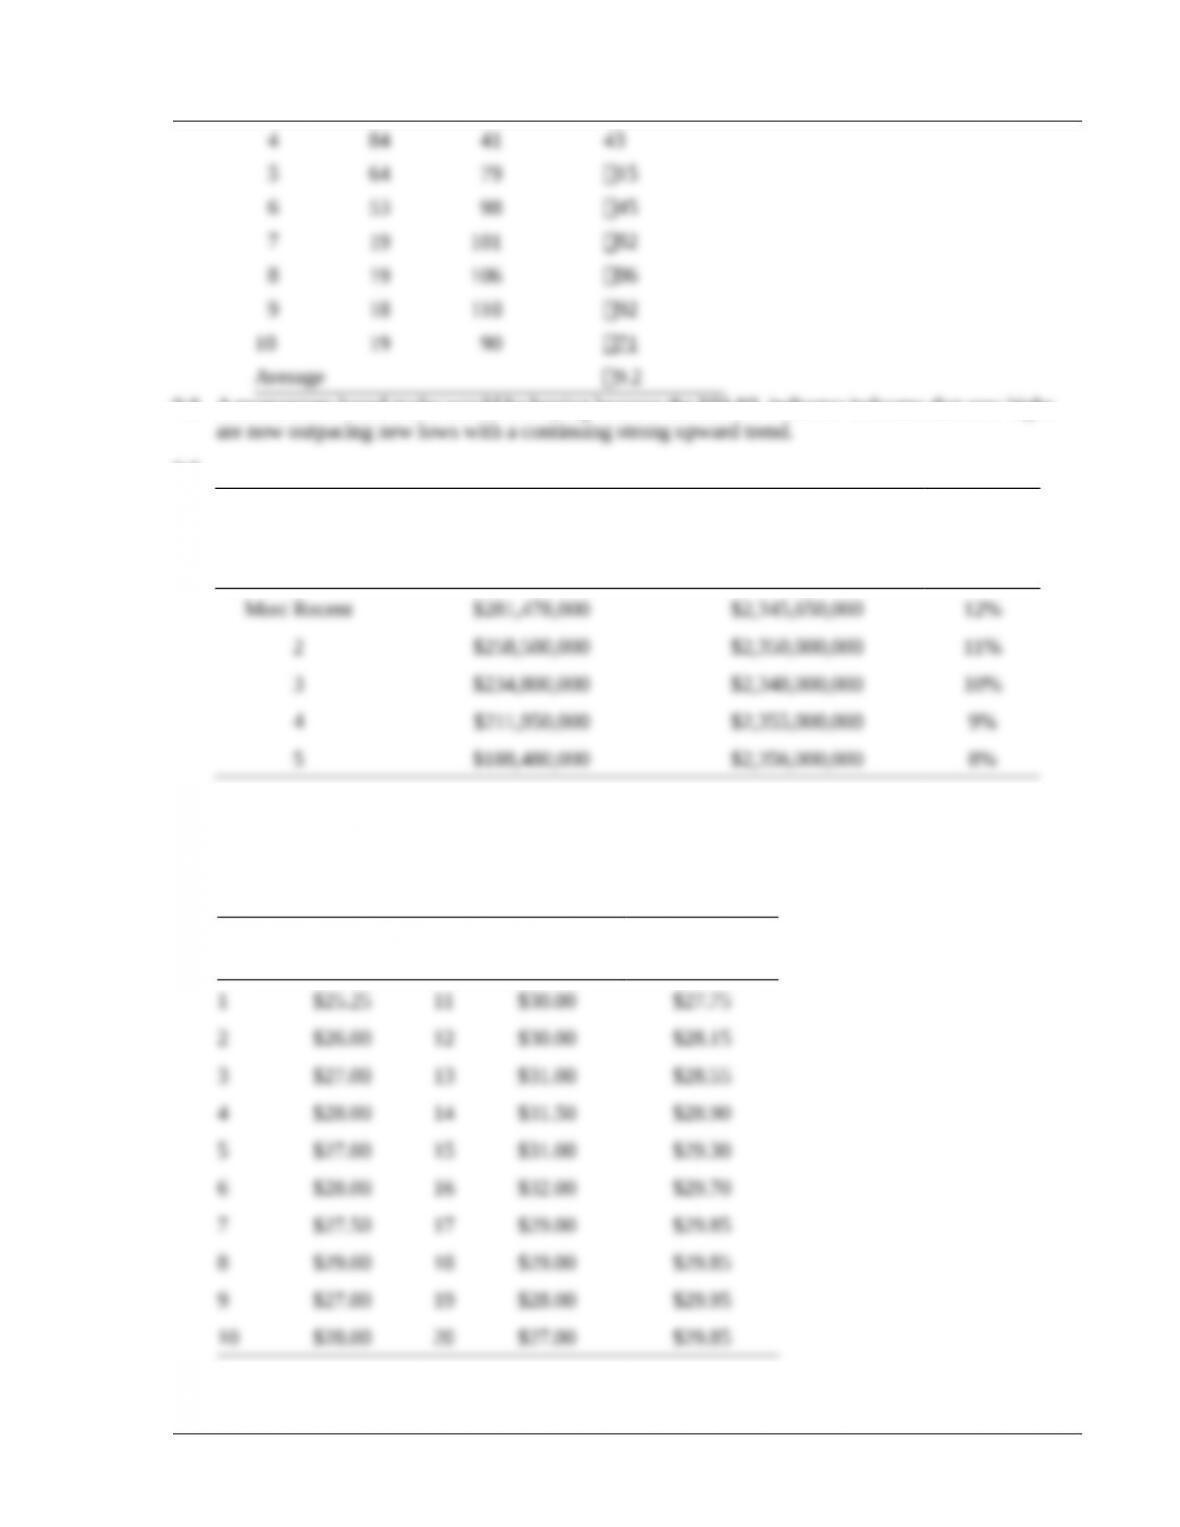
9.8 A momentum-based trader would be buying because the NH-NL indicator indicates that new highs
9.9
A B A/B
Week
Mutual Fund
Cash Position
Mutual Fund
Total Assets MFCR
Conventional wisdom says that when the cash ratio exceeds 10% to 12%, the ratio is sending a
bullish signal. However, students may also argue that, given the trend and how recent the buildup in
cash is, the signal is bearish in the current time frame.
9.10
Day Closing Price Day Closing Price
10-Day
Moving Avg.
©2017 Pearson Education, Inc.
20 Smart/Gitman/Joehnk • Fundamentals of Investing, Thirteenth Edition
Based on the data, the price fell below the 10-day moving average on Day 17, providing a sell
signal. Based on the 10-day average, the stock should be sold. Longer averages are generally used,
such as 50-day and 200-day, for this purpose.
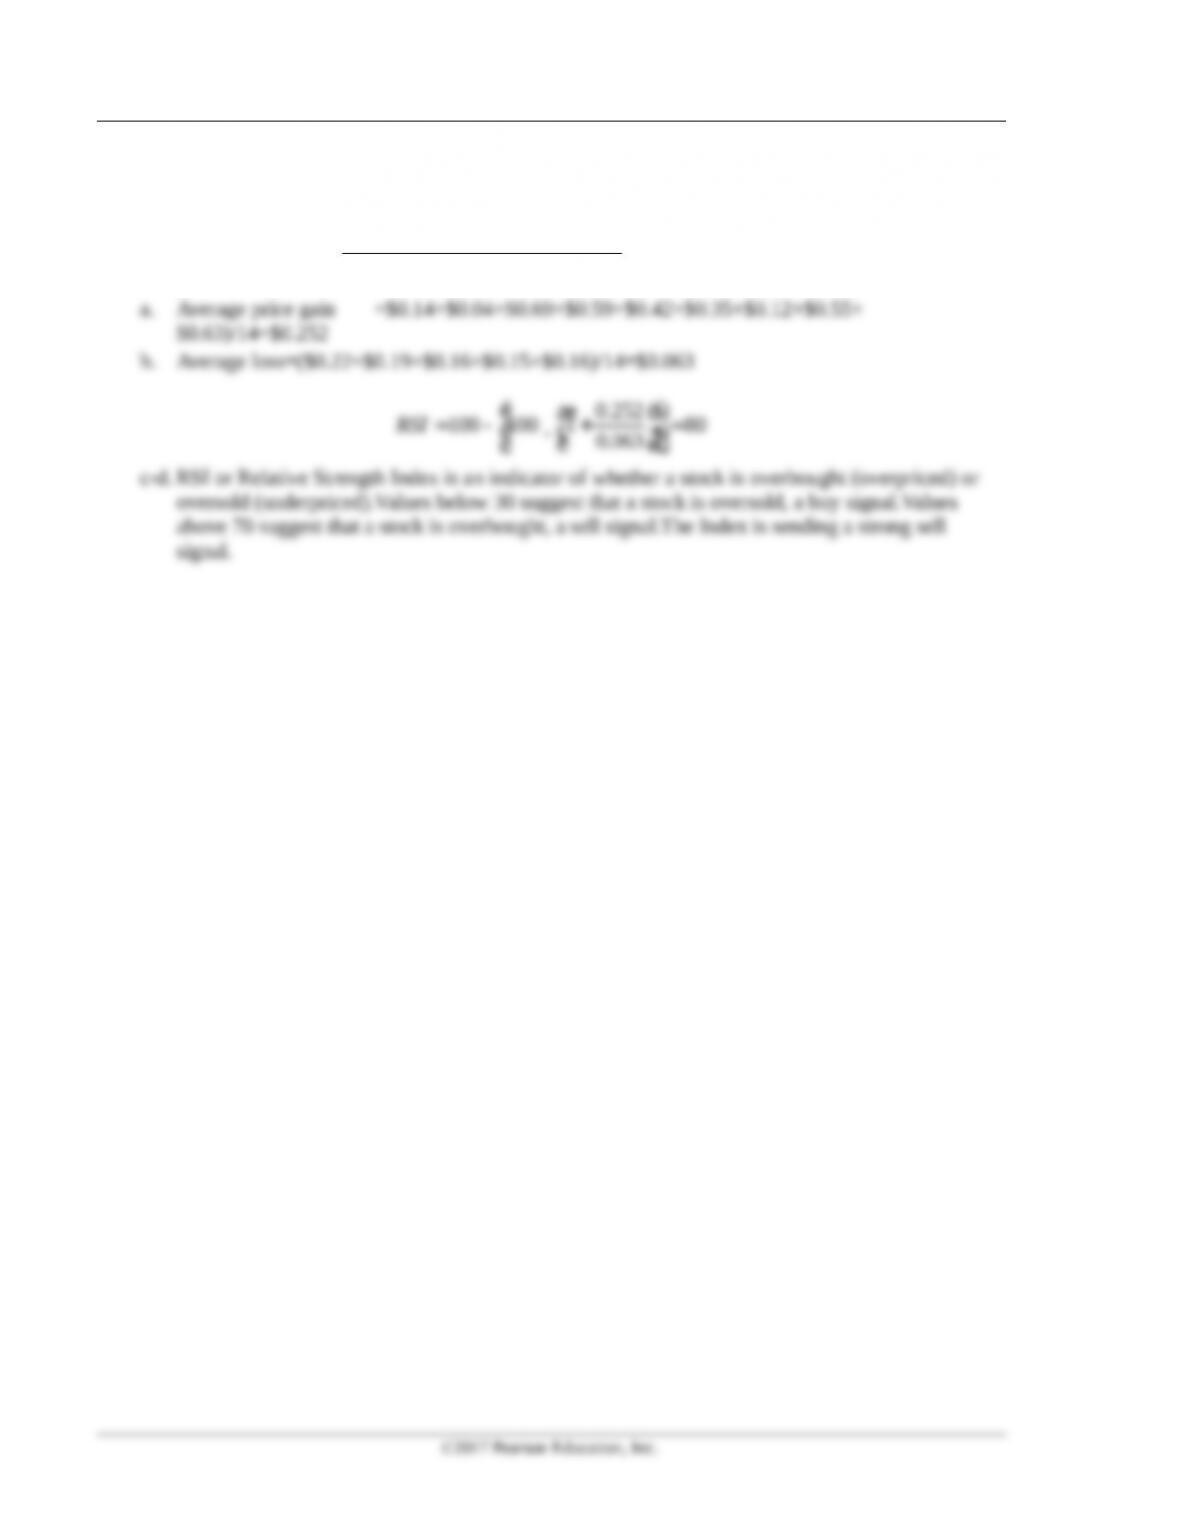
9.11
Avg. price change on up days
100 100 1 Avg. price change on down days
RSI é ù
æ ö
= – ¸ +
ê ú
ç ÷
è ø
ë û
0.252
100 100 1 80
0.063
RSI é ù
æ ö
= – ¸ + =
ç ÷
ê ú
è ø
ë û
c-d. RSI or Relative Strength Index is an indicator of whether a stock is overbought (overpriced) or
©2017 Pearson Education, Inc.