Chapter 2 Securities Markets and Transactions 15
Suggested Answers to Critical Thinking Question
Cooking the Books: What Were They Thinking?
Will this regulation be able to eliminate conflict of interest? Discuss.
Answer:In the wake of current accounting scandals, separation of internal and external audits and
auditor independence have been the focus of the Sarbanes-Oxley Act of 2002 and subsequent
The external audit, on the other hand, should give an independent review that the numbers in the
accounts, as reported to the shareholders, are a reasonable picture of how the company is doing
Suggested Answers to Discussion Questions
7.1 a. Fiscal policy would usually remain fairly strict during a strong economy with automatic
stabilizers, such as taxes and transfer payments, restraining inflation.
7.2 a. Airline stock: revenue growth, operational efficiency, fuel prices, and employment
b. A cyclical stock: current business cycle, future predictions of economic activity, how a particular
7.3 a. 2. Activity ratios
©2017 Pearson Education, Inc.
16 Smart/Gitman/Joehnk • Fundamentals of Investing, Thirteenth Edition
e. 1. Profitability
f. 2. Activity
Solutions to Problems
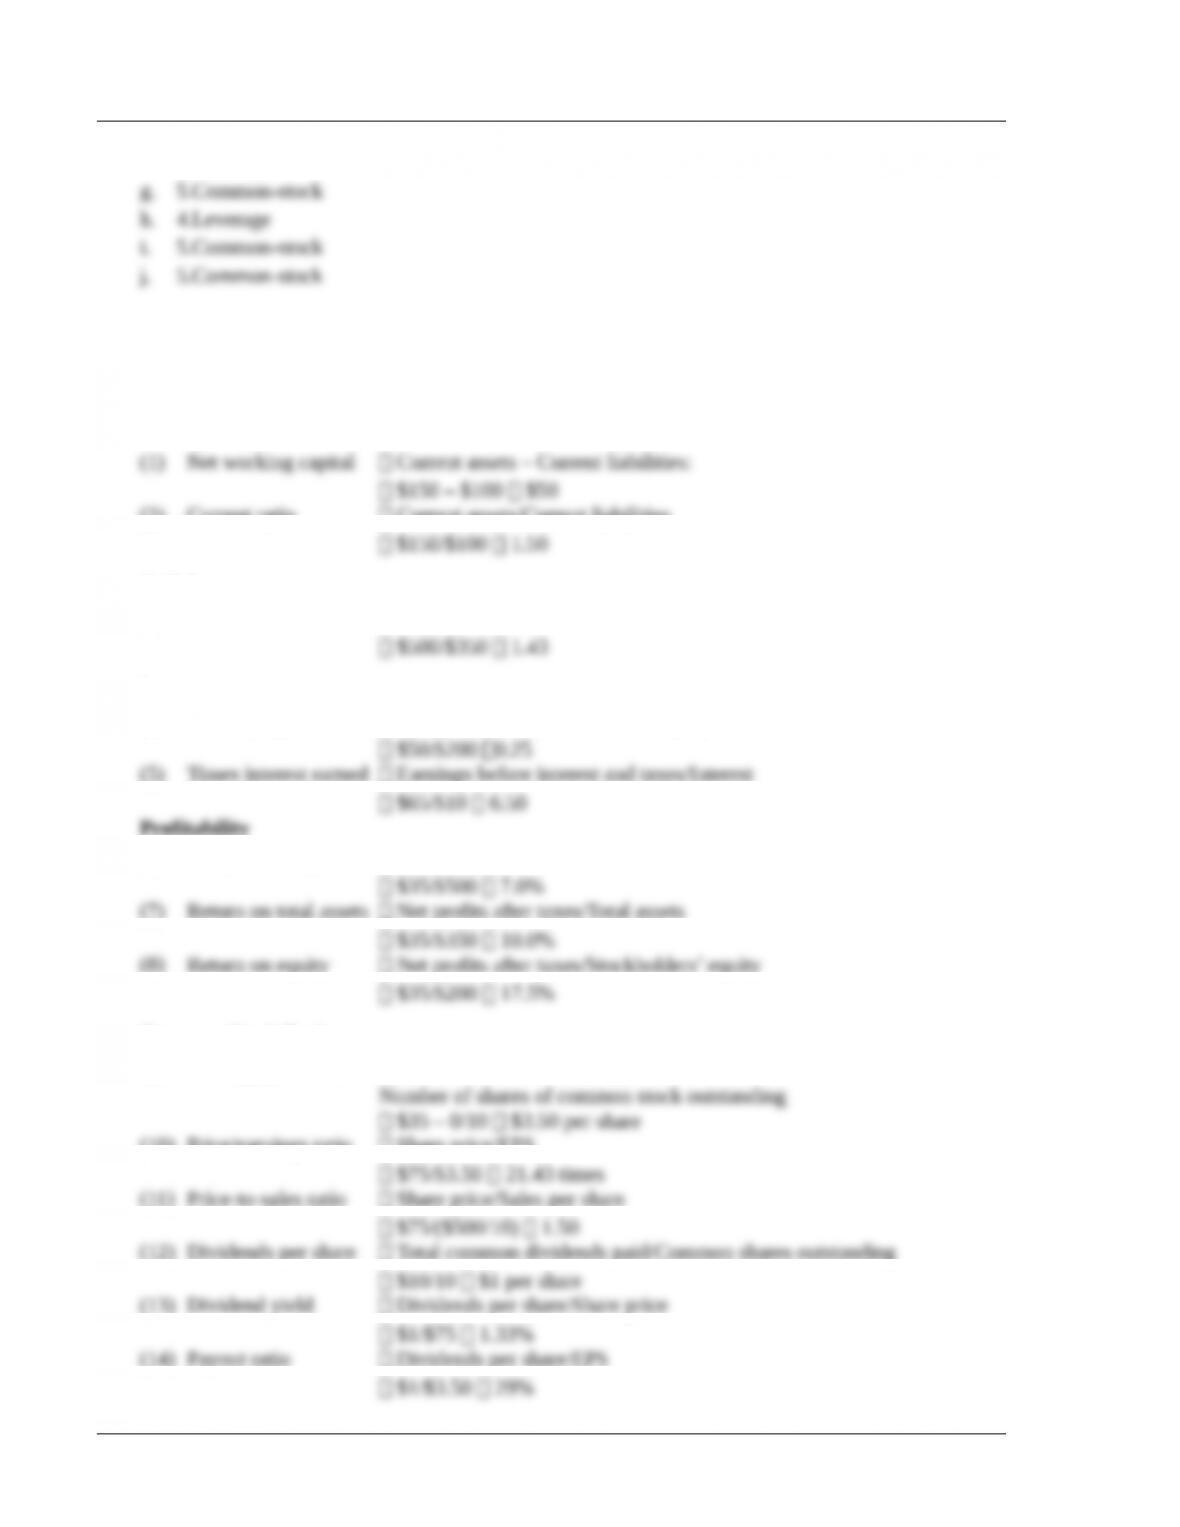
7.1 From abbreviated financial statements (dollars in millions):
Liquidity
(2) Current ratio Current assets/Current liabilities
Activity
(3) Total asset turnover Sales/Total assets
Leverage
(4) Debt-equity ratio Long-term debt/Stockholders’ equity
(5) Times interest earned Earnings before interest and taxes/Interest
Profitability
(6) Net profit margin Net profits after taxes/Sales
(7) Return on total assets Net profits after taxes/Total assets
(8) Return on equity Net profits after taxes/Stockholders’ equity
Common Stock Ratios
(9) Earnings per share (Net profits after taxes – Preferred dividends)/
(10) Price/earnings ratio Share price/EPS
(11) Price-to-sales ratio Share price/Sales per share
(12) Dividends per share Total common dividends paid/Common shares outstanding
(13) Dividend yield Dividends per share/Share price
(14) Payout ratio Dividends per share/EPS
©2017 Pearson Education, Inc.
Chapter 2 Securities Markets and Transactions 17
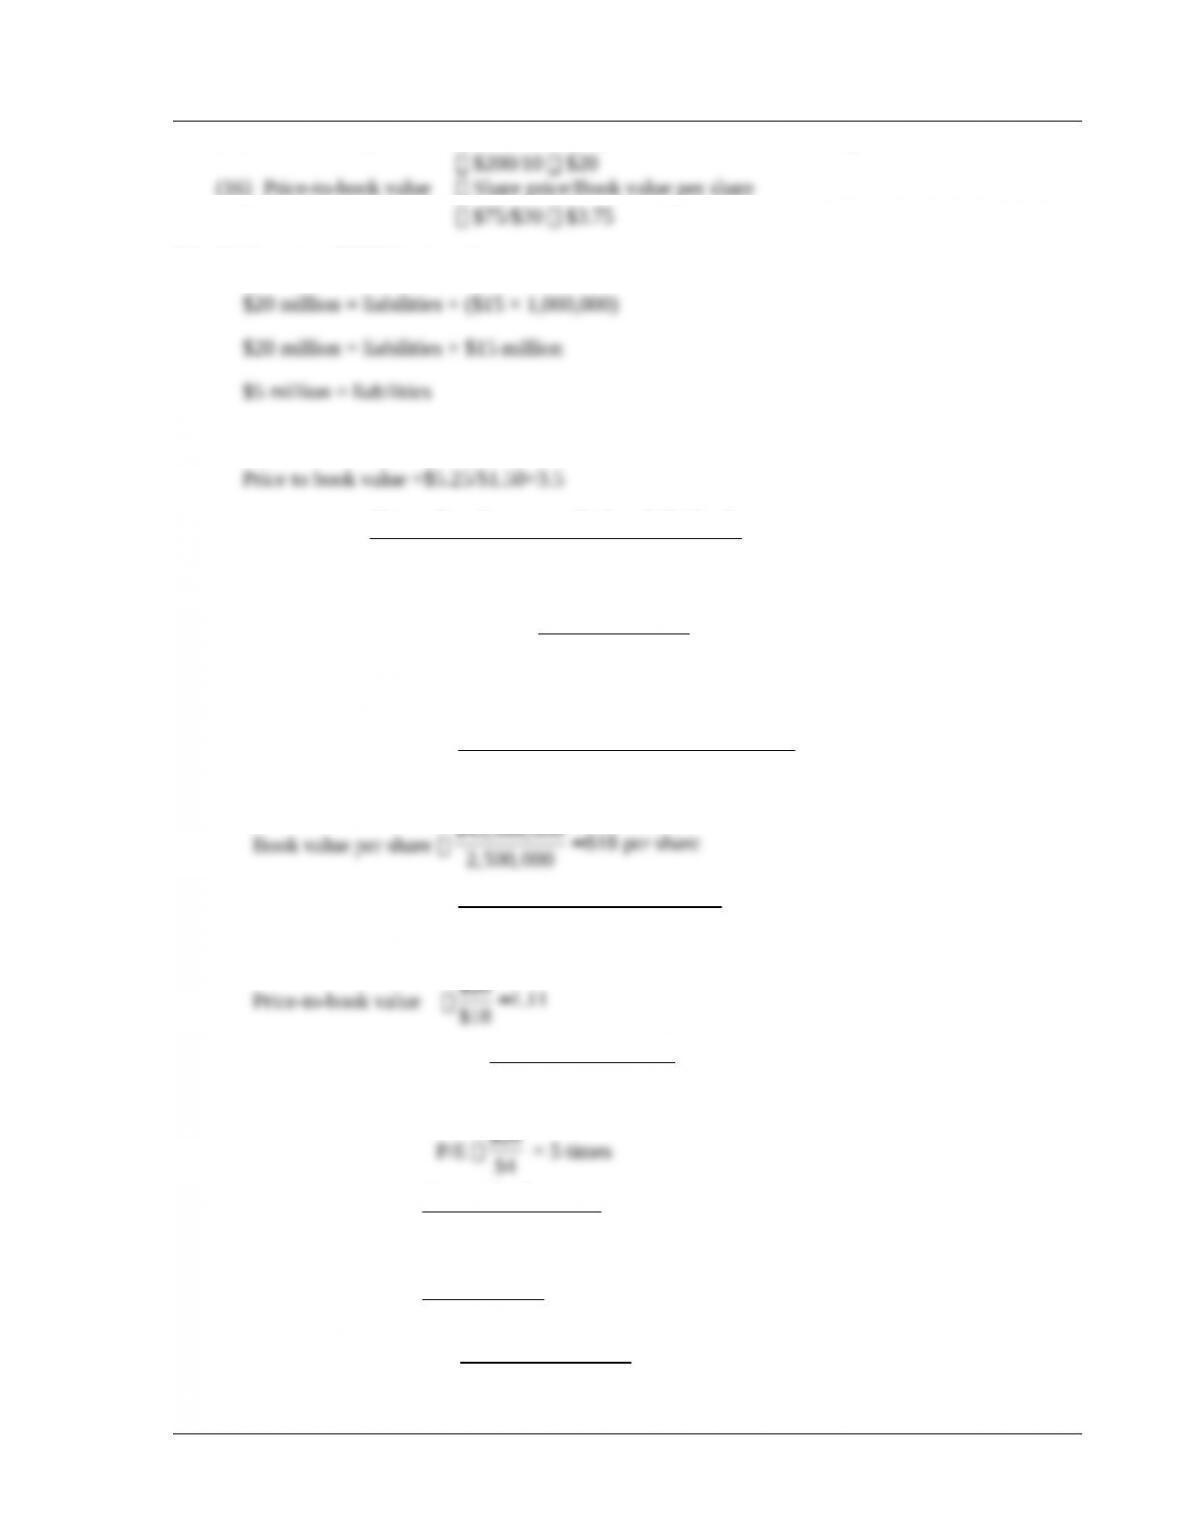
(15) Book value per share Common equity/Common shares outstanding
(16) Price-to-book value Share price/Book value per share
7.2 Total assets = liabilities + equity
7.3 Book value = ($750-$300)/300=$1.50
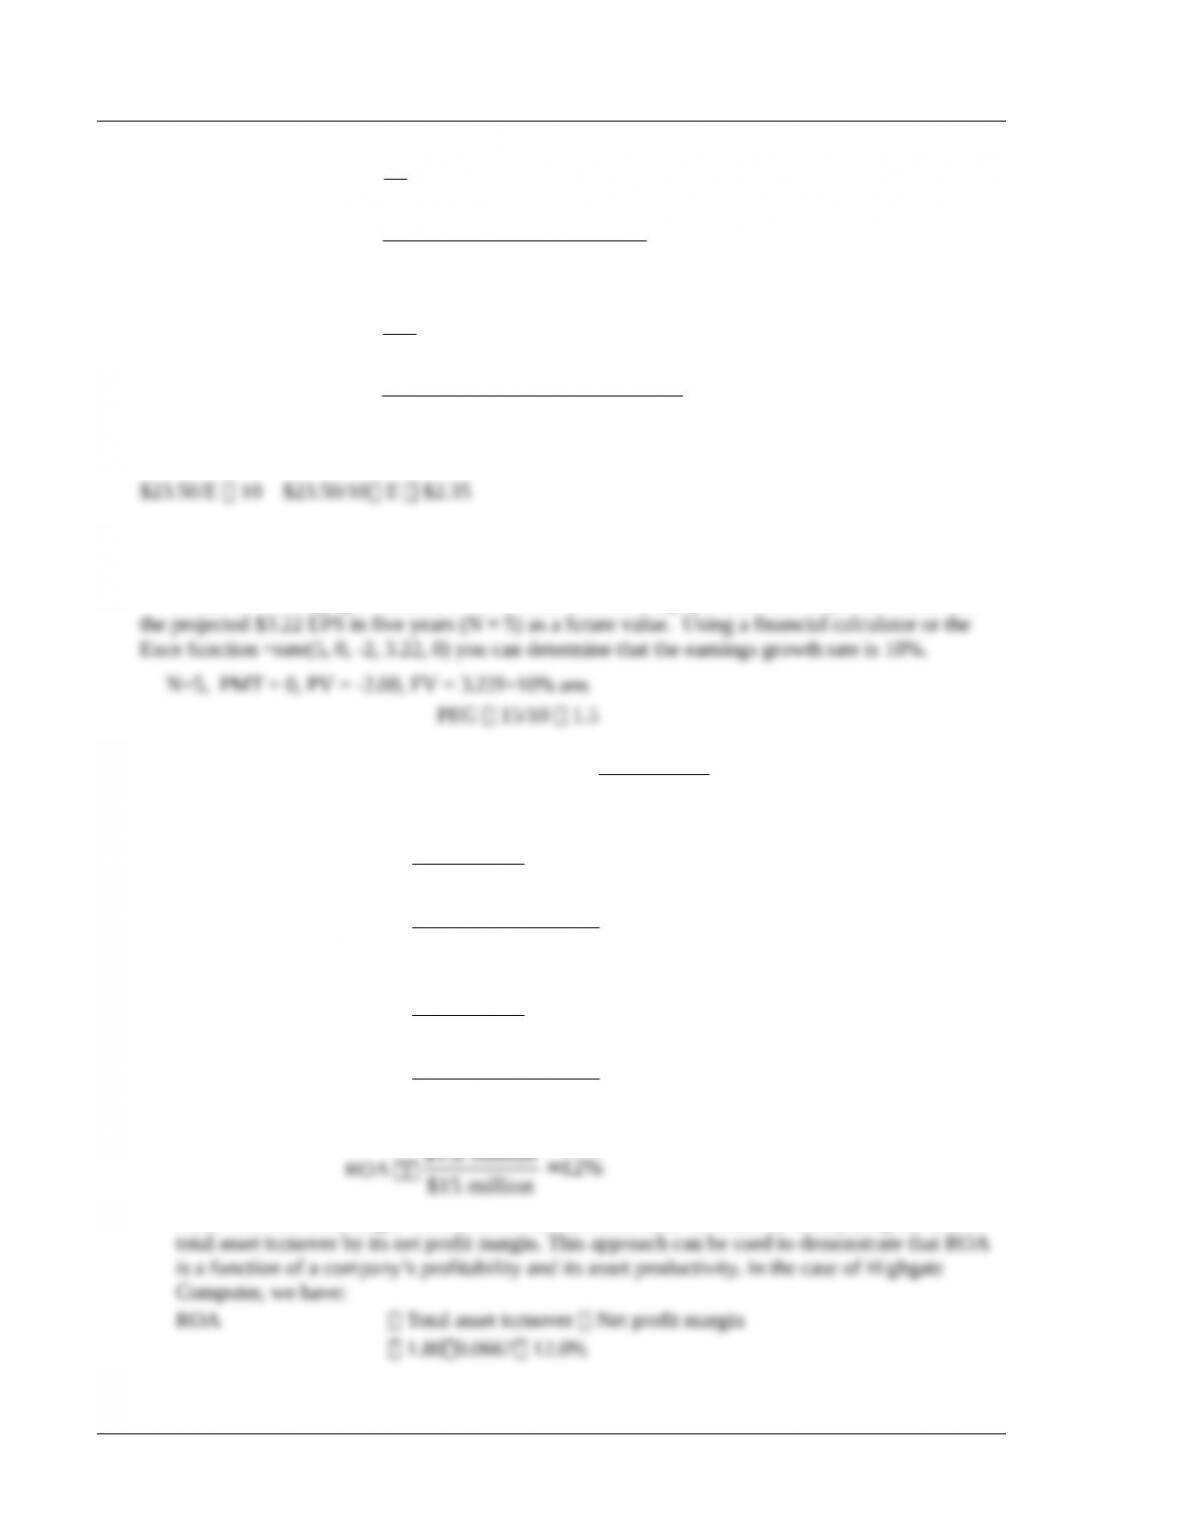
7.4 a. EPS
Net profits after taxes Preferred dividends
Number of common shares outstanding
–
For Amherst:
EPS
$10,000,000 $0 $4 per share
2,500,000
–=
Note: Only preferred dividends, zero here, are subtracted from net profits after taxes. Common
dividends are part of EPS.
b. Book value per share
Stockholders’ equity
Number of common shares outstanding
For Amherst:
$45,000,000 $18 per share
18 Smart/Gitman/Joehnk • Fundamentals of Investing, Thirteenth Edition
For Amherst:
Dividend payout ratio
$1 25%
$4 =
Dividend yield
Dividends per share
Market price of common stock
For Amherst:
Dividend yield
$1 5%
$20 =
f . PEG ratio
Stock’s P/E ratio 5/ 7.5 0.667
3 to 5 years growth rate in earnings = =
7.5 P/E 10 and P $23.50
$23.50/E 10 $23.50/10 E $2.35
7.6 PEG P/E (Earnings growth rate 100)
To find the earnings growth rate, treat the current $2 earnings per share as the present value and
7.7 a. Total asset turnover
Annual sales
Total assets
For Highgate Computer:
Total asset turnover
$27,000,000 1.80
$15,000,000 =
Net profit margin
Net profits after taxes
Annual sales
For Highgate Computer:
Net profit margin
$1,800,000 6.67%
$27,000,000 =
b. Return on assets (ROA)
Net profits after taxes
Total assets
For Highgate Computer:
$1.8 million 12%
Chapter 2 Securities Markets and Transactions 19
Return on equity (ROE)
Net profits after taxes
Stockholders’ equity
For Highgate Computer:
$1,800,000 30%
20 Smart/Gitman/Joehnk • Fundamentals of Investing, Thirteenth Edition
Market price of stock
25 $3.75
Market price of stock $93.75
=
=
d. Both the EPS and P/E drop—to $1.50 and 10 times earnings:
Market price of stock
10 $1.50
Market price of stock $15.00
=
=
e. As shown in the case of Financial Learning Systems, higher earnings improve the stock price for
7.10 We will use the following three ratios:
Return on assets Net profit after taxes/Total assets
Net profit margin Net profit after taxes/Sales
Total asset turnover Sales/Total assets
a. In this problem the most obvious way to calculate ROA is to begin by calculating profits. To do
this, we must determine sales and then apply the net profit margin to this sales figure to
Using the equation for net profit margin, net profits after taxes must be $3,696,000:
0.14 Net profits after taxes/$26.4 million
Note: Or this problem can also be solved by simply multiplying the company’s asset turnover by
its profit margin; i.e., 2.20.14 30.8%.
b. To solve this part of the problem, first find the firm’s equity. We know it has $12 million in
assets, and the problem states that 40% of the assets are financed with equity. Therefore:
Now to find ROE:
ROE
Net Profits $3,696,000
77%
Equity $4,800, 000
= =
Note: Comparing ROE to ROA, we see that ROE is much larger (77% versus 30.8%). The reason
7.11 Price/earnings (P/E) ratio
Market price of the stock
EPS
First, find EPS:
Net profit after taxes
EPS Number of shares of stock outstanding
=
©2017 Pearson Education, Inc.
Chapter 2 Securities Markets and Transactions 21
Since Net profit after taxes Sales Net profit margin:
$150,000,000 .10 $15,000,000
EPS $3 per share
5,000,000 5,000,000
$25
P/E ratio 8.3 times
$3
Market price of stock
Price-to-sales ratio Sales per share
´
= = =
= =
=
Find sales per share:
Sales $150,000,000
SPS Number of shares outstanding 5,000,000
$30 per share
= =
=
Now the price-sales ratio is:
$25
PSR 0.833
$30
Dividends per share EPS Dividend payout ratio*
Dividend yield Market price of common Market price of common
$3 0.35 $1.05 4.2%
$25 $25
= =
´
= =
´= =
*Note: Dividends per share EPS Dividend payout ratio
PEG ratio
Stock’s P/E ratio
3 to 5 years growth rate in earnings
This implies: Growth
Stock’s P/E Ratio
PEG Ratio
Growth 8.3/2 4.15%
7.12 Asset turnover = sales/assets = 3.0
Net profit margin = net income / sales = 0.09
7.13 Return on equity = net income / equity
We know that equity is $120 million, so we need to calculate net income.
If the firm has asset turnover of 2.4 and total assets of $225 million, then sales are $540 million
We could also use the relationship ROE=Profit margin × Total asset turnover × Assets/Equity
7.14 Sales: Total asset turnover × Assets
Total asset turnover 2 and total assets $1B
22 Smart/Gitman/Joehnk • Fundamentals of Investing, Thirteenth Edition
7.15 There is no set solution to this problem because the answer will vary with the stock selected by the
student. The students should be encouraged (or required) to actually compute the requested ratios
This problem may result in some interesting and possibly confusing responses because students
will get their information from many diverse sources. Frequently, the ratio calculations will differ.
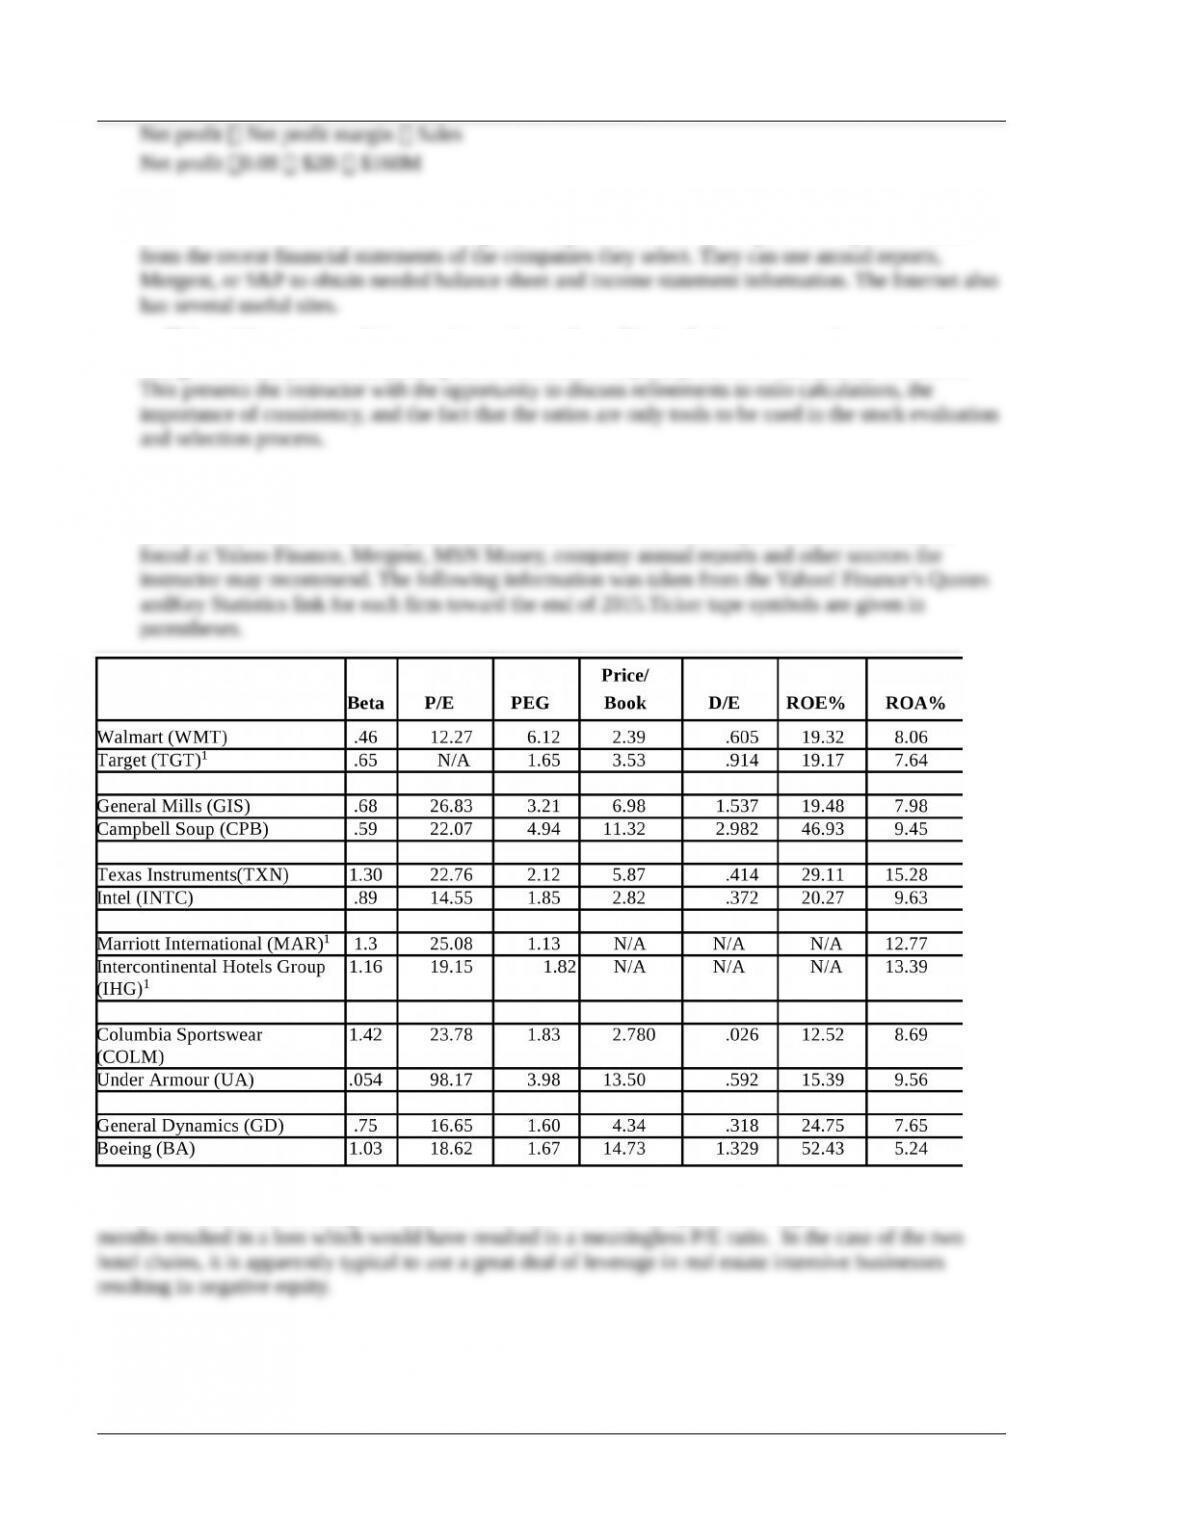
7.16 There is no set solution to this problem. In developing an answer, the students can either look up the
ratios/information or they can be required to actually compute requested ratios from the recent
financial statements of the companies they select. In either case, the required information can be
1N/A often indicates that a negative number was involved in the computation. Targets most recent 12
©2017 Pearson Education, Inc.
Chapter 2 Securities Markets and Transactions 23
Sample analysis: Comparing General Dynamics and Boeing we see that Boeing has a higher beta meaning
that it has a stronger response to changes in the market, up or down, than General Dynamicsand may be
more risky. Boeings P/E and PEG ratios are higher indicating that investors place a higher value on
Boeing’s earnings, most likely because they expect more rapid growth in the future. Boeing’s Price/Book
©2017 Pearson Education, Inc.