Chapter 2 Securities Markets and Transactions 15
Solutions to Problems
5.1
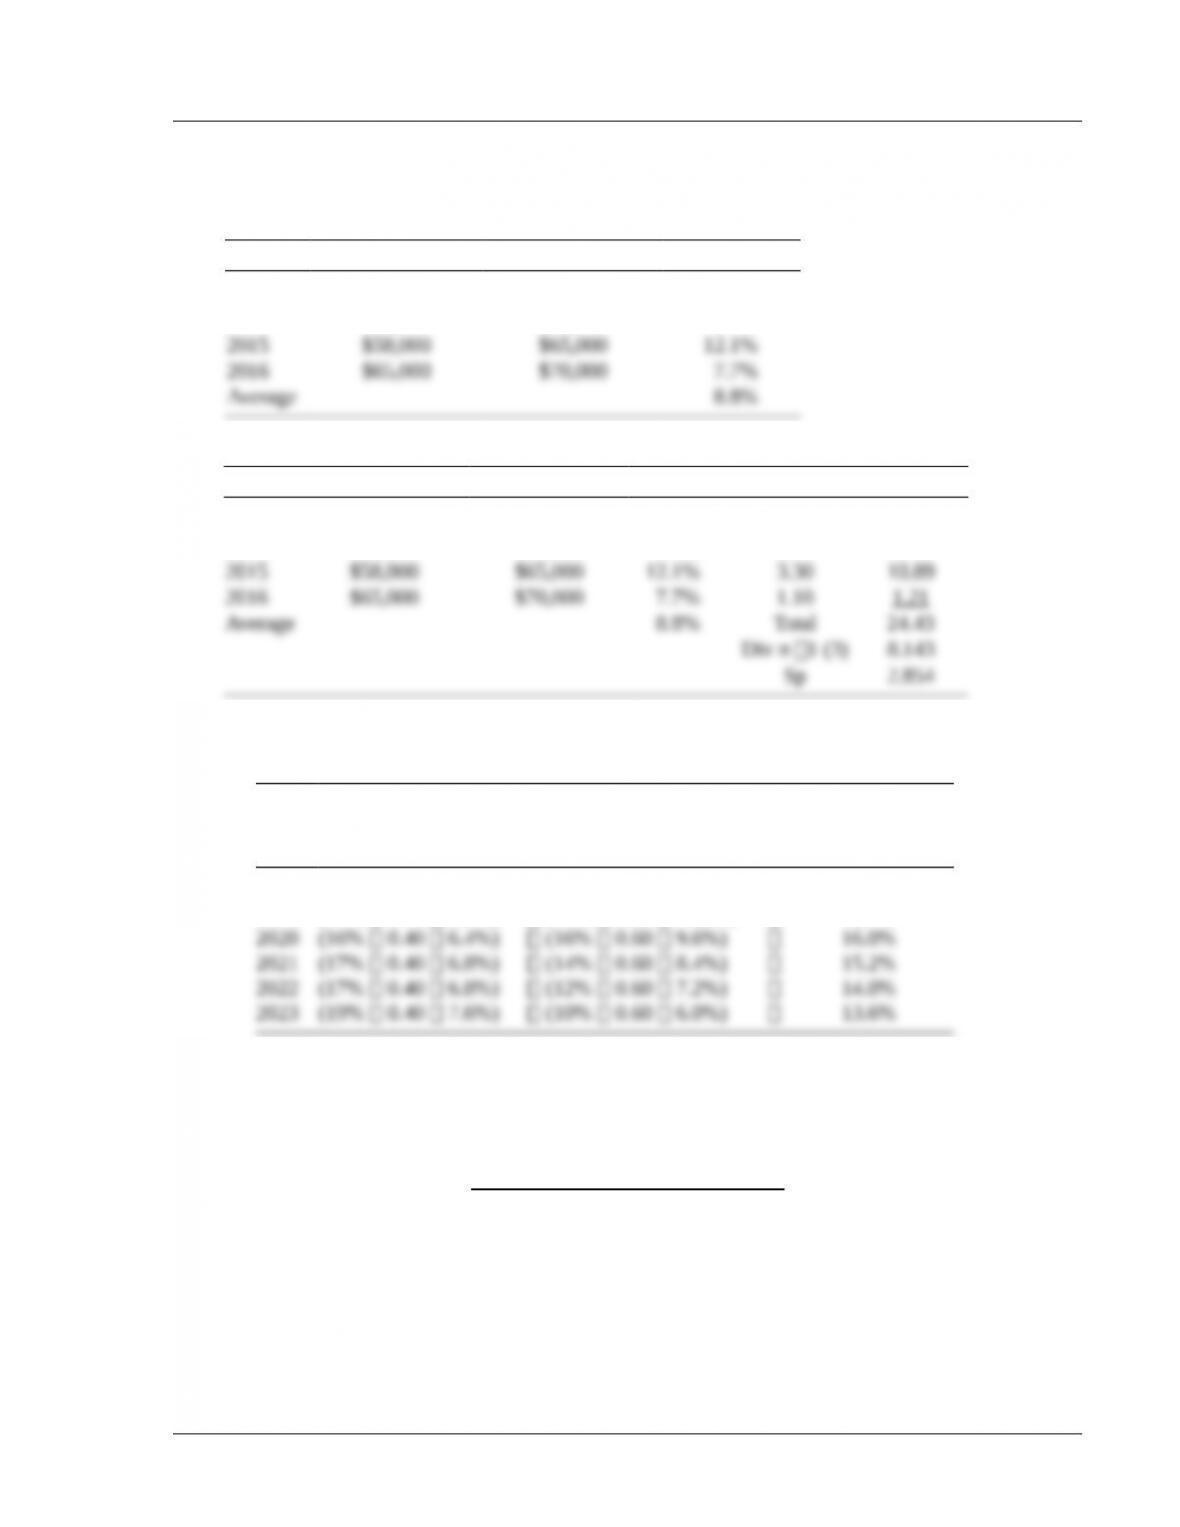
Beginning Value Ending Value Return %
2013 $50,000 $55,000 10.0%
2014 $55,000 $58,000 5.5%
5.2
Beginning Value Ending Value Return % Difference Squared
2013 $50,000 $55,000 10.0% 1.20 1.44
2014 $55,000 $58,000 5.5% 3.30 10.89
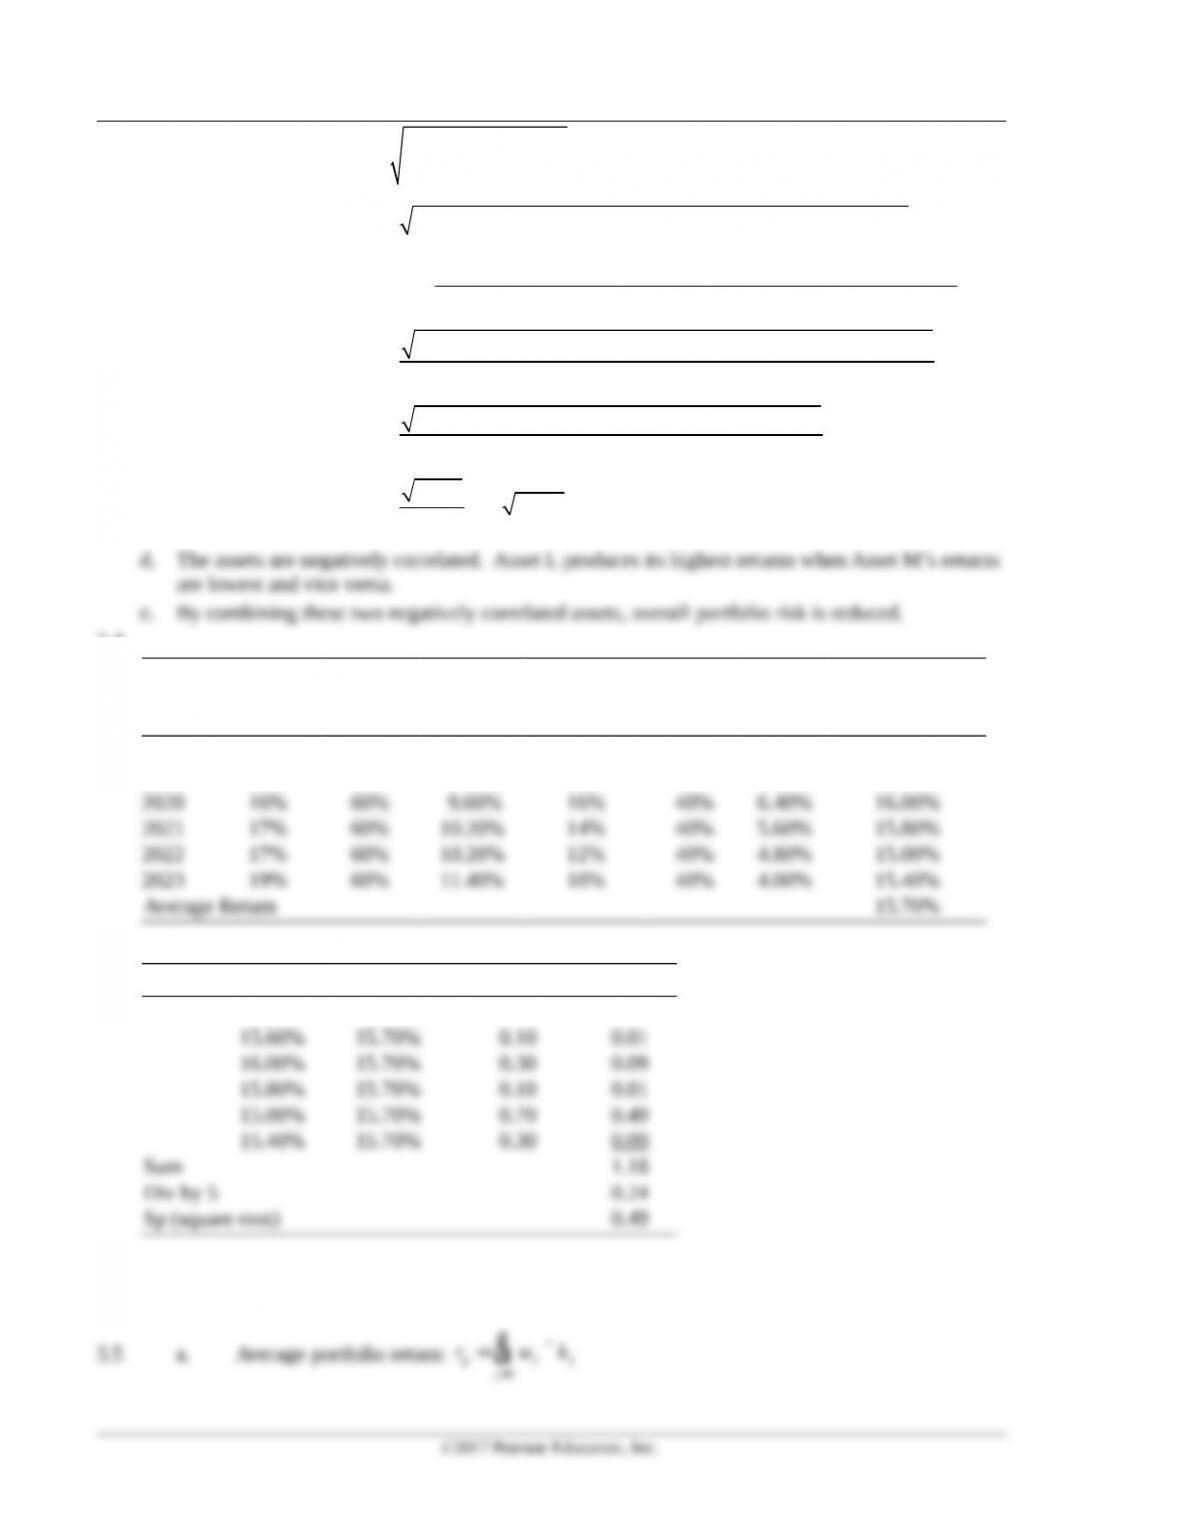
5.3 a. Average portfolio return for each year: rp (wL rL) (wM rM )
Year
Asset L
(wL rL)
Asset M
(wM rM)
Expected
Portfolio Return
rp
2018 (14% 0.40 5.6%) (20% 0.60 12.0%) 17.6%
2019 (14% 0.40 5.6%) (18% 0.60 10.8%) 16.4%
b. Portfolio return:
=
æ ö
= ´ ¸
ç ÷
è ø
+++++
= =
å
1
17.6 16.4 16.0 15.2 14.0 13.6 15.467
6
n
j
j
j
p
r w r n
r
p
©2017 Pearson Education, Inc.
16 Smart/Gitman/Joehnk • Fundamentals of Investing, Thirteenth Edition
c. Standard deviation:
p p
i=1
s (r= – ¸ –
å2
) ( 1)
n
r n
2 2 2
222
2 2 2 2 2 2
[(17.6% 15.5%) (16.4% 15.5%) (16.0% 15.5%)
[(15.2% 15.5%) (14.0% 15.5%) (13.6% 15.5%) ]
6 1
[(2.1%) (.9%) (.5%) ( .3%) ( 1.5%) ( 1.9%) ]
5
(4.41% .81% .25% .09% 2.25% 3.61%)
5
11.42
5
p
p
p
p
s
s
s
s
= – + – + –
+ – + – + –
–
+ + + – + – + –
=
+ + + + +
=
= = 2.284 1.511=
d. The assets are negatively correlated. Asset L produces its highest returns when Asset M’s returns
are lowest and vice versa.
e. By combining these two negatively correlated assets, overall portfolio risk is reduced.
5.4
Asset LWeight W rAsset MWeight W r
Expected
Portfolio Return
rp
2018 14% 60% 8.40% 20% 40% 8.00% 16.40%
2019 14% 60% 8.40% 18% 40% 7.20% 15.60%
Return Avg. Return Difference Squared
16.40% 15.70% 0.70 0.49
The average return is almost the same in each case (15.47 versus 15.7), but the standard deviation is
much lower in this portfolio because less weight is given to the more variable asset.
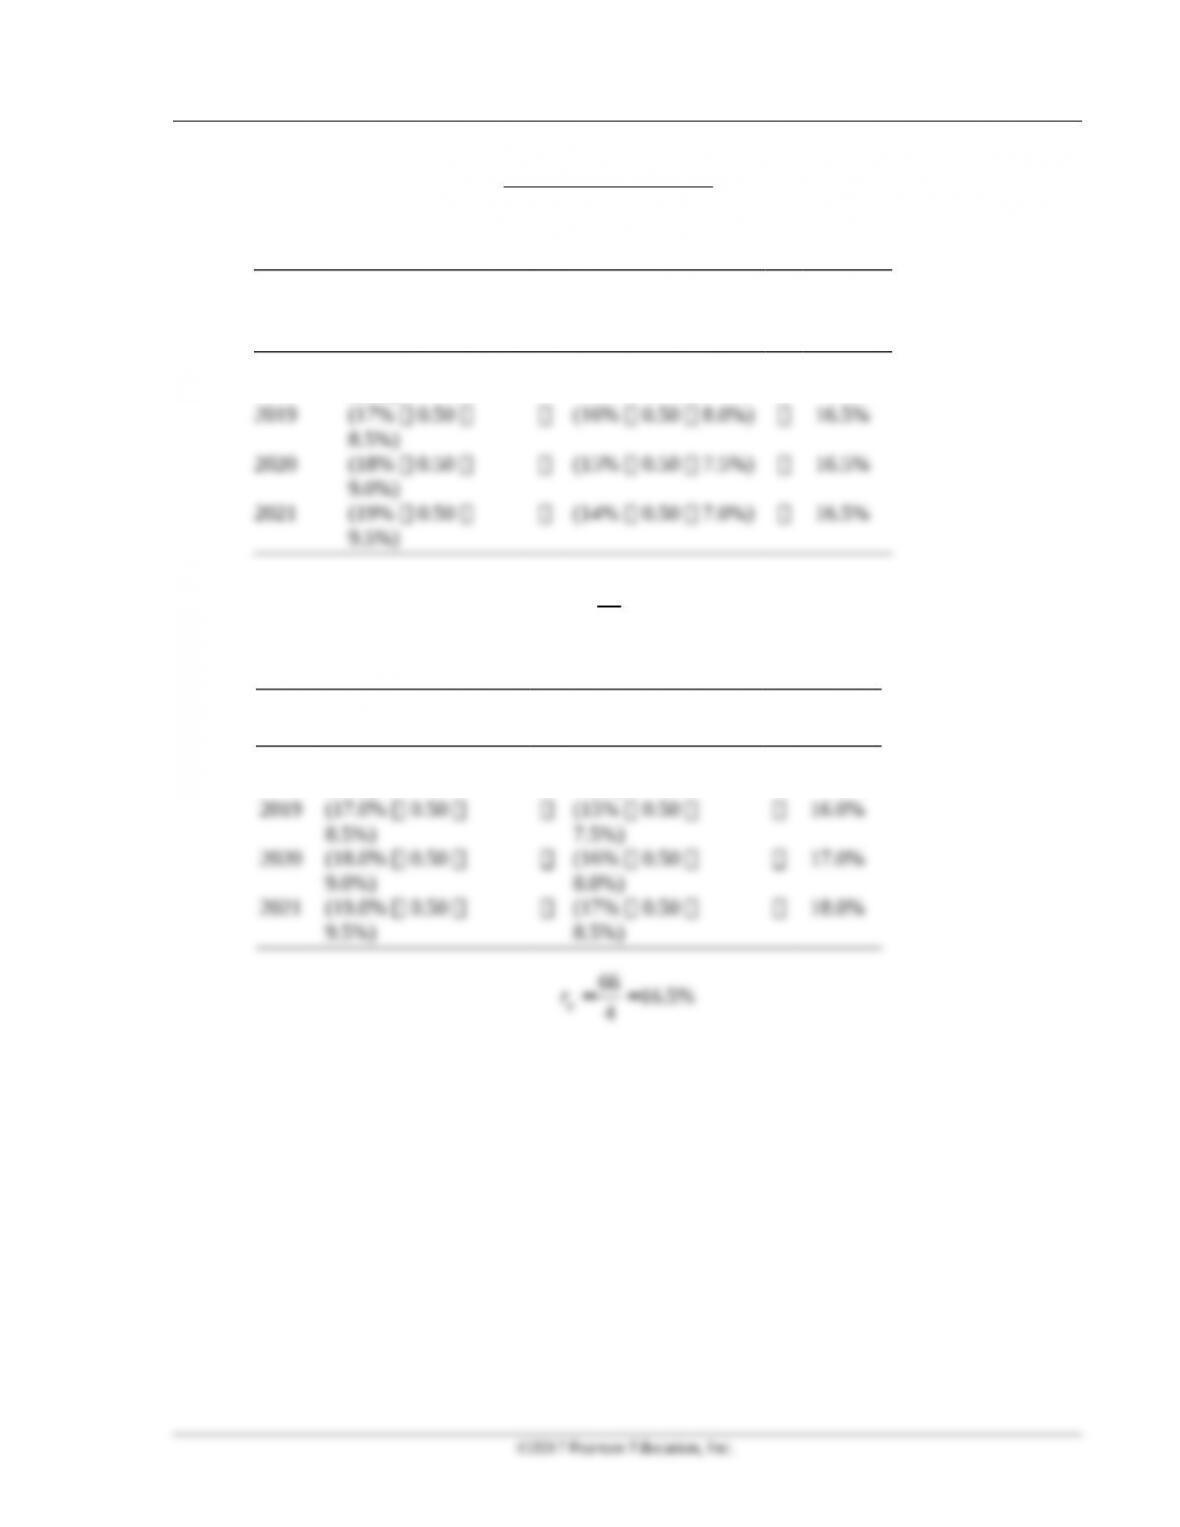
5.5 a. Average portfolio return:
n
p j j
j 1
r w k
=
= ´
å
©2017 Pearson Education, Inc.
Chapter 2 Securities Markets and Transactions 17
Alternative 1: 100% Asset F
+++
= =
16% 17% 18% 19% 17.5%
4
p
r
Alternative 2: 50% Asset F 50% Asset G
Year
Asset F
(wF rF)
Asset G
(wG rG)
Portfolio
Return
rp
2018 (16% 0.50
8.0%)
(17% 0.50 8.5%) 16.5%
= =
66 16.5%
4
p
r
Alternative 3: 50% Asset F 50% Asset H
Year
Asset F
(wF rF)
Asset H
(wH rH)
Portfolio
Return rp
2018 (16.0% 0.50
8.0%)
(14% 0.50
7.0%)
15.0%
9.5%)
8.5%)
= =
66 16.5%
4
p
r
©2017 Pearson Education, Inc.
18 Smart/Gitman/Joehnk • Fundamentals of Investing, Thirteenth Edition
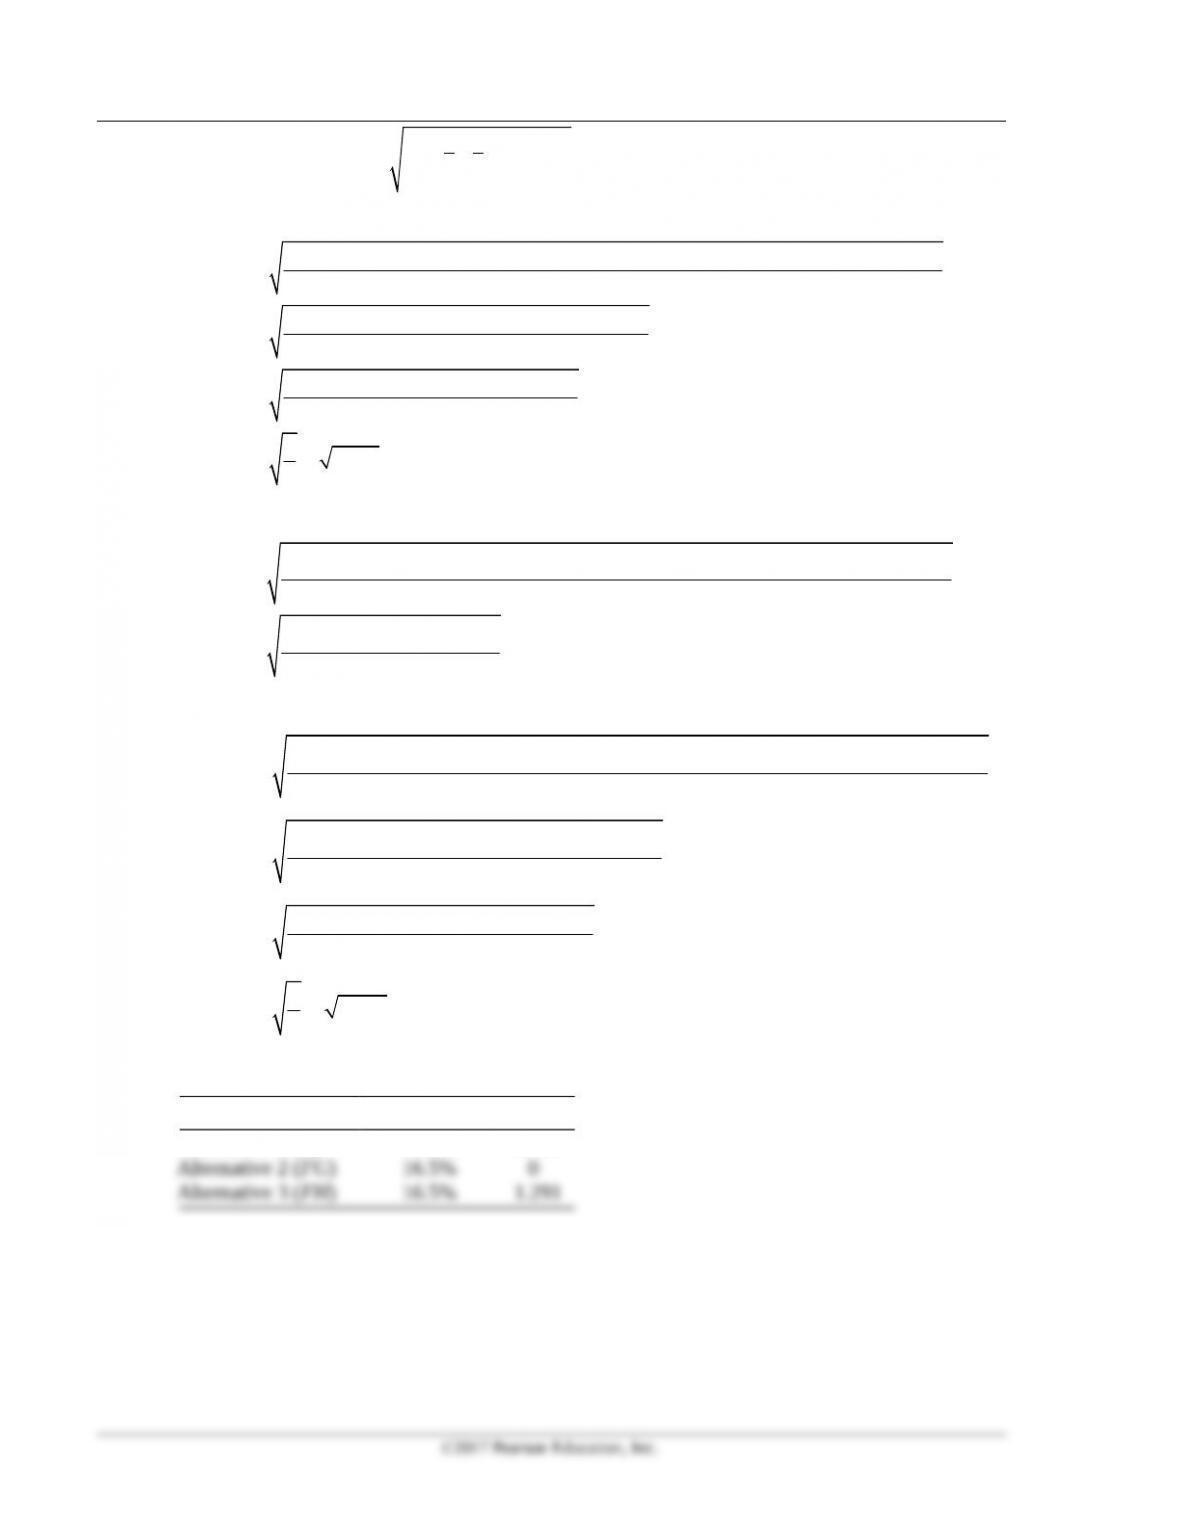
b. Standard deviation:
s
P=(r
i–r)2
i=1
n
å
æ
è
çö
ø
÷
¸(n–1)
(1)
2 2 2
2 2 2 2
[(16.0% 17.5%) + (17.0% 17.5%) (18.0% 17.5%) (19.0% 17.5%)]
4 1
[( 1.5%) + ( 0.5%) (0.5%) (1.5%) ]
3
(2.25% 0.25% 0.25% 2.25%)
3
51.667 1.291
F
F
F
F
s
s
s
s
– – + – + –
=–
– – + +
=
+ + +
=
= = =
3
(2)
2 2 2
2 2 2 2
(16.5% 16.5%) (16.5% 16.5%) (16.5% 16.5%) (16.5% 16.5%)
4 1
(0) (0) (0) (0) 0
3
FG
FG
s
s
é ù
– + – + – + –
ë û
=–
é ù
+++
ë û
= =
(3)
2 2 2 2
2 2 2 2
(15.0% 16.5%) (16.0% 16.5%) (17.0% 16.5%) (18.0% 16.5%)
4 1
( 1.5%) (0.5%) (0.5%) (1.5%)
3
(2.25% 0.25% 0.25% 2.25%)
3
51.667 1.291
3
FH
FH
SH
SH
s
s
s
s
é ù
– + – + – + –
ë û
=–
é ù
– + + +
ë û
=
+++
=
= = =
c. Summary: rp: Average
Portfolio Return rpsp
Alternative 1 (F) 17.5% 1.291
Alternative 2 (FG) 16.5% 0
Alternative 3 (FH) 16.5% 1.291
Chapter 2 Securities Markets and Transactions 19
Since the assets have different average returns, the standard deviation and the correlation patterns
should be used to determine the best portfolio. Alternative 3, the same risk as Alternative 1 and a
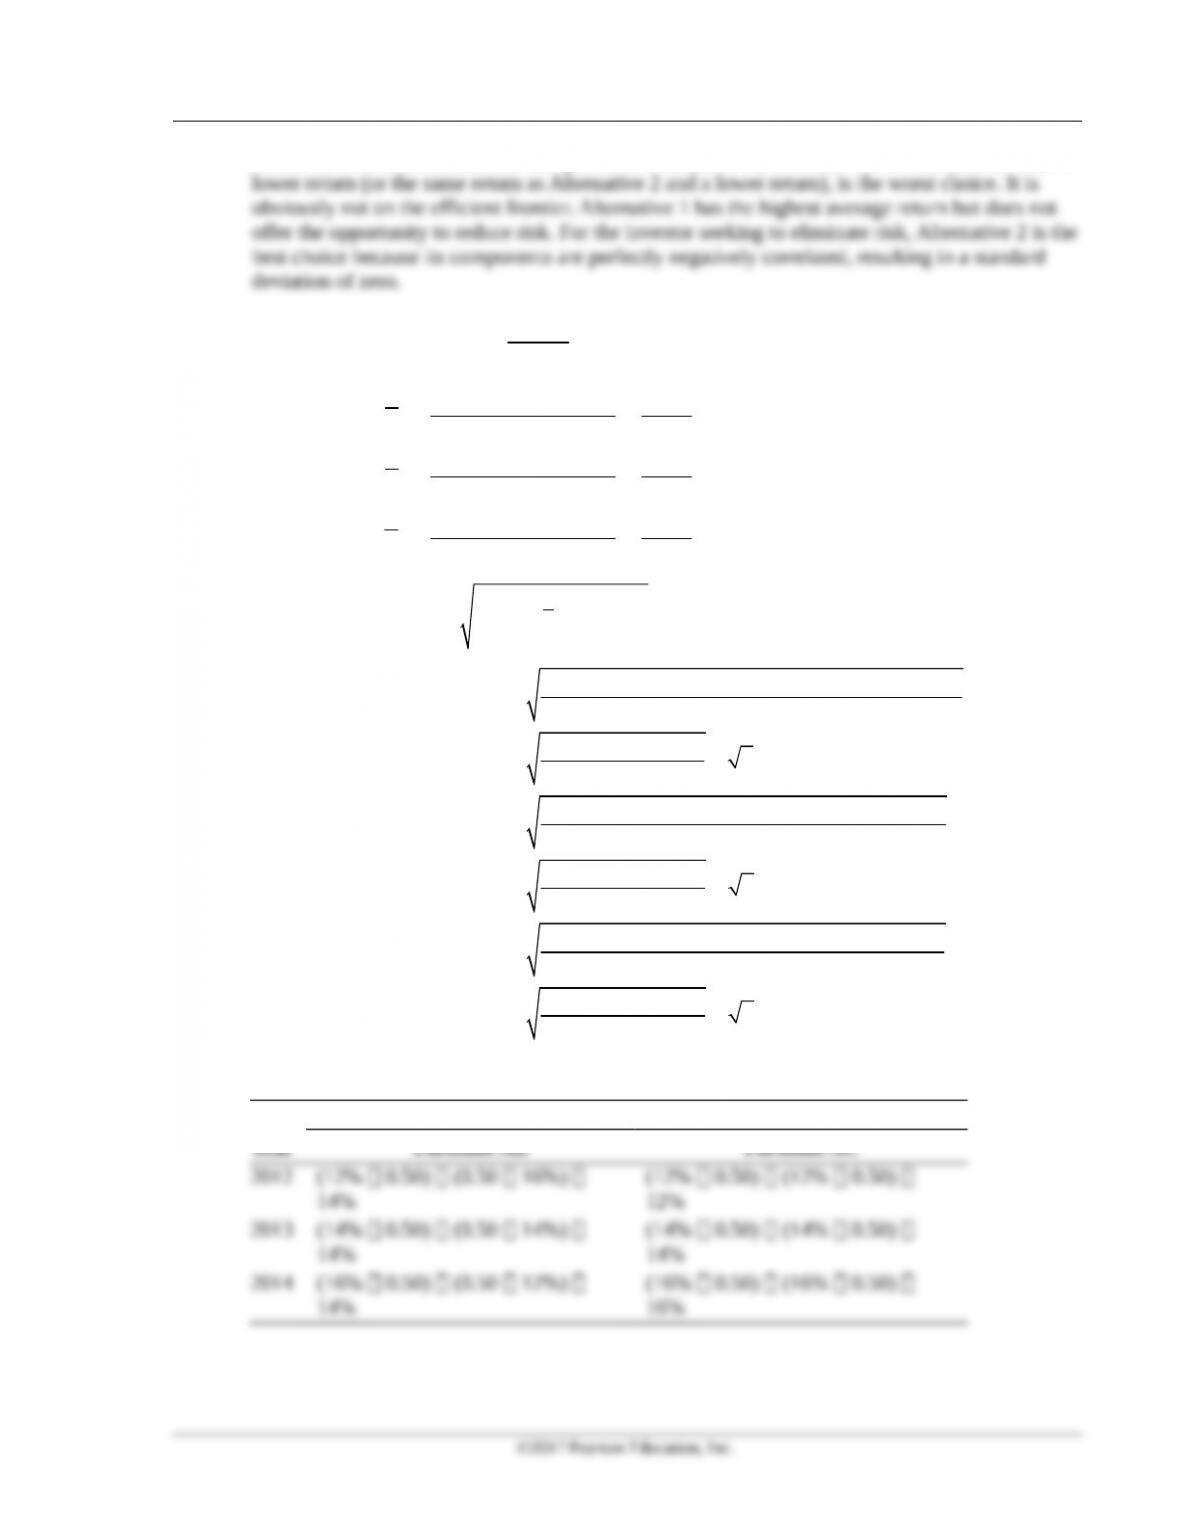
5.6 a. Average return:
returns
3
r=å
12% 14% 16% 42% 14%
3 3
16% 14% 12% 42% 14%
3 3
12% 14% 16% 42% 14%
3 3
A
B
C
r
r
r
+ +
= = =
+ +
= = =
+ +
= = =
b. Standard deviation:
s
i=(r
i–r)
i=1
n
å2
æ
è
çö
ø
÷
¸ (n– 1)
2 2 2
2 2 2
222
[(12.0% 14%) (14% 14%) (16% 14%) ]
3 1
[(4%) (0) (4%)] 4 = 2%
2
[(16% 14%) (14% 14%) (12% 14%) ]
3 1
[(4%) (0) (4%)] 4 2%
2
[(12% 14%) (14% 14%) (16% 14%) ]
3 1
[(4%) (0) (4%)] 4 2%
2
A
A
B
B
C
C
s
s
s
s
s
s
– + – + –
=–
+ +
= =
– + – + –
=–
+ +
= = =
– + – + –
=–
+ +
= = =
c.
Portfolio Return
Year Portfolio AB Portfolio AC
20 Smart/Gitman/Joehnk • Fundamentals of Investing, Thirteenth Edition
14% 14% 14% 42% 12% 14% 16% 42%
14% 14%
3 3 3 3
AB AC
r r
+ + + +
= = = = = =
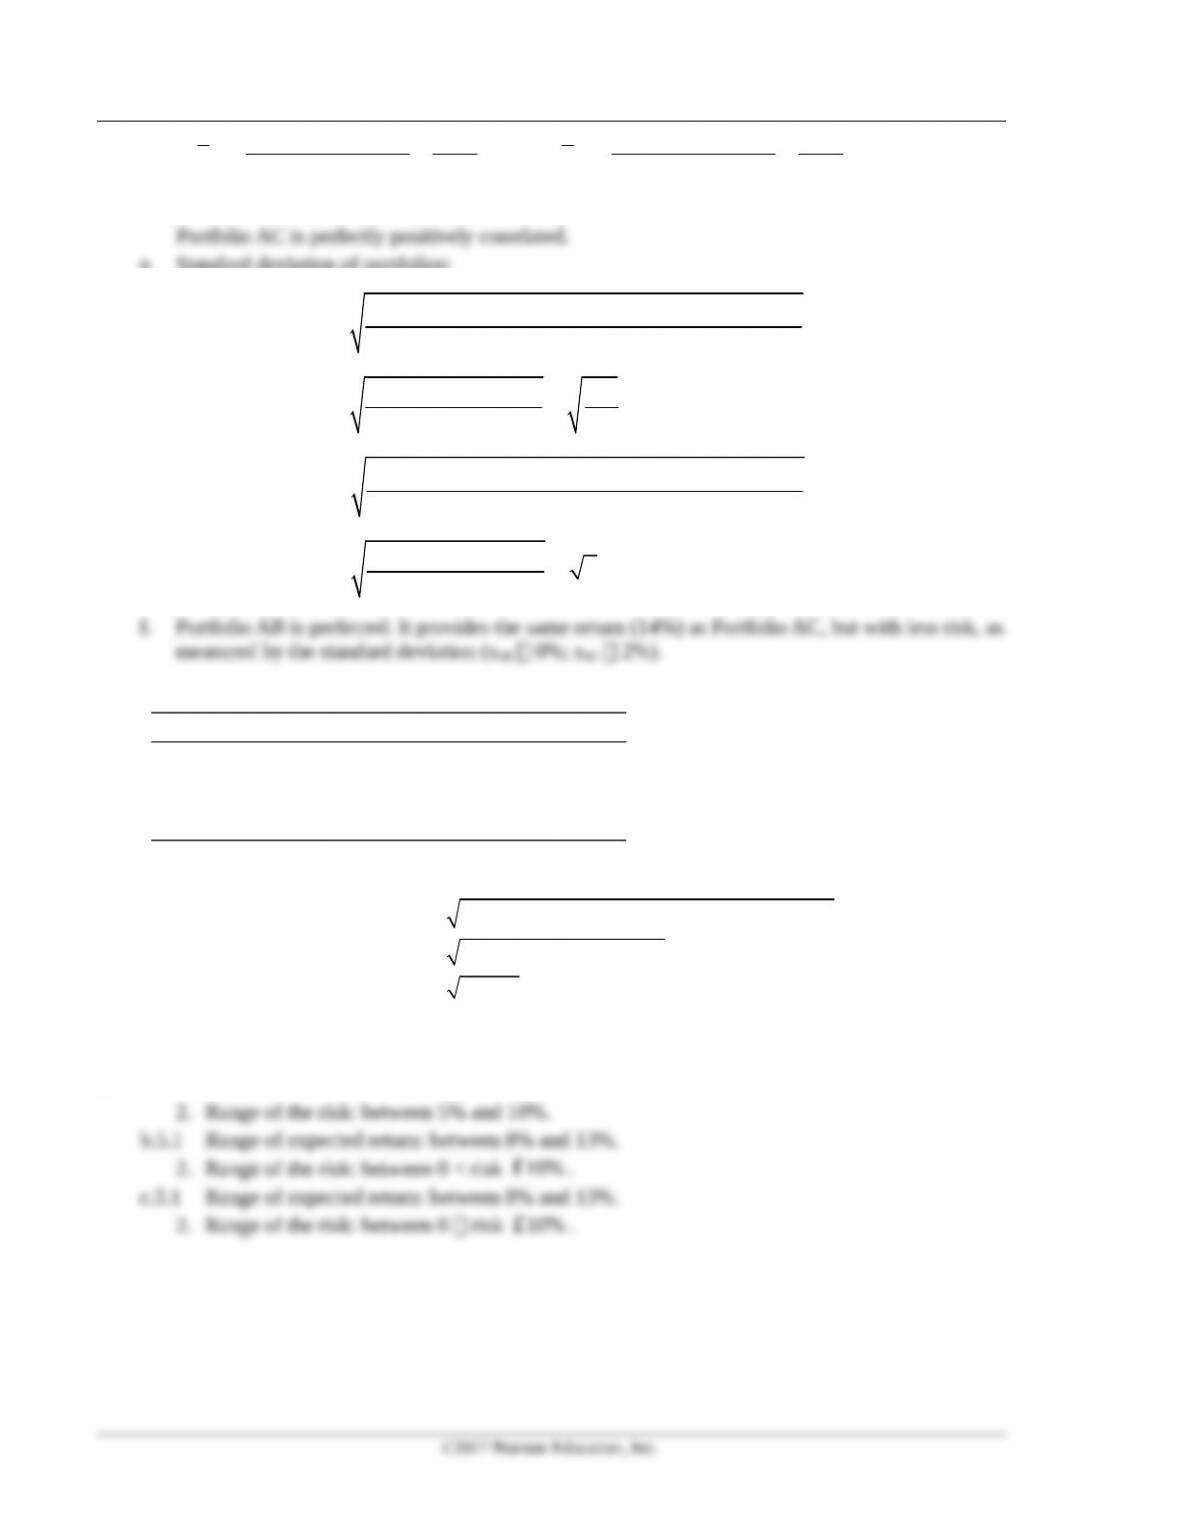
d. Portfolio AB is perfectly negatively correlated.
Portfolio AC is perfectly positively correlated.
e. Standard deviation of portfolios:
2 2 2
222
[(14% 14%) (14% 14%) (14% 14%) ]
3 1
[(0%) (0) (0%)] 0% 0%
2 2
[(12% 14%) (14% 14%) (16% 14%) ]
3 1
[(4%) (0) (4%)] 4 2%
2
AB
AB
AC
AC
s
s
s
s
– + – + –
=–
+ +
= = =
– + – + –
=–
+ +
= = =
5.7
2018 2019 2020
Asset A 12 14 16
Asset B 16 14 12
Asset C 12 14 16
Portfolio Return 13.33 14 14.67
2 2 2
Mean return 1/3 (13.33) 1/3(14) 1/3(14.67) 14%
Standard deviation [(13.33 14) (14 14) (14.67 14) ] / 2
[0.4489 0 0.4489] / 2
0.4489 0.67
= + + =
= – + – + –
= + +
= =
The return would be the same with slightly higher risk. This is because the assets are no longer
perfectly negatively correlated.
5.8 a.5.1 Range of expected return: between 8% and 13%.
Chapter 2 Securities Markets and Transactions 21
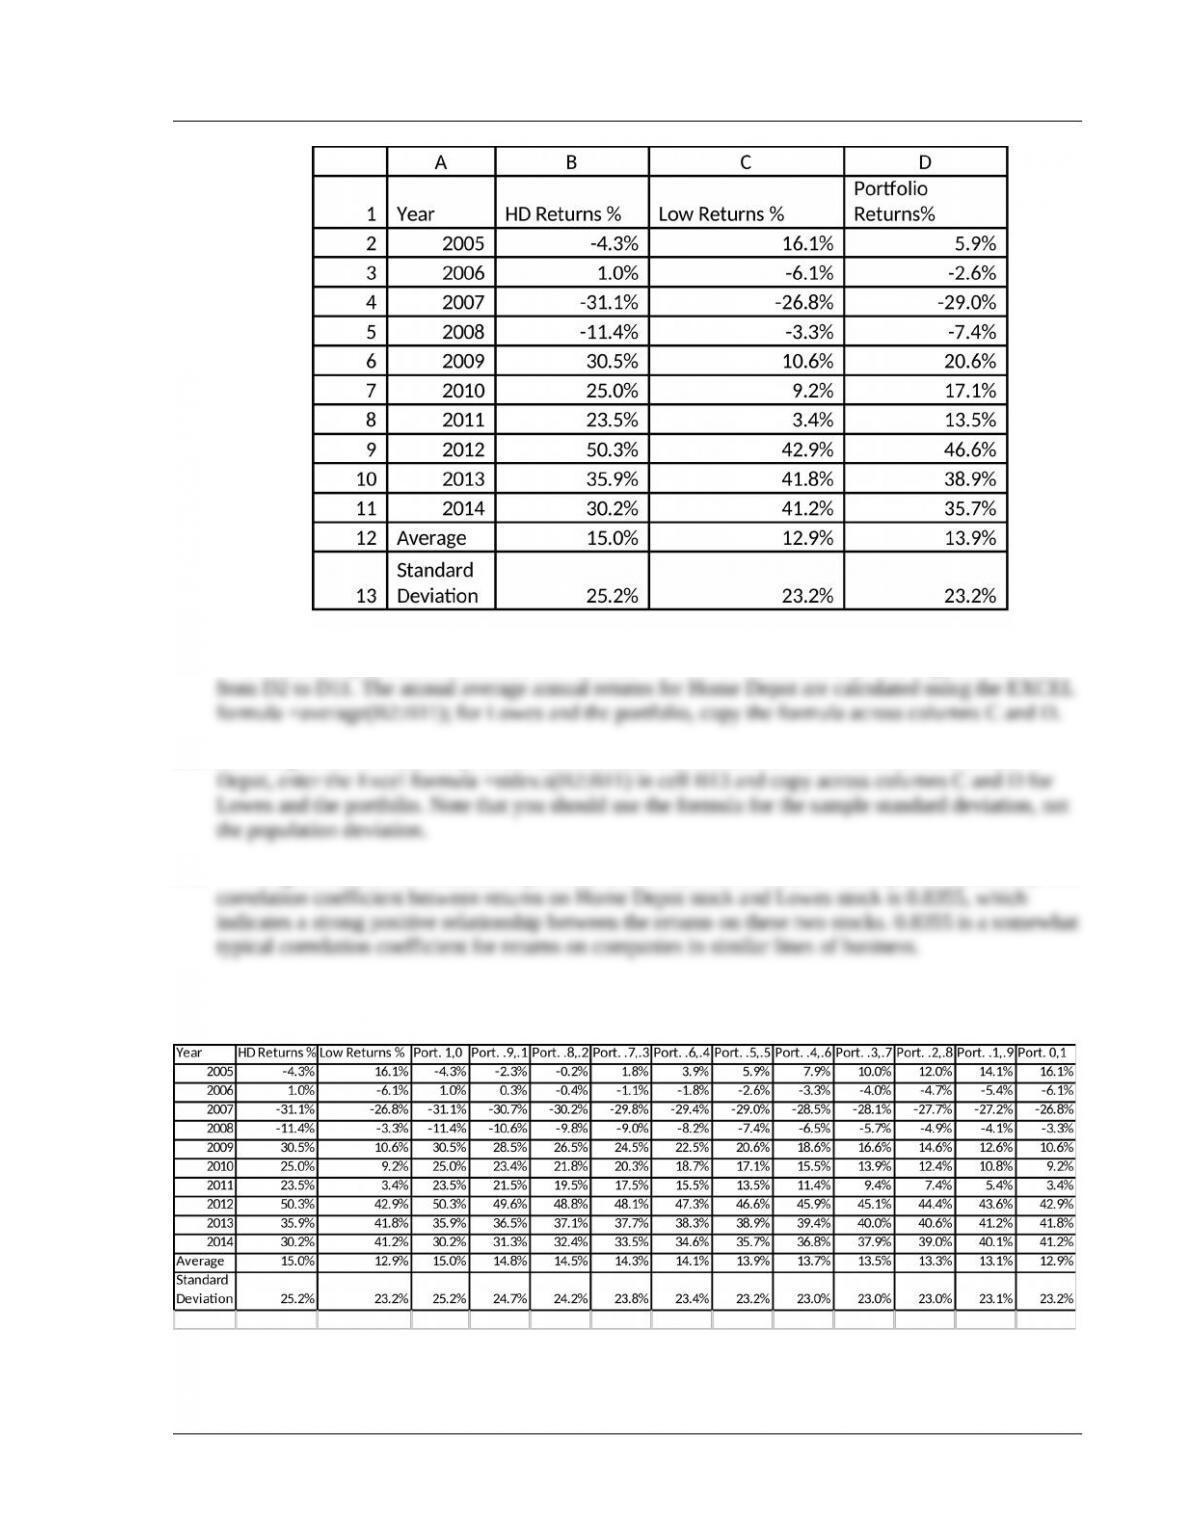
5.9
To calculate portfolio returns enter the formula =.5*B2+.5*C2 in cell D2, then copy the formula
5.10 Referring to the solution for problem 9, to calculate the standard deviation of returns for Home
5.11 Using the table in the solution to problem 9, enter the Excel formula =correl(B2:B11,C2:C11). The
5.12 Efficient portfolios start at approximately 0.6 HD and 0.4 L and proceed rightward through an all
Lowes portfolio
5.13
©2017 Pearson Education, Inc.
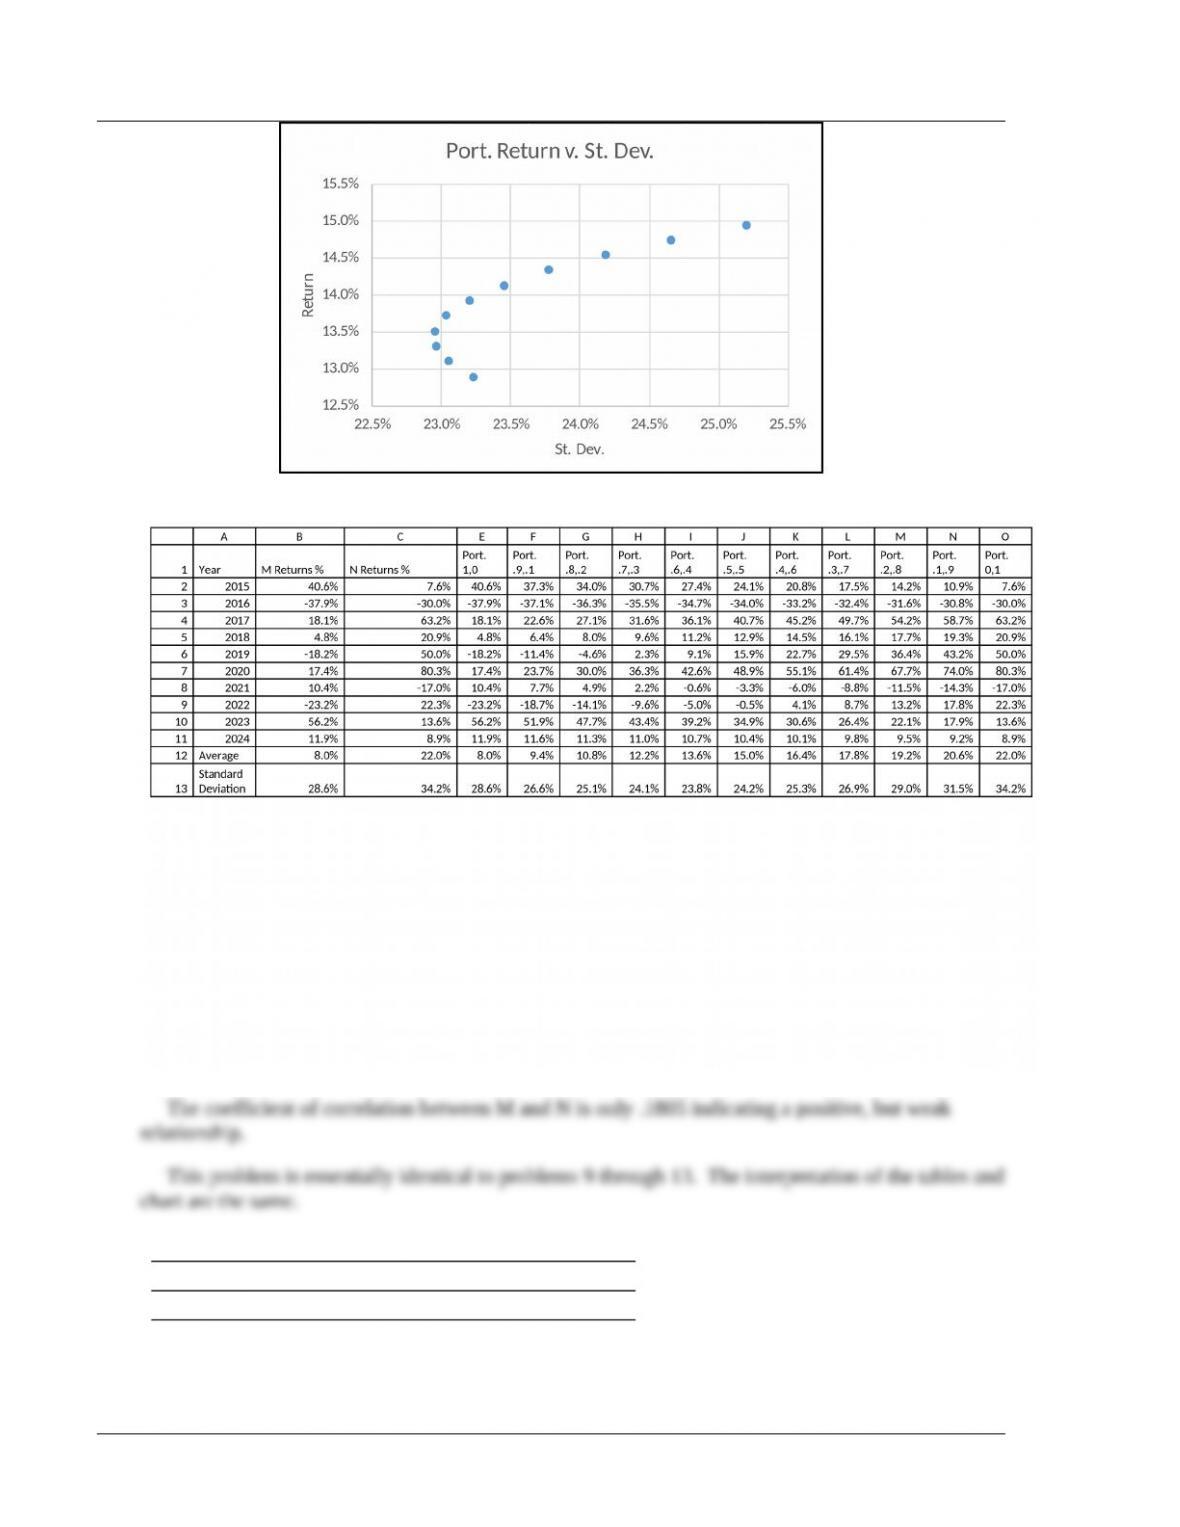
22 Smart/Gitman/Joehnk • Fundamentals of Investing, Thirteenth Edition
14.
5.15
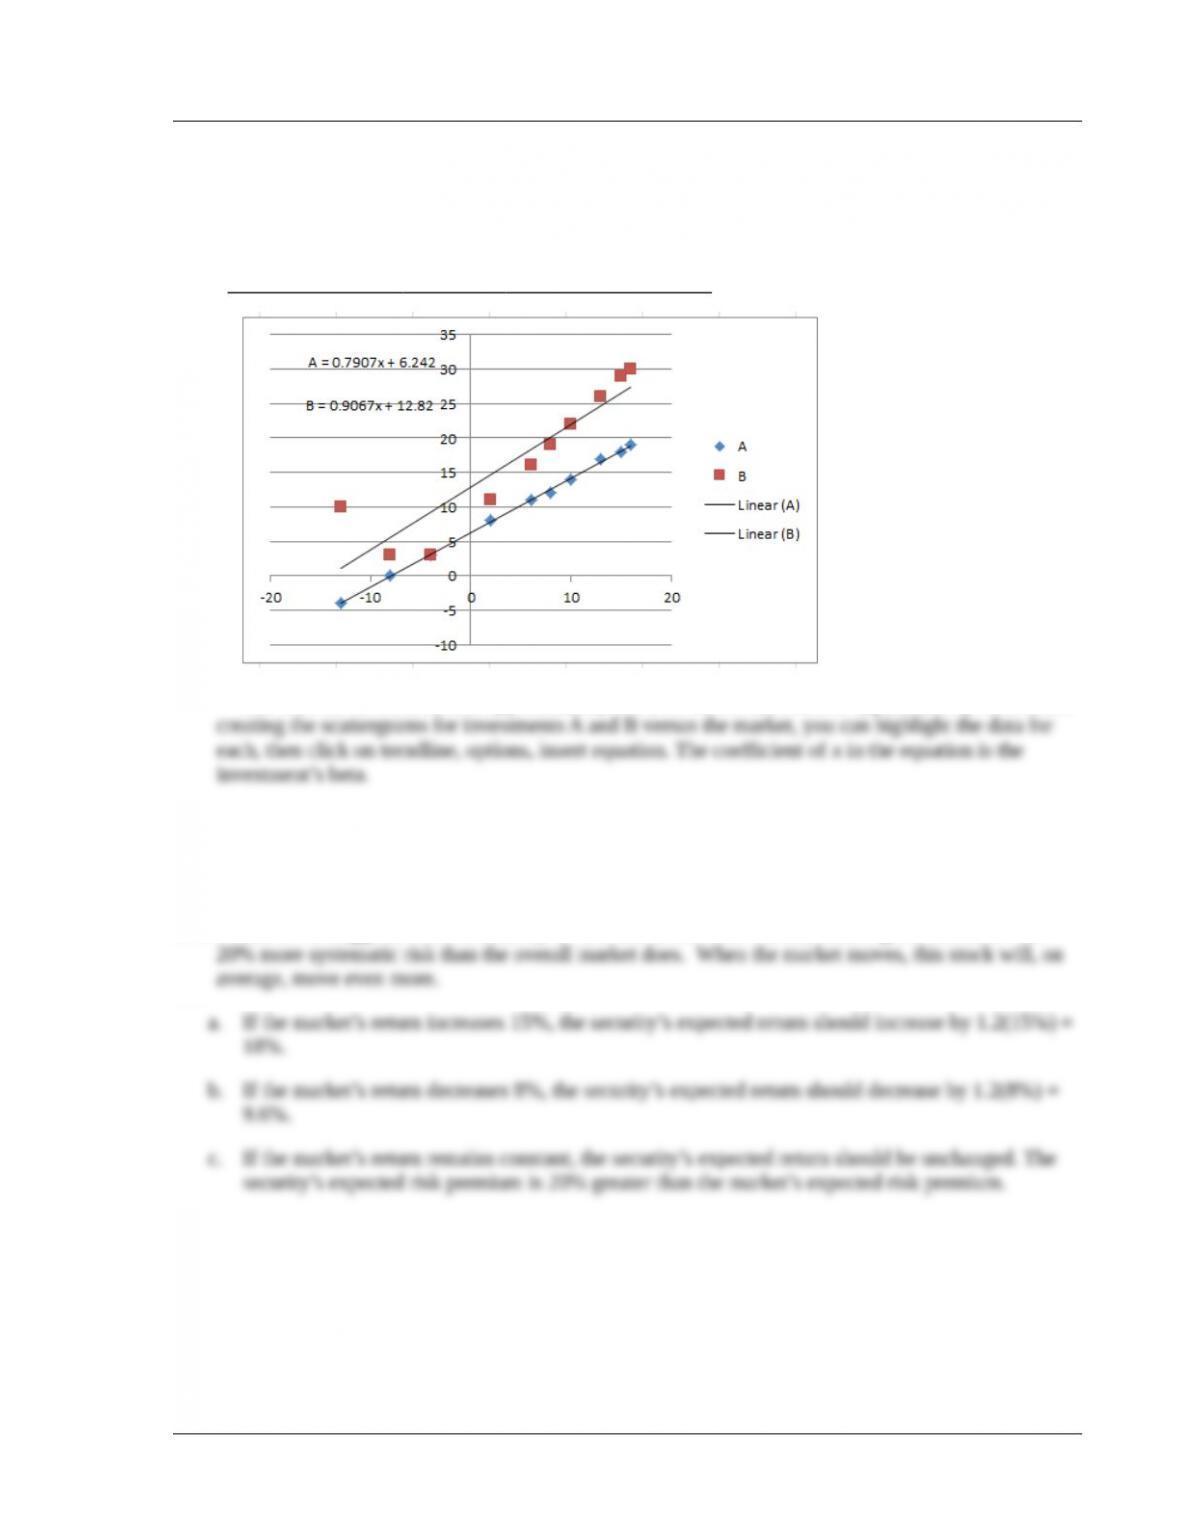
Investment %
Year Market A B
2008 6 11 16
2009 2 8 11
2010 –13 –4 10
©2017 Pearson Education, Inc.
Chapter 2 Securities Markets and Transactions 23
2011 –4 3 3
2012 –8 0 3
2013 16 19 30
2014 10 14 22
2015 15 18 29
2016 8 12 19
2017 13 17 26
The beta for investment A is approximately 0.79; for investment B, it is approximately 0.91. After
5.16 You should buy Buyme because it provides the same return at lower risk (beta).
5.17 If you are very confident that there will be a market rally, you might buy Getit because that stock’s
higher beta would in a higher expected response to the rise in the market.
5.18 A beta of 1.2 suggests that this security is 20% riskier than the market, meaning that the stock has
©2017 Pearson Education, Inc.