252 Smart/Gitman/Joehnk • Fundamentals of Investing, Thirteenth Edition
Solutions to Problems
13.1 Investor A would more likely be the retired couple because they would want to have low risk.
13.2 Portfolio A is more likely to be owned by the retired couple. They would be looking for low risk and
13.3 Capital gain $2,500 – $1,762 $738
HPR =Dividend +Capital gain
Purchase price
=$300 +$738
$1,762 =58.9% (for a 15-month holding period)
13.4
A
Cost
B
Proceeds
B–A
Profit
Trading
Cost
Profit
after Costs
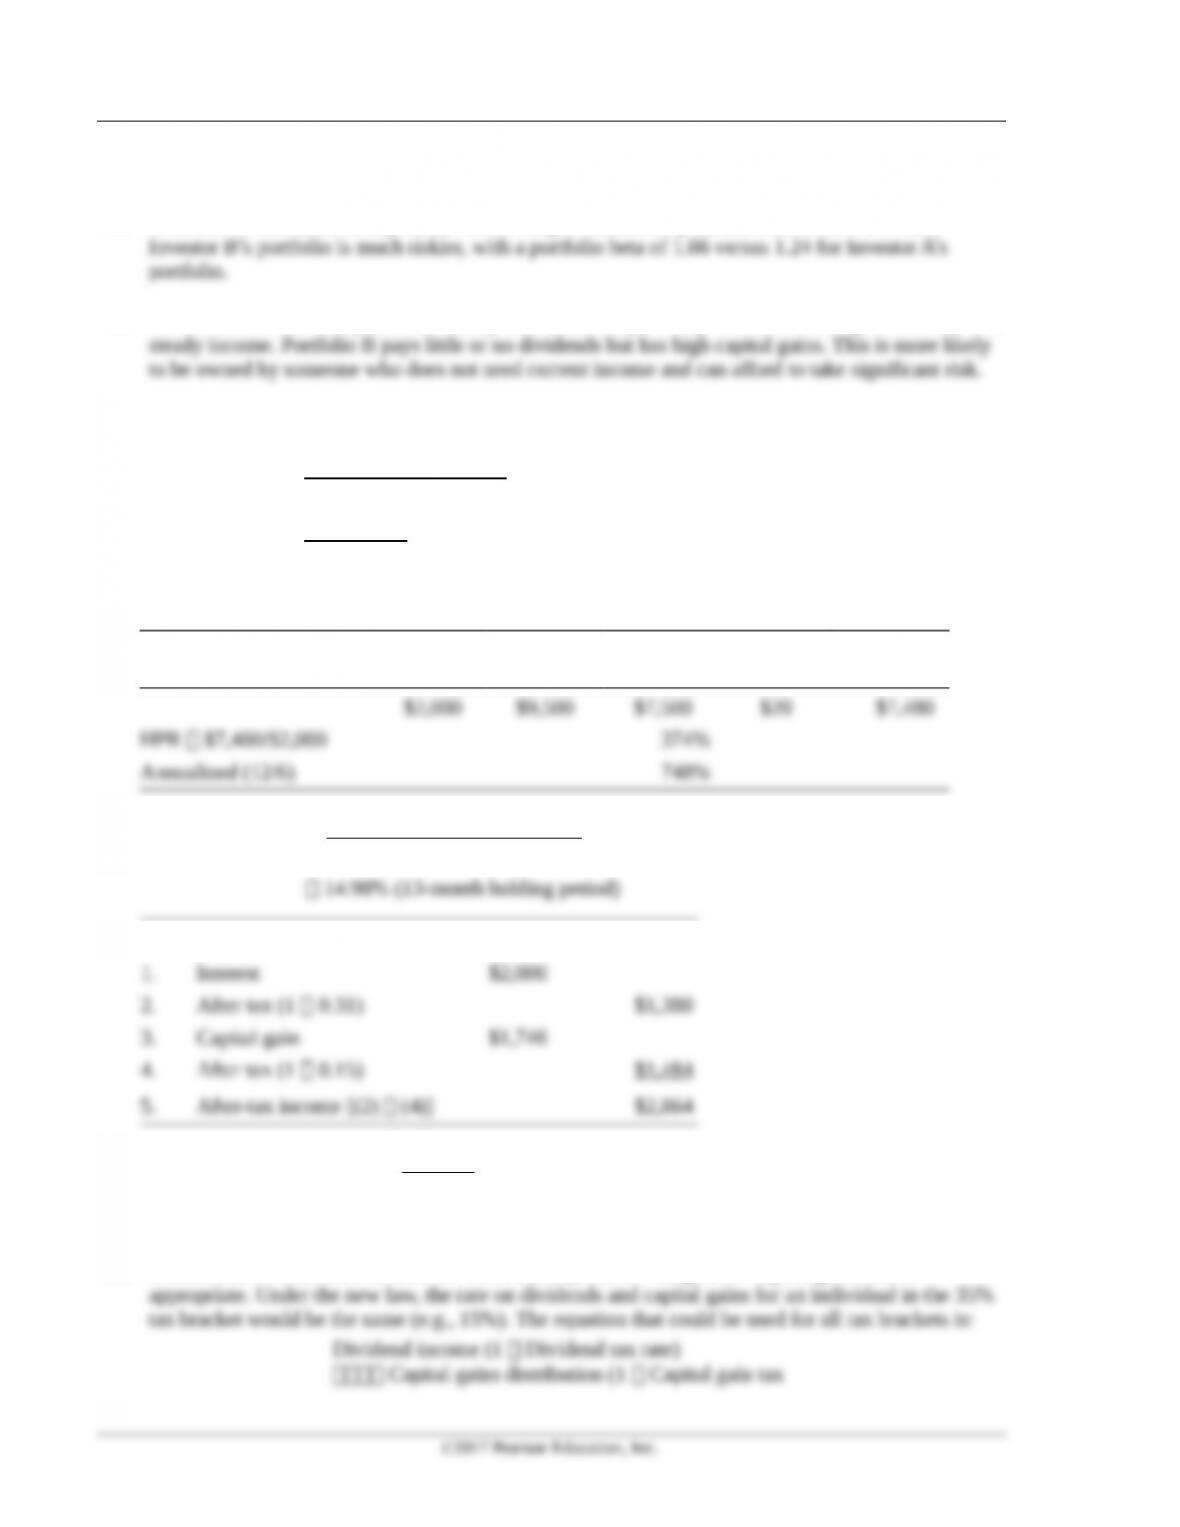
13.5 HPR (before tax)
$2,000 ($26,746 $25,000)
$25,000
+ –
14.98% (13-month holding period)
Tax Calculations
Therefore, HPR (after-tax)
$2,864 11.46%*
$25,000 =
For a 13-month holding period
13.6 Because the investment was held for more than a year, the “long-term” capital gains rate is

253 Smart/Gitman/Joehnk • Fundamentals of Investing, Thirteenth Edition
rate)
Incorporating the values from Charlotte Smidt’s situation we get:
Pretax HPR = (.32+.38+.15)/8.60 = 9.88%

Chapter 13 Managing Your Own Portfolio 254
c. SMmarket
9.0 6.2 0.298
9.4
–=
d. Based on the SMs, Niki’s portfolio performed better than the market (0.397 versus 0.298 for the
market).
13.12 Treynor’s measure for the portfolio (12.0 – 2.0)/1.3 7.69
13.13 a. Treynor’s measure = (Portfolio return-risk-free rate)/Portfolio beta
b. Anna’s portfolio outperformed Stacey’s, with a TM of 5.88 versus one of 1.25.
13.15 a. Jensen’s measure (JM) [(Total portfolio return Risk-free rate)
Portfolio beta (Market return Risk-free rate)]
b. Chee’s portfolio, with a JM of .14, slightly outperformed Carri’s portfolio, with a JM of
c. Based on its negative JM, Chee’s portfolio has performed worse than the market.
13.16 Measure Fio Family Market
a. SM
12.8 8.1 4.7 11.2 8.1 3.1
13.5 13.5 9.6 9.6
–– –
= =
p F
p
r R
s
The Fio family’s portfolio, with a slightly higher SM, marginally outperformed the market.
b. TM
12.8 8.1 4.7 11.2 8.1 3.1
1.1 1.1 1.0 1.0
–– –
= =
p F
p
r R
b
The Fio family’s portfolio, with a higher TM, outperformed the market.
d. Based on all the above measures, the Fio family’s portfolio performed better than the market.
©2017 Pearson Education, Inc.
255 Smart/Gitman/Joehnk • Fundamentals of Investing, Thirteenth Edition
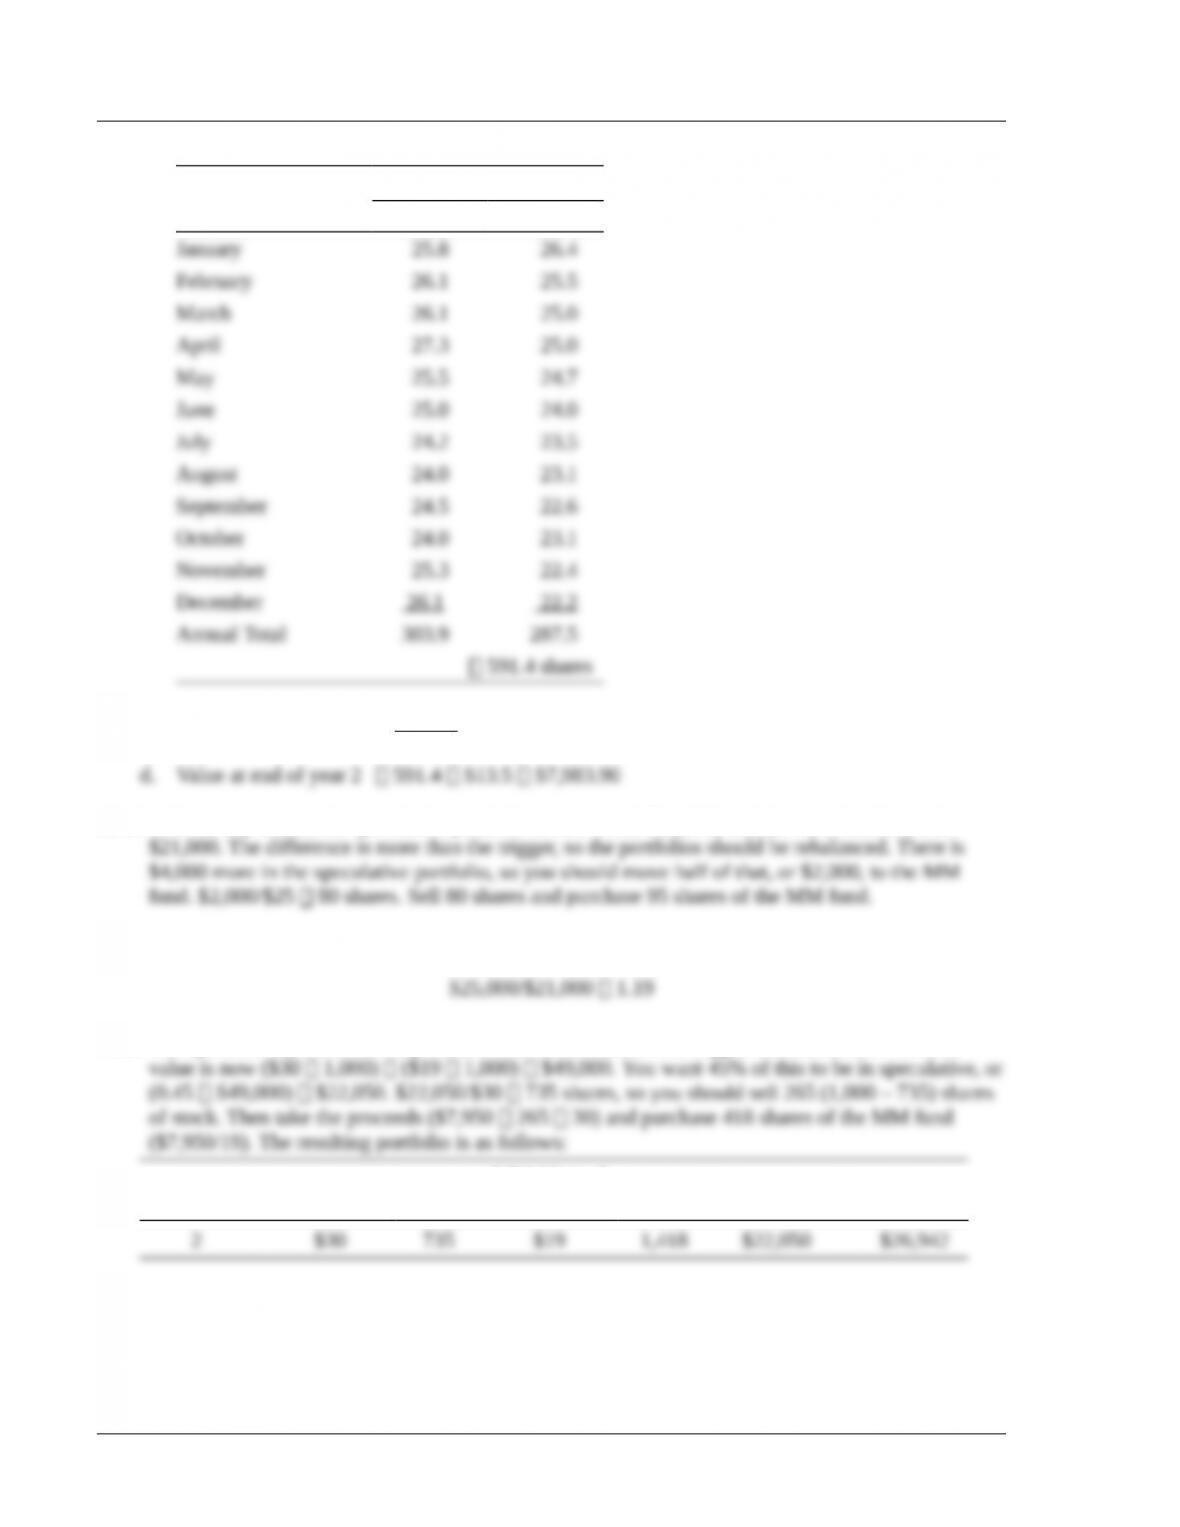
b. To find the number of shares purchased each month, divide $300 by the share price:
Number of Shares
Month Year 1 Year 2
c. Average cost per share
$7,200 $12.17
591.4 =
per share
13.18 Without any action, the speculative portfolio is now worth $25,000, and the MM fund is worth
13.19 You should take no action because the trigger has not been hit.
13.20 The speculative portion now represents 61% of the total, which triggers the rebalance. The total
Time Period Stock Price Shares
MM Mutual
Fund NAV Shares Stock Value MM Value
The total value is now $48,992, and the speculative portfolio is 45% of the total.
Solutions to Case Problems
©2017 Pearson Education, Inc.
Chapter 13 Managing Your Own Portfolio 256
Case 13.1 Assessing the Stalchecks’s Portfolio Performance
This case gives the student an opportunity to compute the holding period return (HPR) for several
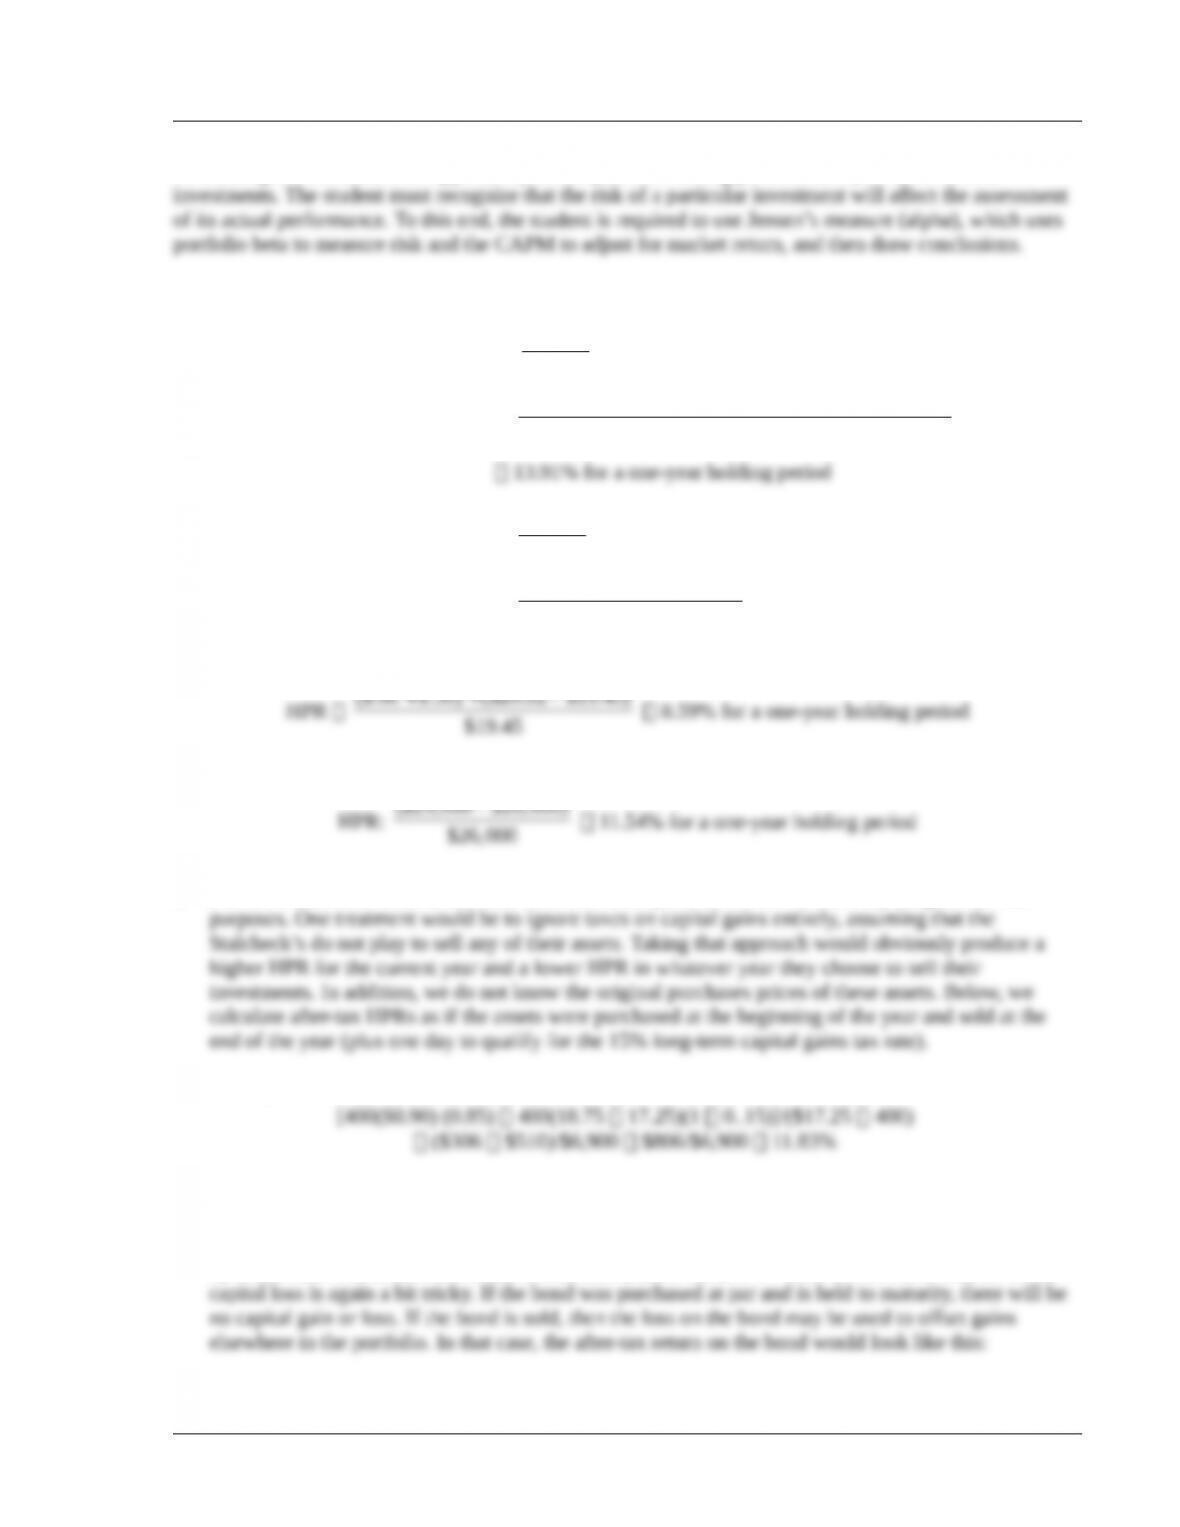
a. Before-tax HPRs:
HPR for common stock: HPRt
0
+C CG
V
HPR
($0.20 $0.20 $0.25 $0.25) ($18.75 $17.25)
17.25
+ + + + –
HPR for industrial bonds: HPR
0
+C CG
V
HPR
$92.50 ($963.75 $970) 8.89% for one-year holding period
$970
+ – =
HPR for mutual fund:
($.60 $.50) ($20.02 $19.45)
$19.45
+ + –
HPR for options:
($29,000 $26,000)
$26,000
–
b. For the calculations below, one must make an assumption about how to treat capital gains for tax
Stock (400 shares), reduced rate on dividends:
Industrial bonds (eight bonds):
The bonds generate $92.50 in interest income, which is taxable at 38%. The bonds decreased in value
by $6.25. The total before tax return is therefore (92.50-6.25)/970 = 8.89%. The tax treatment of the
©2017 Pearson Education, Inc.

257 Smart/Gitman/Joehnk • Fundamentals of Investing, Thirteenth Edition
Alternatively, we could treat the loss on the bond as a short-term loss, so the after–tax return becomes:
Mutual fund (500 shares), reduced rate on dividend and capital gain distributions:
Options:
HPR (portfolio)
$1,650 $3,835 10.89% for a 1-year holding period
$50,385
+=
d. JM (rp – RF) – [bp (rm – RF)]
(10.89 – 7.20) – [1.2 (10.10 – 7.20)]
3.69 – (1.20 2.90) 3.69 – 3.48 0.21
Using Jensen’s measure, the actual portfolio return is better than the required return because it is
positive. The use of Jensen’s measure is less than ideal because the Stalcheck’s portfolio cuts across
©2017 Pearson Education, Inc.
Chapter 13 Managing Your Own Portfolio 258
e. This question should lead to discussion—it has no pat answer. In general, the portfolio is balanced
between current income and growth. The ratio of current income to capital gain is 43 ($1,650/$3,835);
one might wish to discuss whether or not this is satisfactory. The returns on each of the investments
Case 13.2 Evaluating Formula Plans: Charles Spurge’s Approach
This case allows students to use a simplified portfolio to evaluate the four formula plans presented in the
text. For ease in computation and discussion, we have assumed that fractional shares can be purchased.
Instructors may wish to revise the numbers to eliminate fractional shares.
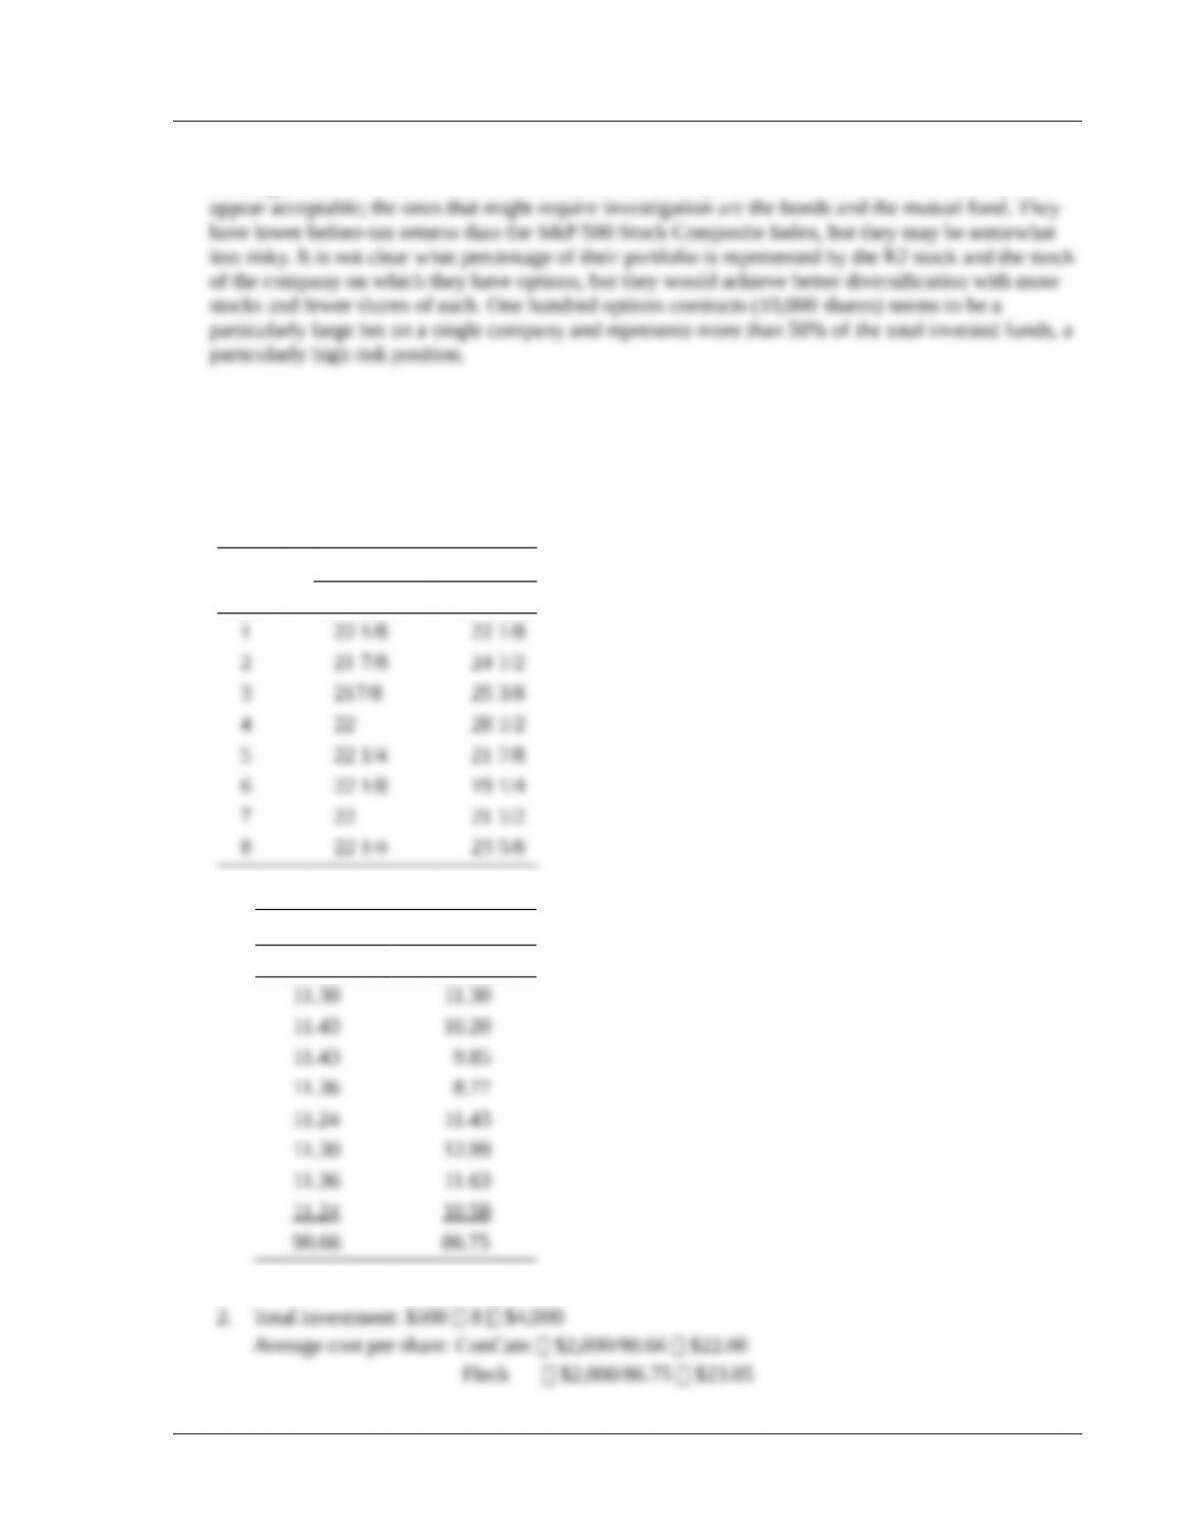
a. Price per share:
End of Period
Period ConCam Fleck
1.
Number of Shares Purchased
ConCam Fleck
Note: Remember, ConCam is the conservative stock, and Fleck is the speculative stock.
©2017 Pearson Education, Inc.
259 Smart/Gitman/Joehnk • Fundamentals of Investing, Thirteenth Edition
3. Year-End Value
Percent of Initial Investment
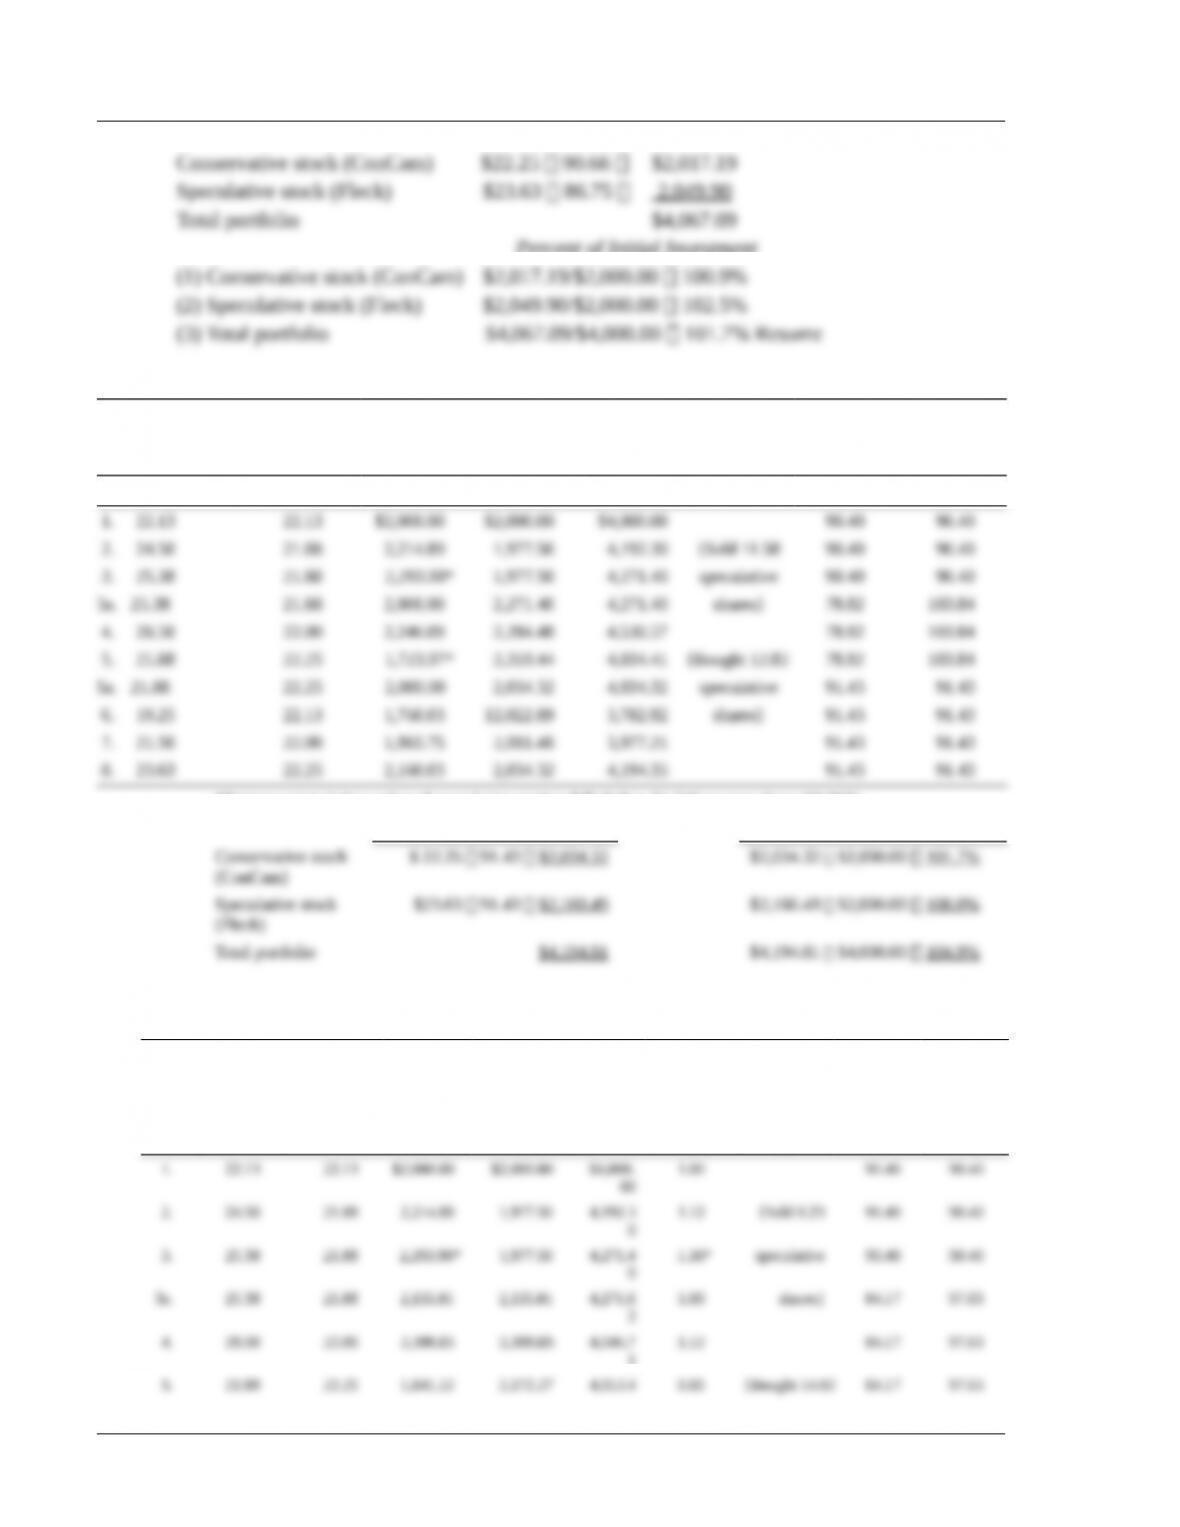
b. Constant-dollar plan: return speculative value (Fleck) to $2,000 when trigger points are reached.
Price of
Speculative
Stock
Price of
Conservative
Stock
Value of
Speculative
Stock
Value of
Conservative
Stock
Total
Value Transactions
Shares in
Speculative
Shares in
Conservative
Fleck ConCam Fleck ConCam
*Trigger points (when value of speculative portion falls below $1,740 or goes above $2,260)
Year-End Value Percent of Initial Investment
c. Constant ratio plan: rebalance to value of speculative portion equal to value of conservative portion
when ratio hits trigger point.
Period
Price of
Speculative
Stock
Price of
Conservative
Stock
Value of
Speculati
ve
Stock
Value of
Conservati
ve
Stock
Total
Value
Ratio of
Speculative
Stock to
Conservati
ve
Stock
Transactio
ns
Shares in
Speculati
ve
Shares in
Conservati
ve
©2017 Pearson Education, Inc.
Chapter 13 Managing Your Own Portfolio 260
9
0
*Trigger points (when ratio of the value of speculative portfolio to value of conservative portfolio falls below 0.84 or exceeds 1.15)
Note: Numbers may not add exactly due to rounding.
Year-End Value Percent of Initial Investment
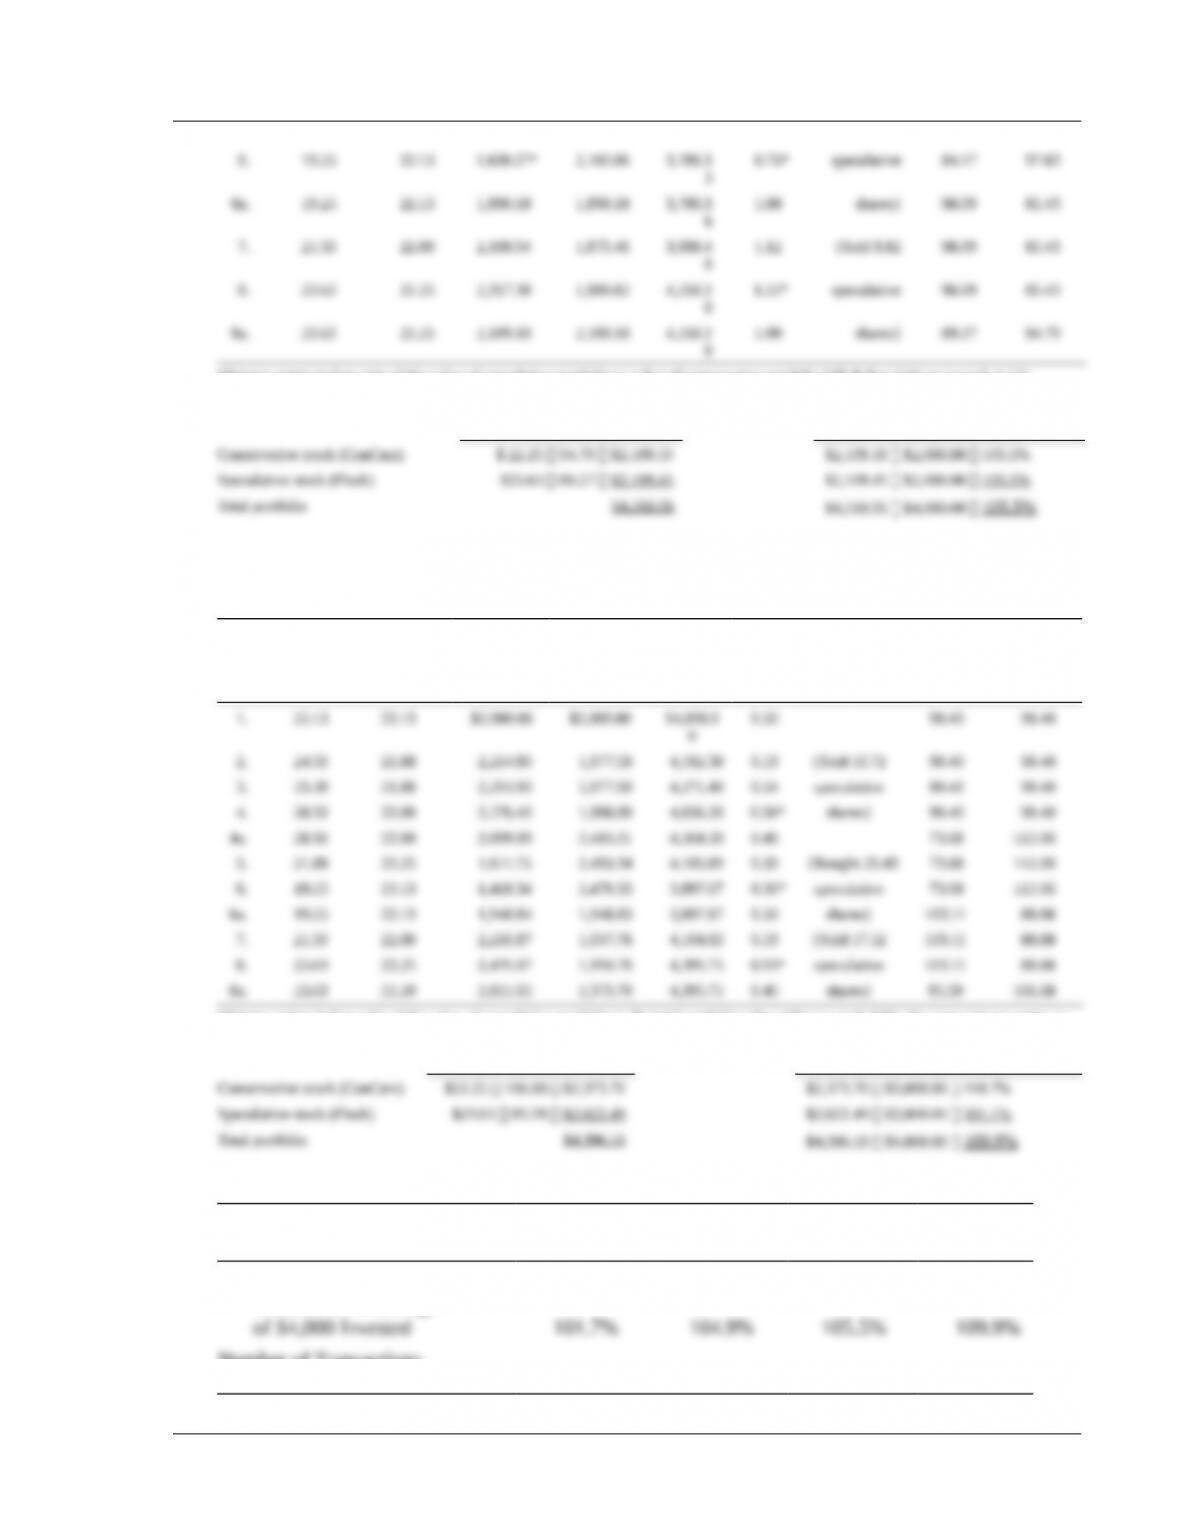
d. Variable-ratio plan: rebalance speculative portion to 46% of the total portfolio value each time the
upper trigger point is reached; rebalance speculative portion to 50% each time the lower trigger
point is reached.
Period
Price of
Speculative
Stock
Price of
Conservative
Stock
Value of
Speculative
Stock
Value of
Conservativ
e
Stock
Total
Portfolio
Value Ratio Transactions
Shares in
Speculati
ve
Shares in
Conservativ
e
*Trigger points (when ratio of the value of speculative portfolio to the total portfolio value either exceeds 54%, the upper trigger point, or
falls below 38%, the lower trigger point).
Year-End Value Percent of Initial Investment
e. Formula plan:
Dollar Cost
Averaging
Constant
Dollar
Constant
Ratio
Variable
Ratio
Year-End Portfolio
Value as a Percentage
Number of Transactions
©2017 Pearson Education, Inc.

261 Smart/Gitman/Joehnk • Fundamentals of Investing, Thirteenth Edition
In this illustration, the formula plans have performed much the way one would expect. The most
The other three plans show increasing year–end values as one moves from the lowest activity and
risk—the constant-dollar plan—to highest activity and risk—the variable-ratio plan. While the
Answers to CFA Questions (Part V)
©2017 Pearson Education, Inc.