CHAPTER 4
1.1 (a)
(b)
(c)
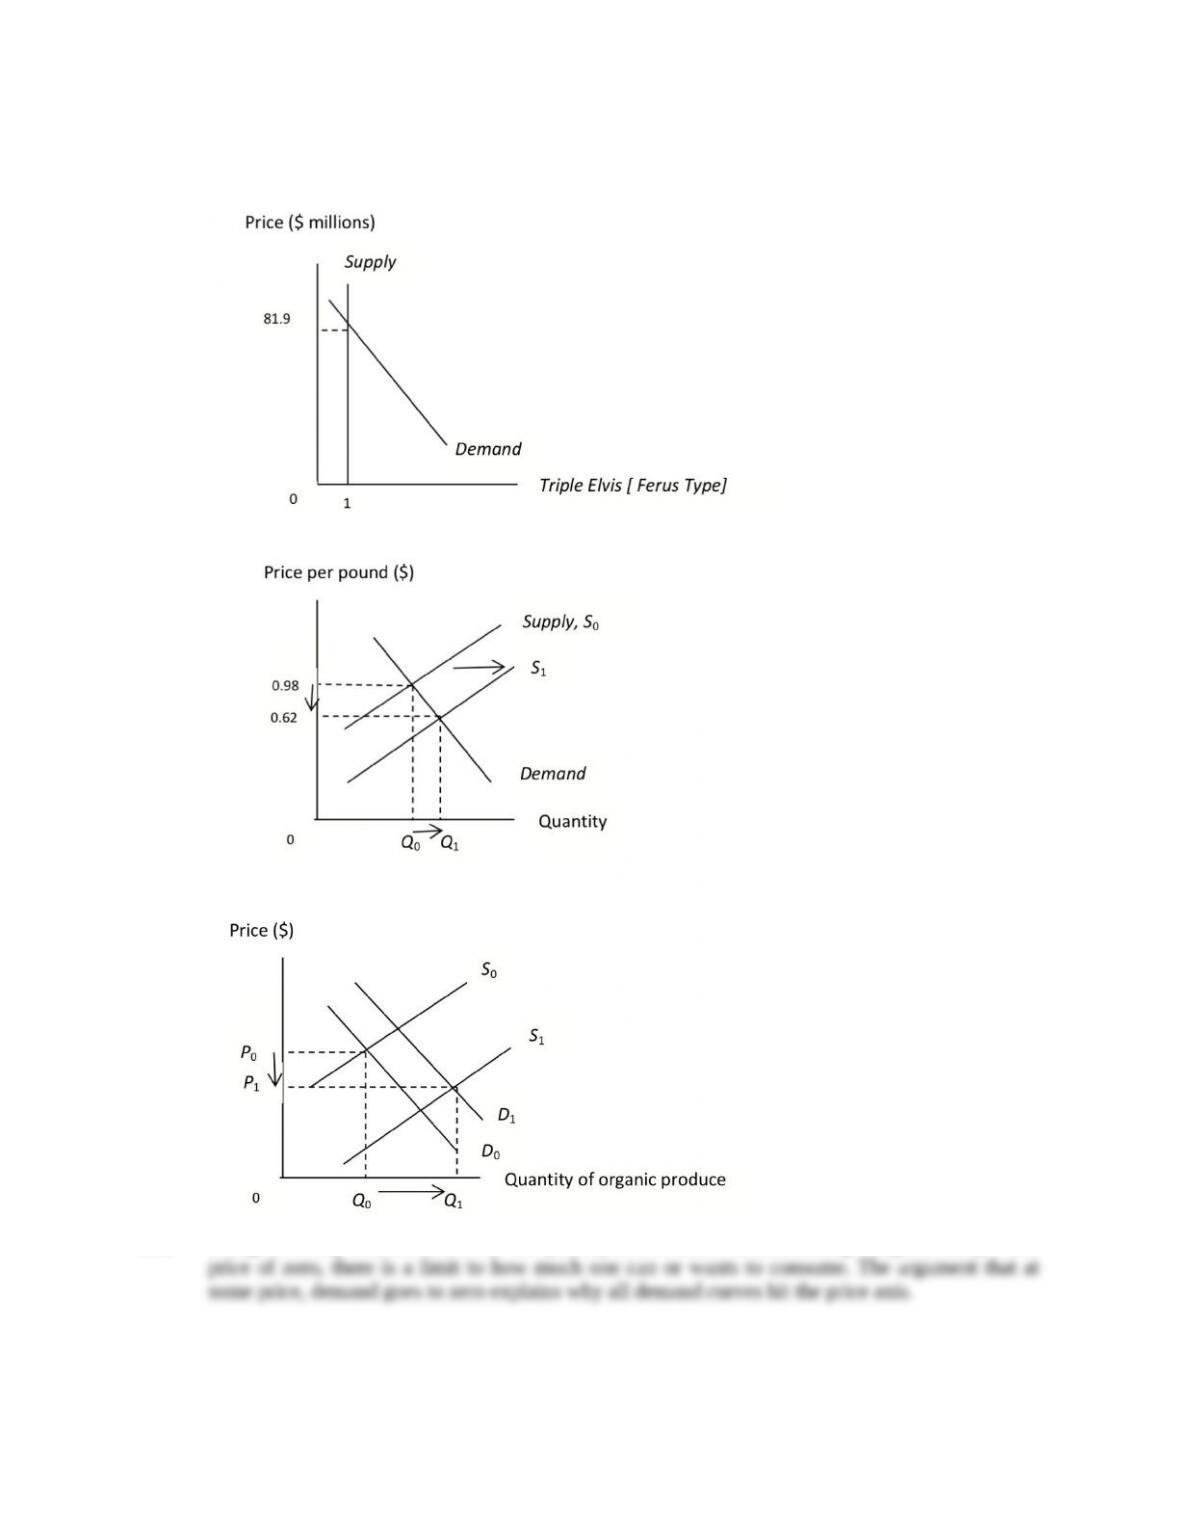
1.2 Disagree. Every demand curve hits the quantity axis because of diminishing marginal utility—at a
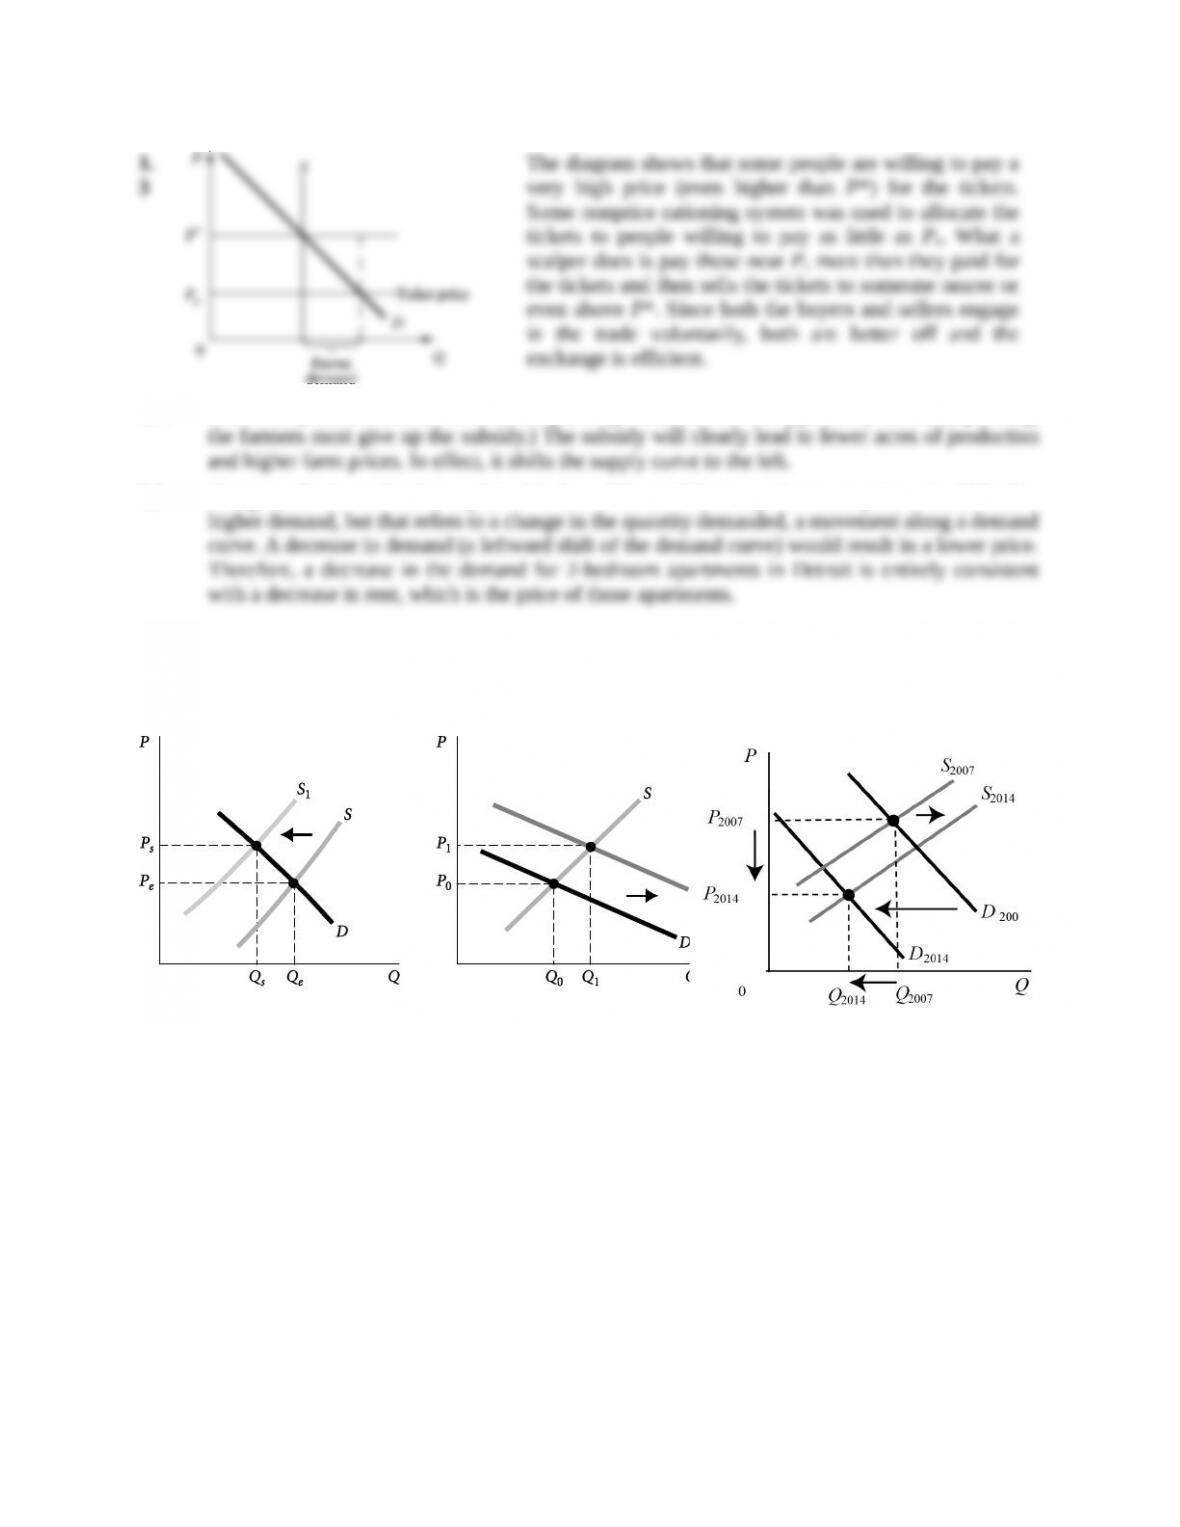
1.4 The subsidy does increase the “cost” of planting—there is now an opportunity cost. (By planting,
1.5 Disagree; this is not hard to explain. The law of demand does say that lower prices should lead to
1.6
(a) Wheat (b) Chicken (c) Gasoline
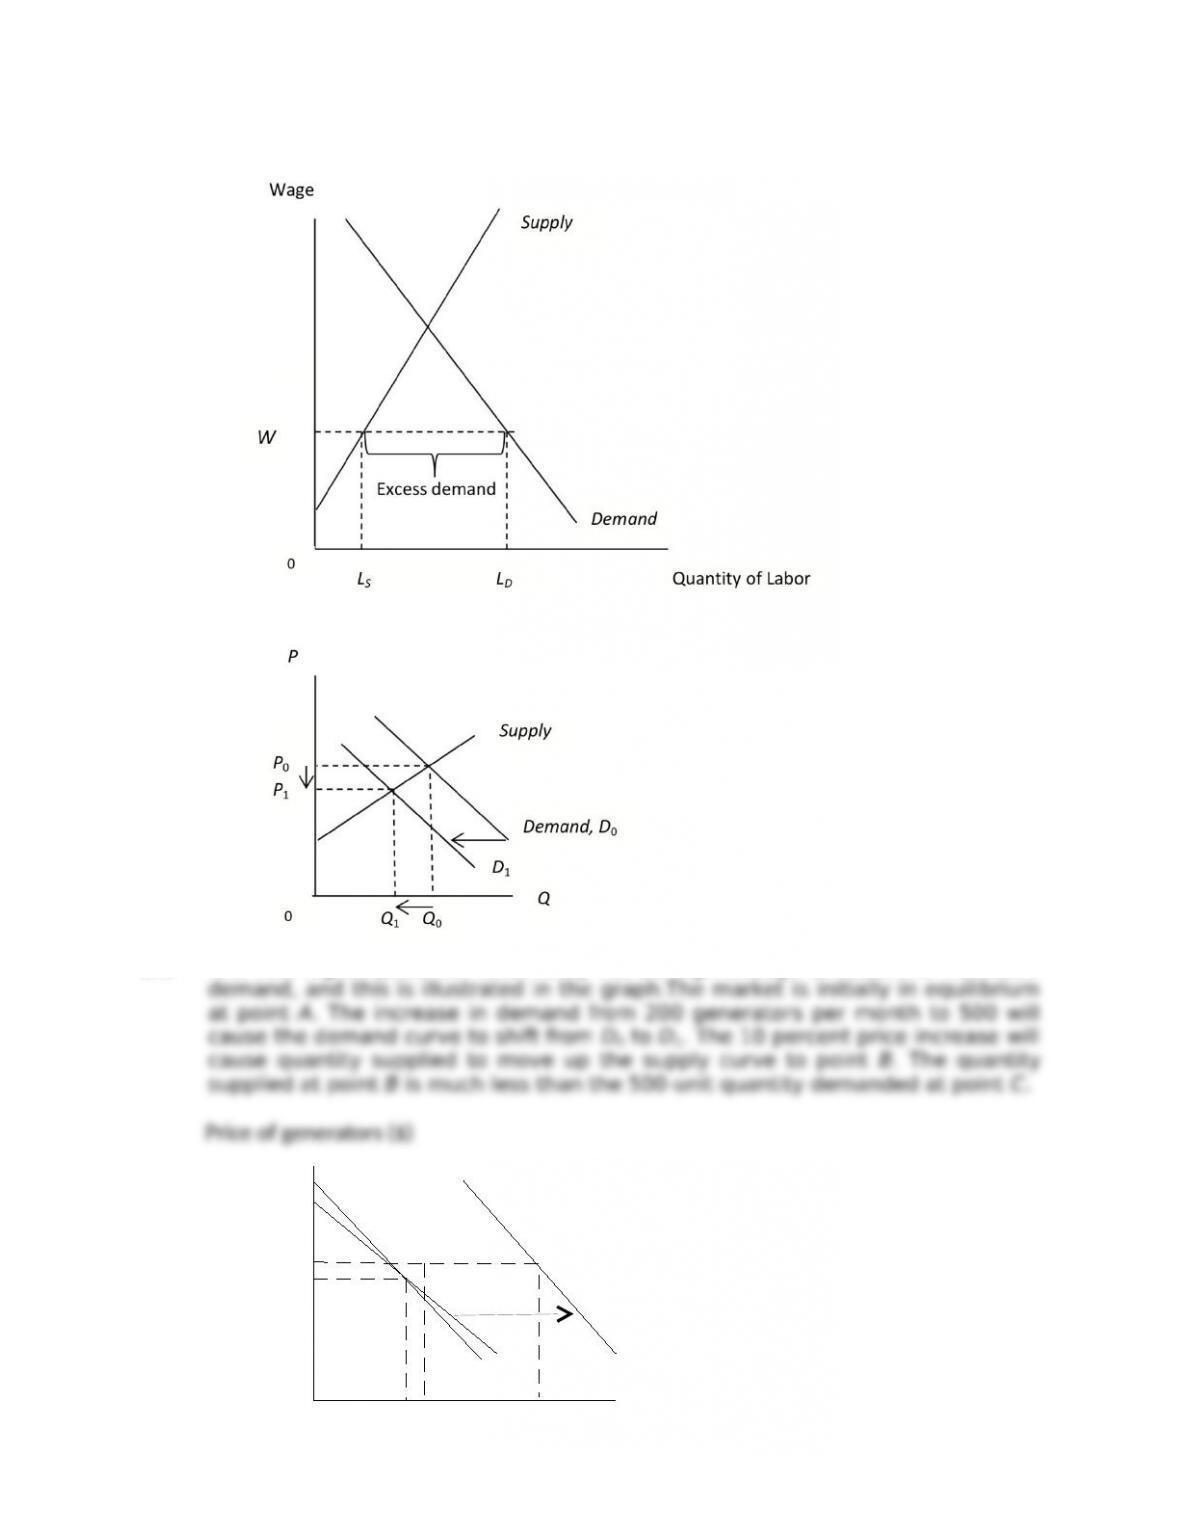
Quanty of generators
110
100
0
A
B C
S
D1D0
200 500
1.7 (a)
(b)
1.8 The new higher price will most likely not be high enough to meet the increased
1.9 Answers will vary based on the actual average price of gasoline throughout 2015 and the price of
1.10 The demand for 5-day trips is most likely highest for cruises that depart on a Thursday and return
1.11 First of all, waiting in line is not a very productive use of time. There is an opportunity cost. If
1.12 (a) If a price ceiling is set at $10 per bushel, the market price would not be able to rise to its
(b) If a price floor is set at $30 per bushel, the market price would not be able to fall to its
2.1 (a)
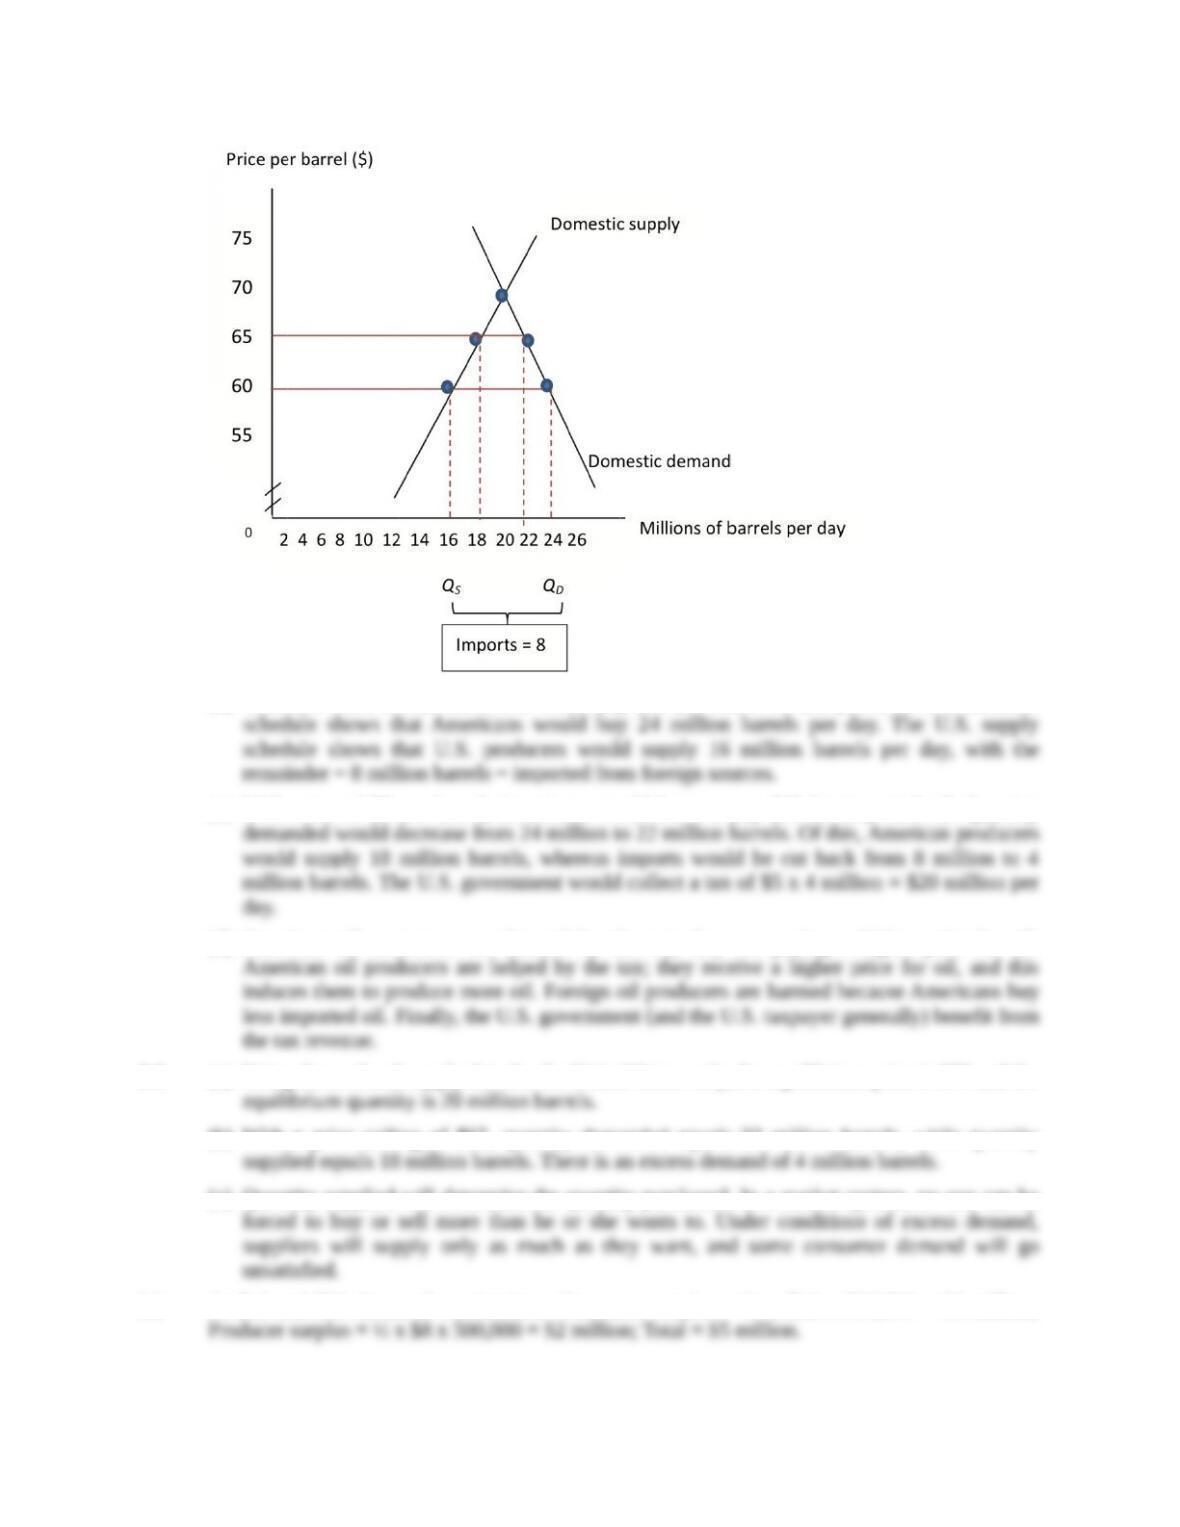
(b) With free trade in oil, Americans would pay $60 per barrel. At this price, the U.S. demand
(c) With a tax of $5 per barrel, Americans would have to pay $65 for imported oil. Quantity
(d) American oil consumers are harmed by the tax; they are paying a higher price for oil.
2.2 (a) Using demand and supply data for the United States only, the equilibrium price is $70 and the
(b) With a price ceiling of $65, quantity demanded equals 22 million barrels, while quantity
(c) Quantity supplied will determine the quantity purchased. In a market system, no one can be
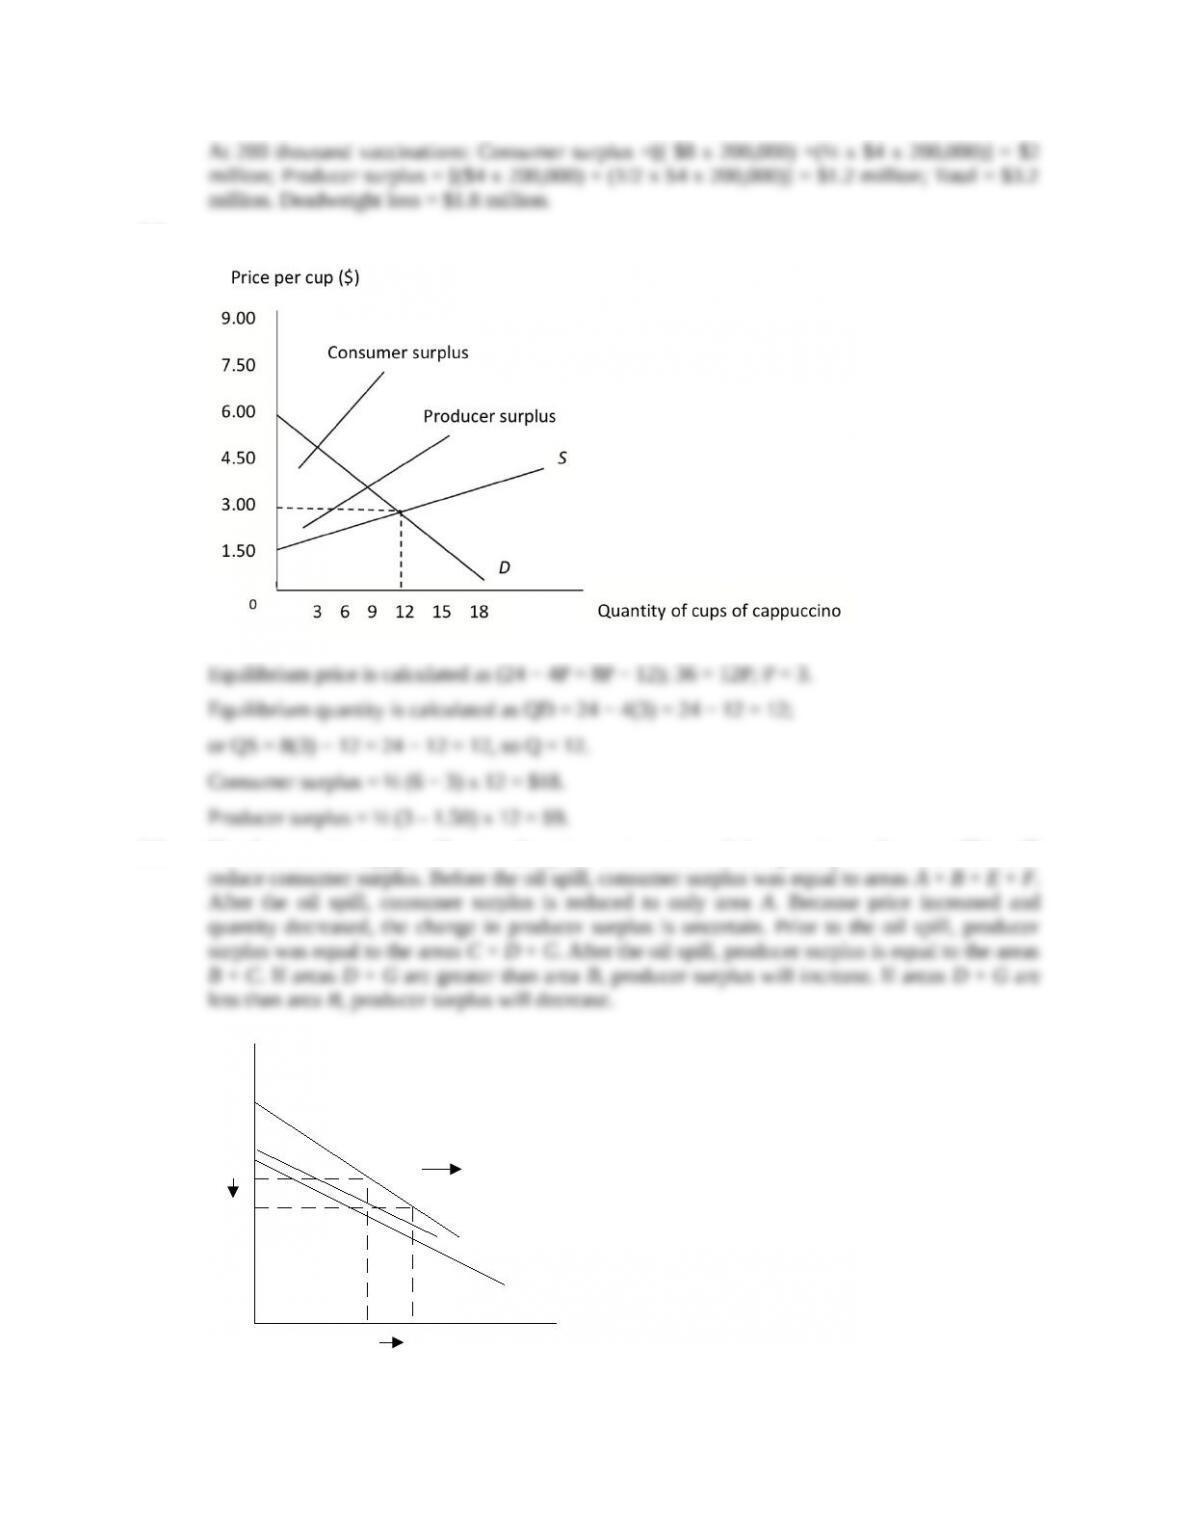
3.1 At $12 and 500 thousand vaccinations: Consumer surplus = ½ x $12 x 500,000 = $3 million;
Quanty of sh
Price of sh
0
Demand
S1
S2
P1
P2
Q2 Q1
A
B
C
D
E F
G
3.2
3.3 The decrease in supply will cause the price to increase and the quantity to decrease. This will
Demand
Supply
Quanty of DVDs (millions)
Price of DVDs
7
6
5
4
3
2
1
0
369 12 15 18 21 24 27 30
A
B
Demand
Supply
Quanty of DVDs (millions)
Price of DVDs
7
6
5
4
3
2
1
0
369 12 15 18 21 24 27 30
C
D
E
F
G
H
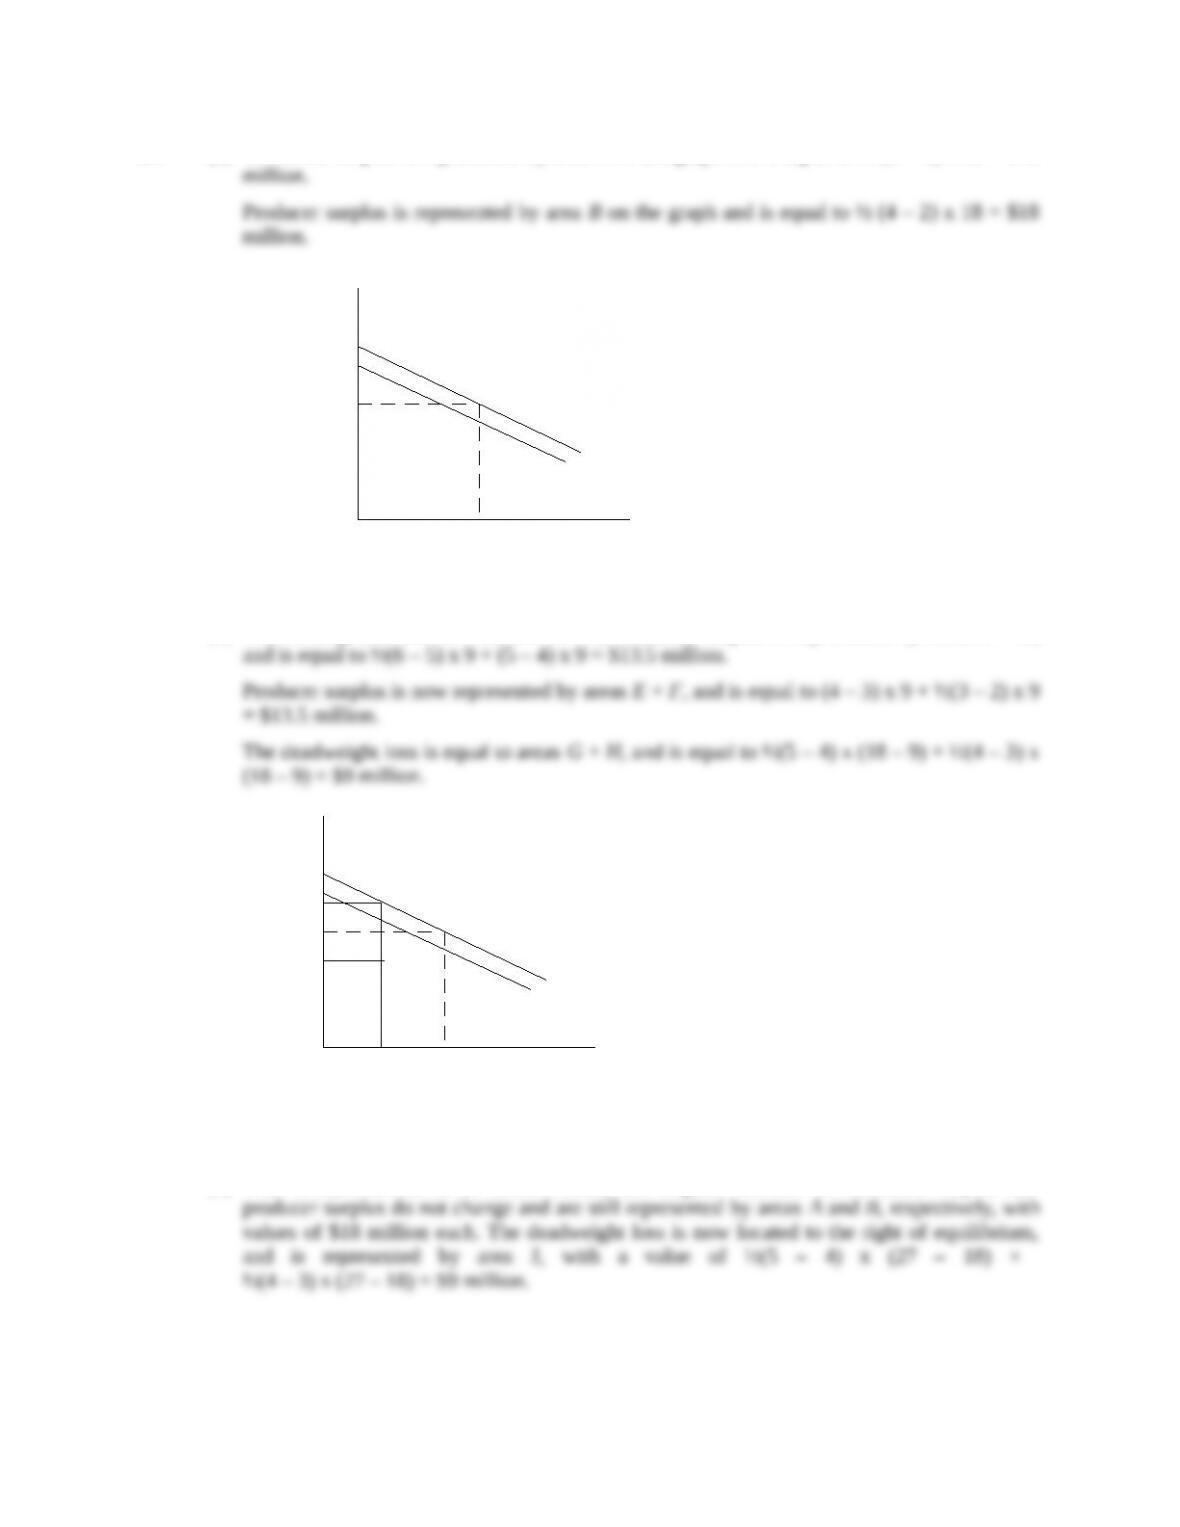
3.4 (a) Consumer surplus is represented by area A on the graph and is equal to ½ (6 – 4) x 18 = $18
(b) With underproduction of 9 million DVDs, consumer surplus is represented by areas C + D,
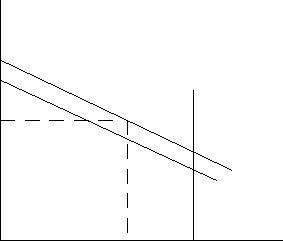
(c) With overproduction of 27 million units, the original amounts of consumer surplus and
Demand
Supply
Quanty of DVDs (millions)
Price of DVDs
7
6
5
4
3
2
1
0
369 12 15 18 21 24 27 30
A
B
J