CHAPTER 22
1.1 (a) There may be many factors that would cause the incidence of heart disease to be more
(b) More women live in senior assisted living facilities because, on average, they tend to outlive
(c) Students who attend prestigious private schools would have likely earned more than the
1.2 The original British plan was to add armor to those areas of returning planes that had the most
2.1 (a) This is an example of positive correlation. They are positively correlated because as the
(b) This is an example of causality, because the higher amounts of rain are responsible for the
(c) This could be an example of causality, because it is possible that living in a fraternity house is
(d) This is an example of positive correlation. They are positively correlated because as the
(e) This is an example of negative correlation. They are negatively correlated because as the
2.2 (a) The rate of death in Group A is (10 / 50) = 20%.
303
Copyright © 2017 Pearson Education, Inc.
Solutions to Problems 304
2.3 August 31 is the cutoff date for entering school, so students who turn 6 years old on August 31
2.4 Let ebeg and wbeg denote the average monthly energy use for homes in East Magoo and West
Magoo in 2014, and let eend and wend denote the average monthly energy use for homes in East
2.5 While electricity use did, indeed, increase in East Magoo during 2015, it also increased in West
Magoo. This could easily be the result of a hotter summer and/or a colder winter in 2015
3.1 Statistical significance will be greater the larger the sample size and the less variation that exists
In Scenario 1, the sample size is small and the characteristics of the people surveyed are likely to
In Scenario 2, the sample size is large, but the characteristics of the people surveyed are likely to
In Scenario 3, the characteristics of the people surveyed are likely to be of low variation, but the
In Scenario 4, the sample size is large and the characteristics of the people surveyed are likely to
Copyright © 2017 Pearson Education, Inc.
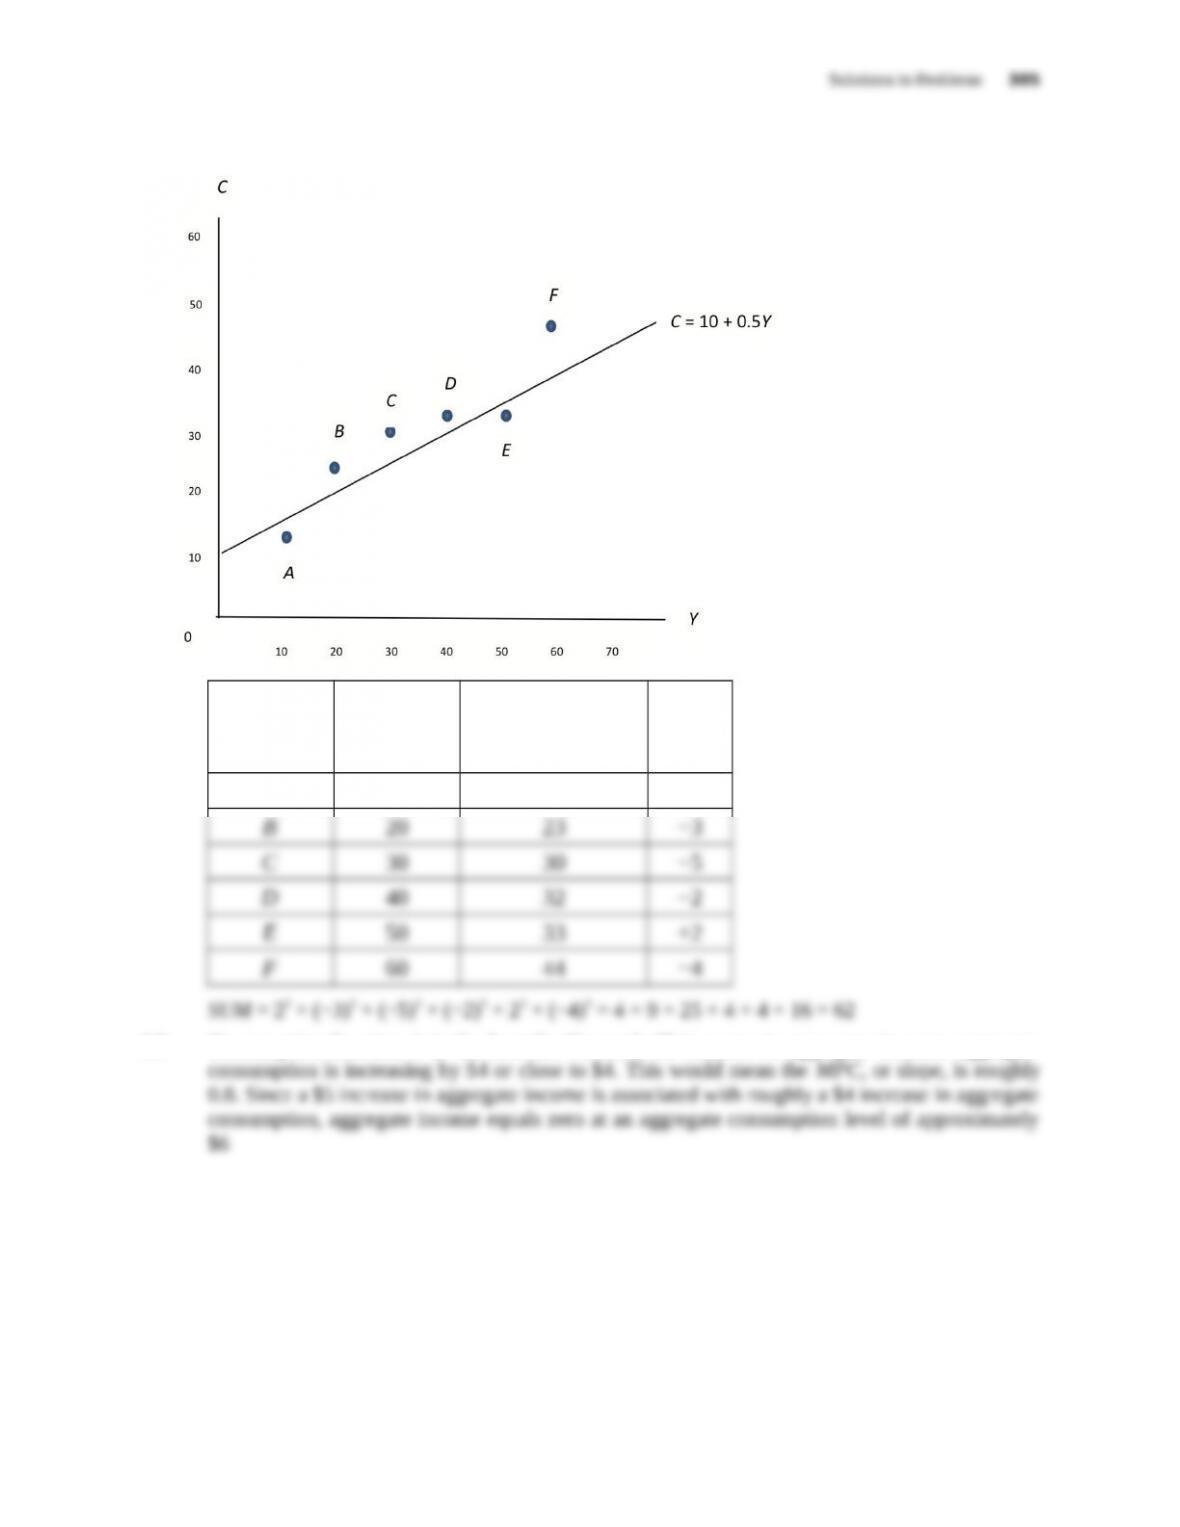
4.1
Point
Aggregate
Income
(Y)
Aggregate
Consumption
(C) Error
A10 13 +2
4.2 Consumption function 1 is the best fit. For each $5 increase in aggregate income, aggregate
Copyright © 2017 Pearson Education, Inc.