Australia’s Current Account
Australia’s Current Account
Use the following data from the International Monetary Fund to answer questions 3.1 through 3.4.
Assumptions (million US$) 2000 2001 2002 2003 2004 2005 2006 2007 2008 2009 2010 2011 2012 2013
3.1 What is Australia’s balance on goods?
3.2 What is Australia’s balance on services? Goods, credit (exports) 64,052 63,676 65,099 70,577 87,207 107,011 124,913 142,421 189,057 154,777 213,782 271,719 257,950 254,164
3.3 What is Australia’s balance on goods and services? Goods, debit (imports) -68,865 -61,890 -70,530 -85,946 -105,238 -120,383 -134,509 -160,205 -193,972 -159,216 -196,303 -249,238 -270,136 -249,774
3.4 What is Australia’s current account balance? Services, credit (exports) 18,677 16,689 17,906 21,205 26,362 31,047 33,088 40,496 45,240 40,814 46,968 51,653 53,034 53,344
Services, debit (imports) -18,388 -16,948 -18,107 -21,638 -27,040 -30,505 -32,219 -39,908 -48,338 -42,165 -51,313 -61,897 -65,405 -67,399
Assumptions (millions of US dollars) 2000 2001 2002 2003 2004 2005 2006 2007 2008 2009 2010 2011 2012 2013 Primary income: credit 8,984 8,063 8,194 9,457 13,969 16,445 21,748 32,655 37,320 27,402 35,711 47,852 47,168 45,910
Primary income: debit -19,516 -18,332 -19,884 -24,245 -35,057 -44,166 -54,131 -73,202 -76,719 -65,809 -84,646 -102,400 -88,255 -83,618
Goods: exports 64,052 63,676 65,099 70,577 87,207 107,011 124,913 142,421 189,057 154,777 213,782 271,719 257,950 254,164 Secondary income: credit 2,622 2,242 2,310 2,767 3,145 3,333 3,698 4,402 4,431 4,997 5,813 7,510 7,271 7,206
Goods: imports -68,865 -61,890 -70,530 -85,946 -105,238 -120,383 -134,509 -160,205 -193,972 -159,216 -196,303 -249,238 -270,136 -249,774 Secondary income: debit -2,669 -2,221 -2,373 -2,851 -3,414 -3,813 -4,092 -4,690 -4,805 -5,799 -7,189 -9,723 9,635 9,390
Balance on goods -4,813 1,786 -5,431 -15,369 -18,031 -13,372 -9,596 -17,784 -4,915 -4,439 17,479 22,481 -12,186 4,390
Note: The IMF has recently adjusted their line item nomenclature. Exports are all now noted as credits, imports as debits .
Services: credit 18,677 16,689 17,906 21,205 26,362 31,047 33,088 40,496 45,240 40,814 46,968 51,653 53,034 53,344
Services: debit -18,388 -16,948 -18,107 -21,638 -27,040 -30,505 -32,219 -39,908 -48,338 -42,165 -51,313 -61,897 -65,405 -67,399
Balance on services 289 -259 -201 -433 -678 542 869 588 -3,098 -1,351 -4,345 -10,244 -12,371 -14,055
Income: credit 8,984 8,063 8,194 9,457 13,969 16,445 21,748 32,655 37,320 27,402 35,711 47,852 47,168 45,910
Income: debit -19,516 -18,332 -19,884 -24,245 -35,057 -44,166 -54,131 -73,202 -76,719 -65,809 -84,646 -102,400 -88,255 -83,618
Balance on income -10,532 -10,269 -11,690 -14,788 -21,088 -27,722 -32,383 -40,547 -39,399 -38,407 -48,935 -54,548 -41,087 -37,708
Current transfers: credit 2,622 2,242 2,310 2,767 3,145 3,333 3,698 4,402 4,431 4,997 5,813 7,510 7,271 7,206
Current transfers: debit -2,669 -2,221 -2,373 -2,851 -3,414 -3,813 -4,092 -4,690 -4,805 -5,799 -7,189 -9,723 9,635 9,390
Balance on current transfers -47 21 -63 -84 -269 -480 -394 -288 -374 -802 -1,376 -2,213 16,906 16,596
Questions 2000 2001 2002 2003 2004 2005 2006 2007 2008 2009 2010 2011 2012 2013
3.1 What is Australia’s balance on goods? -4,813 1,786 -5,431 -15,369 -18,031 -13,372 -9,596 -17,784 -4,915 -4,439 17,479 22,481 -12,186 4,390
(goods exports – goods imports)
3.2 What is Australia’s balance on services? 289 -259 -201 -433 -678 542 869 588 -3,098 -1,351 -4,345 -10,244 -12,371 -14,055
(services credit – services debit)
3.3 What is Australia’s balance on goods and services?
-4,524 1,527 -5,632 -15,802 -18,709 -12,830 -8,727 -17,196 -8,013 -5,790 13,134 12,237 -24,557 -9,665
(balance on goods + balance on services)
3.4 What is Australia’s current account balance? -15,103 -8,721 -17,385 -30,674 -40,066 -41,032 -41,504 -58,031 -47,786 -44,999 -37,177 -44,524 -48,738 -30,777
(the sum of the four balances listed above,
goods, services, income, and current transfers)
India’s Current Account
India’s Current Account
Use the following India balance of payments data from the IMF (all items are for the current account) to answer questions 3.5 through 3.9.
Assumptions (millions of US$) 2000 2001 2002 2003 2004 2005 2006 2007 2008 2009 2010 2011 2012 2013
3.5 What is India’s balance on goods?
3.6 What is India’s balance on services? Goods, credit (exports) 43,247 44,793 51,141 60,893 77,939 102,175 123,876 153,530 199,065 167,958 230,967 307,847 298,321 319,110
3.7 What is India’s balance on goods and services? Goods, debit (imports) -53,887 -51,212 -54,702 -68,081 -95,539 -134,692 -166,572 -208,611 -291,740 -247,908 -324,320 -428,021 -450,249 -433,760
3.8 What is the balance on goods, services and income? Services, credit (exports) 16,684 17,337 19,478 23,902 38,281 52,527 69,440 86,552 106,054 92,889 117,068 138,528 145,525 148,649
3.9 What is India’s current account balance? Services, debit (imports) -19,187 -20,099 -21,039 -24,878 -35,641 -47,287 -58,514 -70,175 -87,739 -80,349 -114,739 -125,041 -129,659 -126,256
Primary income: credit 2,521 3,524 3,188 3,491 4,690 5,646 8,199 12,650 15,593 13,733 9,961 10,147 9,899 11,230
Assumptions (millions of US dollars) 2000 2001 2002 2003 2004 2005 2006 2007 2008 2009 2010 2011 2012 2013 Primary income: debit -7,414 -7,666 -7,097 -8,386 -8,742 -12,296 -14,445 -19,166 -20,958 -21,272 -25,563 -26,191 -30,742 -33,013
Secondary income: credit 13,548 15,140 16,789 22,401 20,615 24,512 30,015 38,885 52,065 50,526 54,380 62,735 68,611 69,441
Goods: exports 43,247 44,793 51,141 60,893 77,939 102,175 123,876 153,530 199,065 167,958 230,967 307,847 298,321 319,110 Secondary income: debit -114 -407 -698 -570 -822 -869 -1,299 -1,742 -3,313 -1,764 -2,270 -2,523 -3,176 -4,626
Goods: imports -53,887 -51,212 -54,702 -68,081 -95,539 -134,692 -166,572 -208,611 -291,740 -247,908 -324,320 -428,021 -450,249 -433,760
Balance on goods -10,640 -6,419 -3,561 -7,188 -17,600 -32,517 -42,696 -55,081 -92,675 -79,950 -93,353 -120,174 -151,928 -114,650
Services: credit 16,684 17,337 19,478 23,902 38,281 52,527 69,440 86,552 106,054 92,889 117,068 138,528 145,525 148,649
Services: debit -19,187 -20,099 -21,039 -24,878 -35,641 -47,287 -58,514 -70,175 -87,739 -80,349 -114,739 -125,041 -129,659 -126,256
Balance on services -2,503 -2,762 -1,561 -976 2,640 5,241 10,926 16,377 18,315 12,540 2,329 13,487 15,866 22,393
Income: credit 2,521 3,524 3,188 3,491 4,690 5,646 8,199 12,650 15,593 13,733 9,961 10,147 9,899 11,230
Income: debit -7,414 -7,666 -7,097 -8,386 -8,742 -12,296 -14,445 -19,166 -20,958 -21,272 -25,563 -26,191 -30,742 -33,013
Balance on income -4,893 -4,142 -3,909 -4,895 -4,052 -6,650 -6,245 -6,516 -5,365 -7,539 -15,602 -16,044 -20,843 -21,783
Current transfers: credit 13,548 15,140 16,789 22,401 20,615 24,512 30,015 38,885 52,065 50,526 54,380 62,735 68,611 69,441
Current transfers: debit -114 -407 -698 -570 -822 -869 -1,299 -1,742 -3,313 -1,764 -2,270 -2,523 -3,176 -4,626
Balance on current transfers 13,434 14,733 16,091 21,831 19,793 23,643 28,716 37,143 48,752 48,762 52,110 60,212 65,435 64,815
Questions 2000 2001 2002 2003 2004 2005 2006 2007 2008 2009 2010 2011 2012 2013
3.5 What is India’s balance on goods? -10,640 -6,419 -3,561 -7,188 -17,600 -32,517 -42,696 -55,081 -92,675 -79,950 -93,353 -120,174 -151,928 -114,650
3.6 What is India’s balance on services? -2,503 -2,762 -1,561 -976 2,640 5,241 10,926 16,377 18,315 12,540 2,329 13,487 15,866 22,393
-13,143 -9,181 -5,122 -8,164 -14,960 -27,276 -31,770 -38,704 -74,360 -67,410 -91,024 -106,687 -136,062 -92,257
-18,036 -13,323 -9,031 -13,059 -19,012 -33,926 -38,015 -45,220 -79,725 -74,949 -106,626 -122,731 -156,905 -114,040
-4,601 1,410 7,060 8,772 780 -10,283 -9,299 -8,077 -30,973 -26,187 -54,516 -62,519 -91,470 -49,225
3.7 What is India’s balance on goods and
services?
3.8 What is the balance on goods, services
and income?
3.9 What is India’s current account
balance?
China’s (Mainland) Balance of Payments
China’s (Mainland) Balance of Payments
Use the following Chinese (Mainland) balance of payments data from the IMF to answer questions 3.10 through 3.13.
Assumptions (million US$) 2000 2001 2002 2003 2004 2005 2006 2007 2008 2009 2010 2011 2012 2013
3.10 Is China experiencing a net capital inflow or outflow?
3.11 What is China’s Total for Groups A and B? A. Current account balance 20,518 17,401 35,422 45,875 68,659 134,082 231,844 353,183 420,569 243,257 237,810 136,097 215,392 182,807
3.12 What is China’s Total for Groups A through C? B. Capital account balance -35 –54 -50 -48 -69 4,102 4,020 3,099 3,051 3,938 4,630 5,446 4,272 3,052
3.13 What is China’s Total for Groups A through D? C. Financial account balance 1,958 34,832 32,341 52,774 110,729 96,944 45,285 91,132 37,075 194,494 282,234 260,024 -36,038 323,151
3.14 Does China’s BOP balance? D. Net errors and omissions -11,748 -4,732 7,504 17,985 10,531 15,847 3,502 13,237 18,859 -41,181 -53,016 –13,768 -87,071 -77,628
E. Reserves and related items -10,693 -47,447 -75,217 -116,586 -189,849 -250,975 -284,651 -460,651 -479,554 -400,508 -471,658 -387,799 -96,555 -431,382
Assumptions (millions of US dollars) 2000 2001 2002 2003 2004 2005 2006 2007 2008 2009 2010 2011 2012 2013
A. Current account balance 20,518 17,401 35,422 45,875 68,659 134,082 231,844 353,183 420,569 243,257 237,810 136,097 215,392 182,807
B. Capital account balance -35 -54 -50 -48 -69 4,102 4,020 3,099 3,051 3,938 4,630 5,446 4,272 3,052
C. Financial account balance 1,958 34,832 32,341 52,774 110,729 96,944 45,285 91,132 37,075 194,494 282,234 260,024 -36,038 323,151
D. Net errors and omissions -11,748 -4,732 7,504 17,985 10,531 15,847 3,502 13,237 18,859 -41,181 -53,016 -13,768 -87,071 -77,628
E. Reserves and related items -10,693 -47,447 -75,217 -116,586 -189,849 -250,975 -284,651 -460,651 -479,554 -400,508 -471,658 -387,799 -96,555 -431,382
Questions 2000 2001 2002 2003 2004 2005 2006 2007 2008 2009 2010 2011 2012 2013
1,923 34,778 32,291 52,726 110,660 101,046 49,305 94,231 40,126 198,432 286,864 265,470 -31,766 326,203
“inflow” “inflow” “inflow” “inflow” “inflow” “inflow” “inflow” “inflow” “inflow” “inflow” “inflow” “inflow” “inflow” “inflow”
20,483 17,347 35,372 45,827 68,590 138,184 235,864 356,282 423,620 247,195 242,440 141,543 219,664 185,859
22,441 52,179 67,713 98,601 179,319 235,128 281,149 447,414 460,695 441,689 524,674 401,567 183,626 509,010
10,693 47,447 75,217 116,586 189,849 250,975 284,651 460,651 479,554 400,508 471,658 387,799 96,555 431,382
3.14 Does China’s BOP balance? 00000000000000
Yes Yes Yes Yes Yes Yes Yes Yes Yes Yes Yes Yes Yes Yes
3.10 Is China experiencing a net capital
inflow or outflow?
3.11 What is China’s Total for Groups A
and B?
3.12 What is China’s Total for Groups A
through C?
3.13 What is China’s Total for Groups A
through D?
Russia’s Balance of Payments
Russia’a (Russian Federation’s) Balance of Payments
Use the following Russian (Russian Federation) balance of payments data from the IMF to answer questions 3.14 through 3.17.
Assumptions (million US$) 2000 2001 2002 2003 2004 2005 2006 2007 2008 2009 2010 2011 2012 2013
3.15 Is Russia experiencing a net capital inflow?
3.16 What is Russia’s Total for Groups A and B? A. Current account balance 46,839 33,935 29,116 35,410 59,512 84,602 92,316 72,193 103,935 50,384 67,452 97,274 71,282 34,141
3.17 What is Russia’s Total for Groups A through C? B. Capital account balance 10,676 -9,378 -12,396 -993 -1,624 -12,764 291 -10,641 -104 -12,466 -41 130 -5,218 -395
3.18 What is Russia’s Total for Groups A through D? C. Financial account balance -34,295 -3,732 921 3,024 -5,128 1,025 3,612 97,108 -139,705 -28,162 -21,526 -76,115 -25,675 -44,983
3.19 Does Russia’s BOP balance? D. Net errors and omissions -9,297 -9,558 -6,078 -9,179 -5,870 -7,895 11,248 -9,732 -3,045 -6,392 -9,135 -8,651 -10,370 -10,842
E. Reserves and related items -13,923 -11,266 -11,563 -28,262 -46,890 -64,968 -107,466 -148,928 38,919 -3,363 -36,750 -12,638 -30,020 22,078
Assumptions (millions of US dollars) 2000 2001 2002 2003 2004 2005 2006 2007 2008 2009 2010 2011 2012 2013
A. Current account balance 46,839 33,935 29,116 35,410 59,512 84,602 92,316 72,193 103,935 50,384 67,452 97,274 71,282 34,141
B. Capital account balance 10,676 -9,378 -12,396 -993 -1,624 -12,764 291 -10,641 -104 -12,466 -41 130 -5,218 -395
C. Financial account balance -34,295 -3,732 921 3,024 -5,128 1,025 3,612 97,108 -139,705 -28,162 -21,526 -76,115 -25,675 -44,983
D. Net errors and omissions -9,297 -9,558 -6,078 -9,179 -5,870 -7,895 11,248 -9,732 -3,045 -6,392 -9,135 -8,651 -10,370 -10,842
E. Reserves and related items -13,923 -11,266 -11,563 -28,262 -46,890 -64,968 -107,466 -148,928 38,919 -3,363 -36,750 -12,638 -30,020 22,078
Questions 2000 2001 2002 2003 2004 2005 2006 2007 2008 2009 2010 2011 2012 2013
3.15 Is Russia experiencing a net capital inflow? -23,619 -13,110 -11,475 2,031 -6,752 -11,739 3,903 86,467 -139,809 -40,628 -21,567 -75,985 -30,893 -45,378
“outflow” “outflo w” “outflow” “inflow” “outflow” “outflow” “inflow” “inflow” “outflow” “outflow” “outflow” “outflow” “outflow” “outflow”
3.16 What is Russia’s Total for Groups A and B? 57,515 24,557 16,720 34,417 57,888 71,838 92,607 61,552 103,831 37,918 67,411 97,404 66,064 33,746
3.17 What is Russia’s Total for Groups A through C? 23,221 20,824 17,641 37,441 52,760 72,863 96,219 158,660 -35,874 9,756 45,885 21,289 40,389 -11,237
3.18 What is Russia’s Total for Groups A through D? 13,923 11,266 11,563 28,262 46,890 64,968 107,467 148,928 -38,919 3,364 36,750 12,638 30,019 -22,079
3.19 Does Russia’s BOP balance? 000000100100-1 -1
Yes Yes Yes Yes Yes Yes Nearly Yes Yes Yes Yes Yes Nearly Nearly
Euro Area Balance of Payments
Euro Area Balance of Payments
Euro Area Balance of Payments. Use the following Euro Area balance of payments data from the IMF to answer questions 3.18 through 3.21.
Assumptions (billion US$) 2000 2001 2002 2003 2004 2005 2006 2007 2008 2009 2010 2011 2012 2013
3.20 Is the Euro Area experiencing a net capital inflow?
3.21 What is the Euro Area’s Total for Groups A and B? A. Current account balance -81.8 -19.7 44.5 24.9 81.2 19.2 -0.3 24.9 -195.9 -12.5 12.2 16.0 171.4 305.4
3.22 What is the Euro Area’s Total for Groups A through C? B. Capital account balance 8.4 5.6 10.3 14.3 20.5 14.2 11.7 5.4 14.2 11.2 7.3 14.0 7.3 27.9
3.23 What is the Euro Area’s Total for Groups A through D? C. Financial account balance 50.9 -41.2 -15.3 -47.6 -122.9 -71.4 -28.5 -3.4 175.3 73.8 -12.2 -103.2 -213.6 -345.2
3.24 Does the Euro Area’s BOP balance? D. Net errors and omissions 6.4 38.8 -36.5 -24.4 5.6 15.0 19.6 -21.3 11.2 -12.6 -7.2 38.4 33.7 1.8
E. Reserves and related items 16.2 16.4 -3.0 32.8 15.6 23.0 -2.6 -5.7 -4.9 -59.7 -0.1 34.8 1.3 10.1
Assumptions (billions of US dollars) 2000 2001 2002 2003 2004 2005 2006 2007 2008 2009 2010 2011 2012 2013
A. Current account balance -81.8 -19.7 44.5 24.9 81.2 19.2 -0.3 24.9 -195.9 -12.5 12.2 16.0 171.4 305.4
B. Capital account balance 8.4 5.6 10.3 14.3 20.5 14.2 11.7 5.4 14.2 11.2 7.3 14.0 7.3 27.9
C. Financial account balance 50.9 -41.2 -15.3 -47.6 -122.9 -71.4 -28.5 -3.4 175.3 73.8 -12.2 -103.2 -213.6 -345.2
D. Net errors and omissions 6.4 38.8 -36.5 -24.4 5.6 15.0 19.6 -21.3 11.2 -12.6 -7.2 38.4 33.7 1.8
E. Reserves and related items 16.2 16.4 -3.0 32.8 15.6 23.0 -2.6 -5.7 -4.9 -59.7 -0.1 34.8 1.3 10.1
Questions 2000 2001 2002 2003 2004 2005 2006 2007 2008 2009 2010 2011 2012 2013
3.20 Is the Euro Area experiencing a net capital inflow? 59.3 -35.5 -5.0 -33.2 -102.4 -57.1 -16.7 2.1 189.6 84.9 -4.9 -89.2 -206.4 -317.2
“inflow” “outflow” “outflow” “outflow” “outflow” “outflow” “outflow” “inflow” “inflow” “inflow” “inflow” “inflow” “inflow” “inflow”
3.21 What is the Euro Area’s Total for Groups A and B? -73.4 -14.1 54.9 39.2 101.7 33.4 11.4 30.3 -181.7 -1.4 19.5 30.0 178.7 333.3
3.22 What is the Euro Area’s Total for Groups A through C? -22.6 -55.3 39.5 -8.3 -21.2 -38.0 -17.0 26.9 -6.3 72.4 7.3 -73.2 -35.0 -11.9
3.23 What is the Euro Area’s Total for Groups A through D? -16.2 -16.4 3.0 -32.8 -15.6 -23.0 2.5 5.7 4.9 59.8 0.1 -34.8 -1.3 -10.1
3.24 Does the Euro Area’s BOP balance? 0.0 0.0 0.0 0.0 0.0 0.0 0.0 0.0 0.0 0.0 0.0 0.0 0.0 0.0
Yes Yes Yes Yes Yes Yes Yes Yes Yes Yes Yes Yes Yes Yes
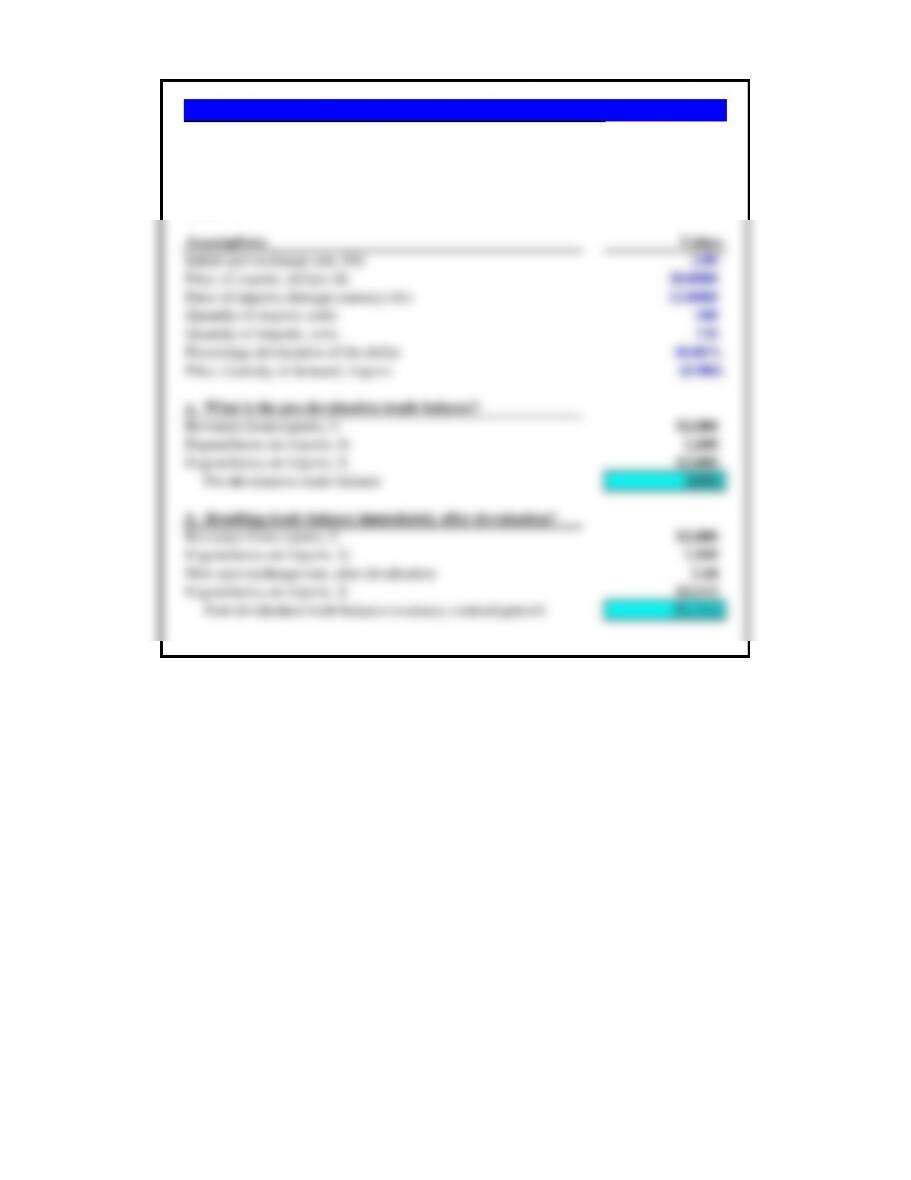
Assumptions Values
Initial spot exchange rate, $/fc 2.00
Price of exports, dollars ($) 20.0000
Price of imports, foreign currency (fc) 12.0000
Quantity of exports, units 100
Quantity of imports, units 120
Percentage devaluation of the dollar 18.00%
Price elasticity of demand, imports (0.900)
a. What is the pre-devaluation trade balance?
Revenues from exports, $ $2,000
Expenditures on imports, fc 1,440
Expenditures on imports, $ $2,880
Pre-devaluation trade balance ($880)
b. Resulting trade balance immediately after devaluation?
Revenues from exports, $ $2,000
Expenditures on imports, fc 1,440
New spot exchange rate, after devaluation 2.44
Expenditures on imports, $ $3,512
Post-devaluation trade balance (currency contract period) ($1,512)
Problem 3.25 Trade Deficits and J-Curve Adjustment Paths
Assume the United States has the following import/export volumes and prices. It
undertakes a major “devaluation” of the dollar, say 18% on average against all major
trading partner’ currencies. What is the pre-devaluation and post-devaluation trade
balance?