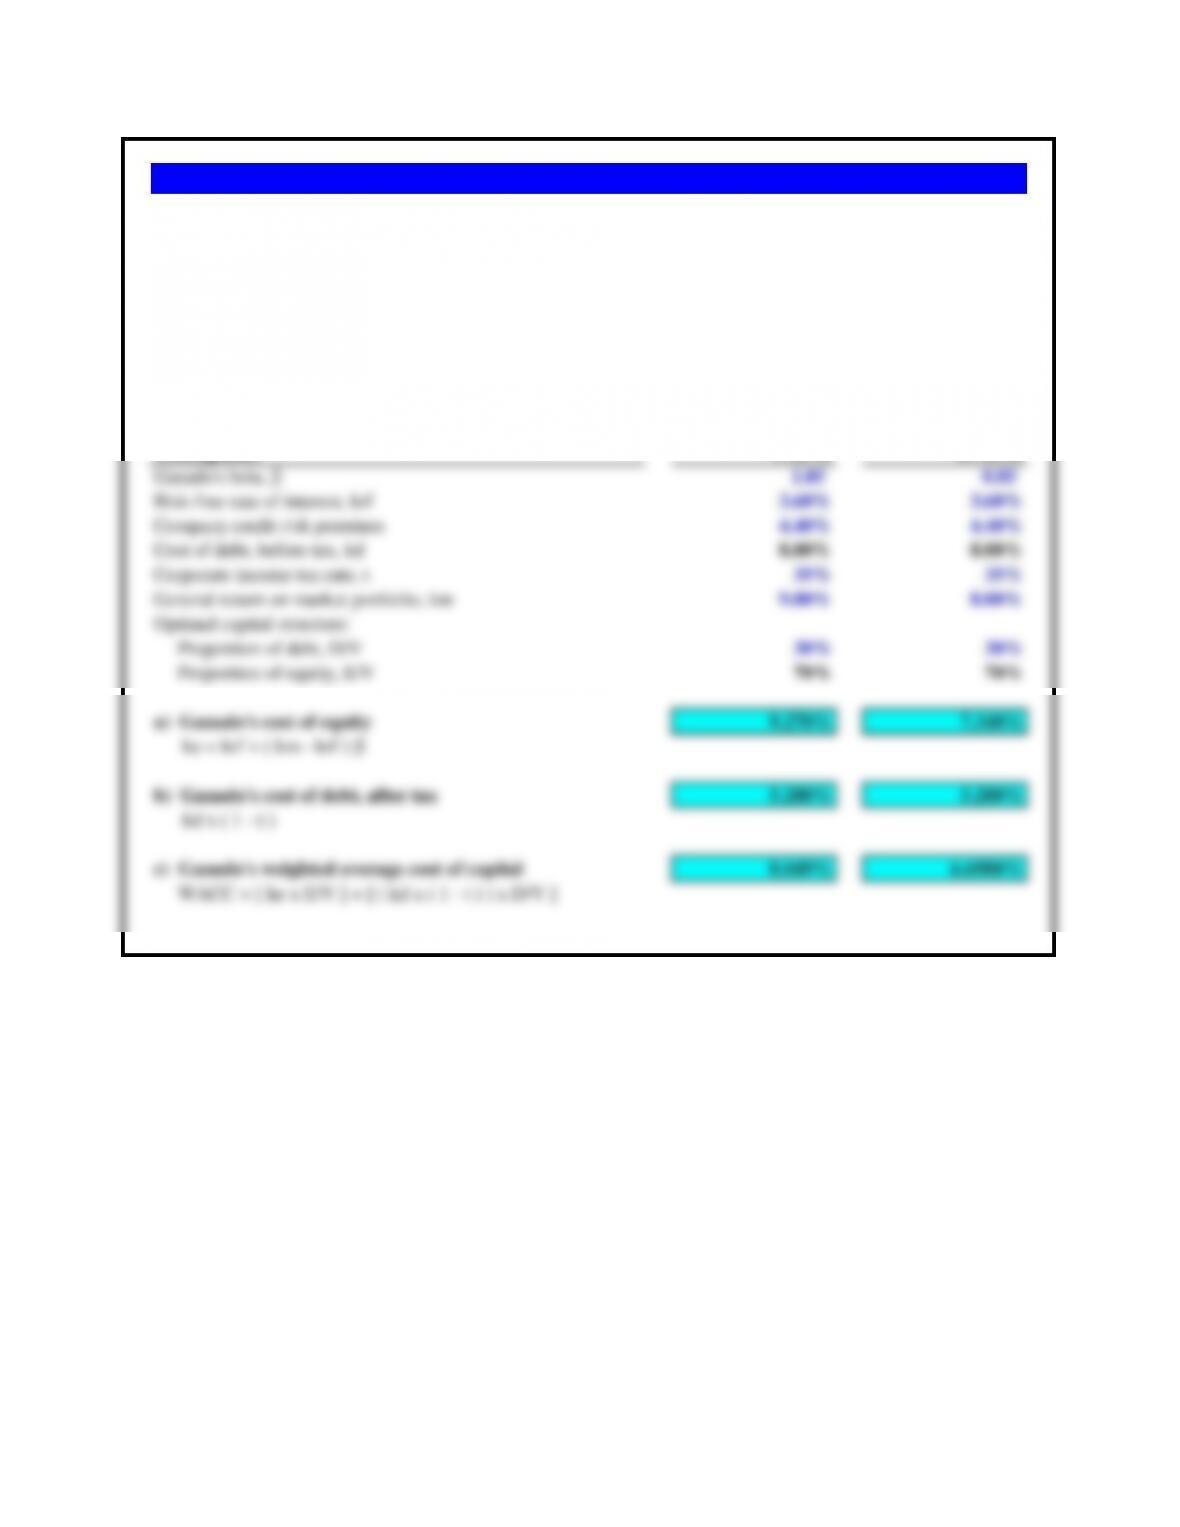
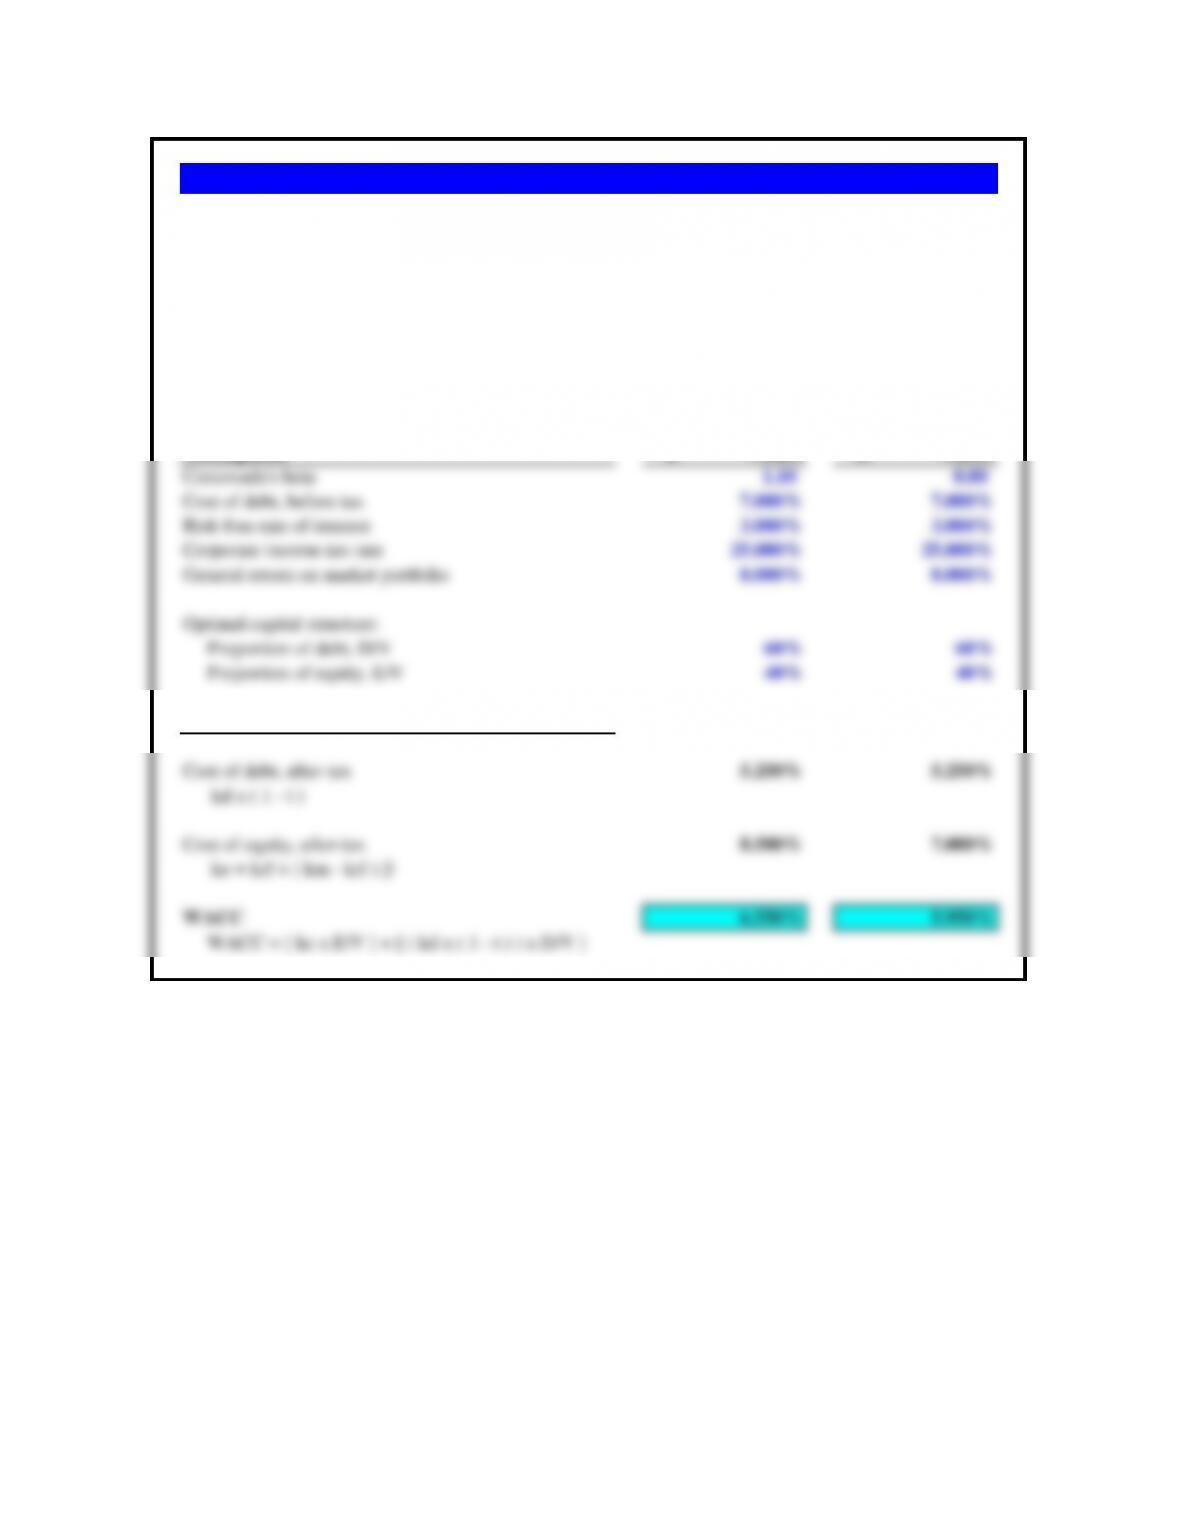
a. Ganado’s cost of equity
b. Ganado’s cost of debt
c. Ganado’s weighted average cost of capital Domestic International
Assumptions CAPM ICAPM
Ganado’s beta, β1.05 0.85
Risk-free rate of interest, krf 3.60% 3.60%
Company credit risk premium 4.40% 4.40%
Cost of debt, before tax, kd 8.00% 8.00%
Corporate income tax rate, t 35% 35%
General return on market portfolio, km 9.00% 8.00%
Optimal capital structure:
Proportion of debt, D/V 30% 30%
Proportion of equity, E/V 70% 70%
a) Ganado’s cost of equity 9.270% 7.340%
ke = krf + ( km – krf ) β
b) Ganado’s cost of debt, after tax 5.200% 5.200%
kd x ( 1 – t )
c) Ganado’s weighted average cost of capital 8.049% 6.6980%
WACC = [ ke x E/V ] + [ ( kd x ( 1 – t ) ) x D/V ]
Problem 13.1 Ganado’s Cost of Capital
Market conditions have changed. Maria Gonzalez now estimates the risk-free rate to be 3.60%, the company‘s
credit risk premium is 4.40%, the domestic beta is estimated at 1.05, the international beta at .85, and the
company‘s capital structure is now 30% debt. All other values remain the same. For both the domestic CAPM
and ICAPM, calculate:
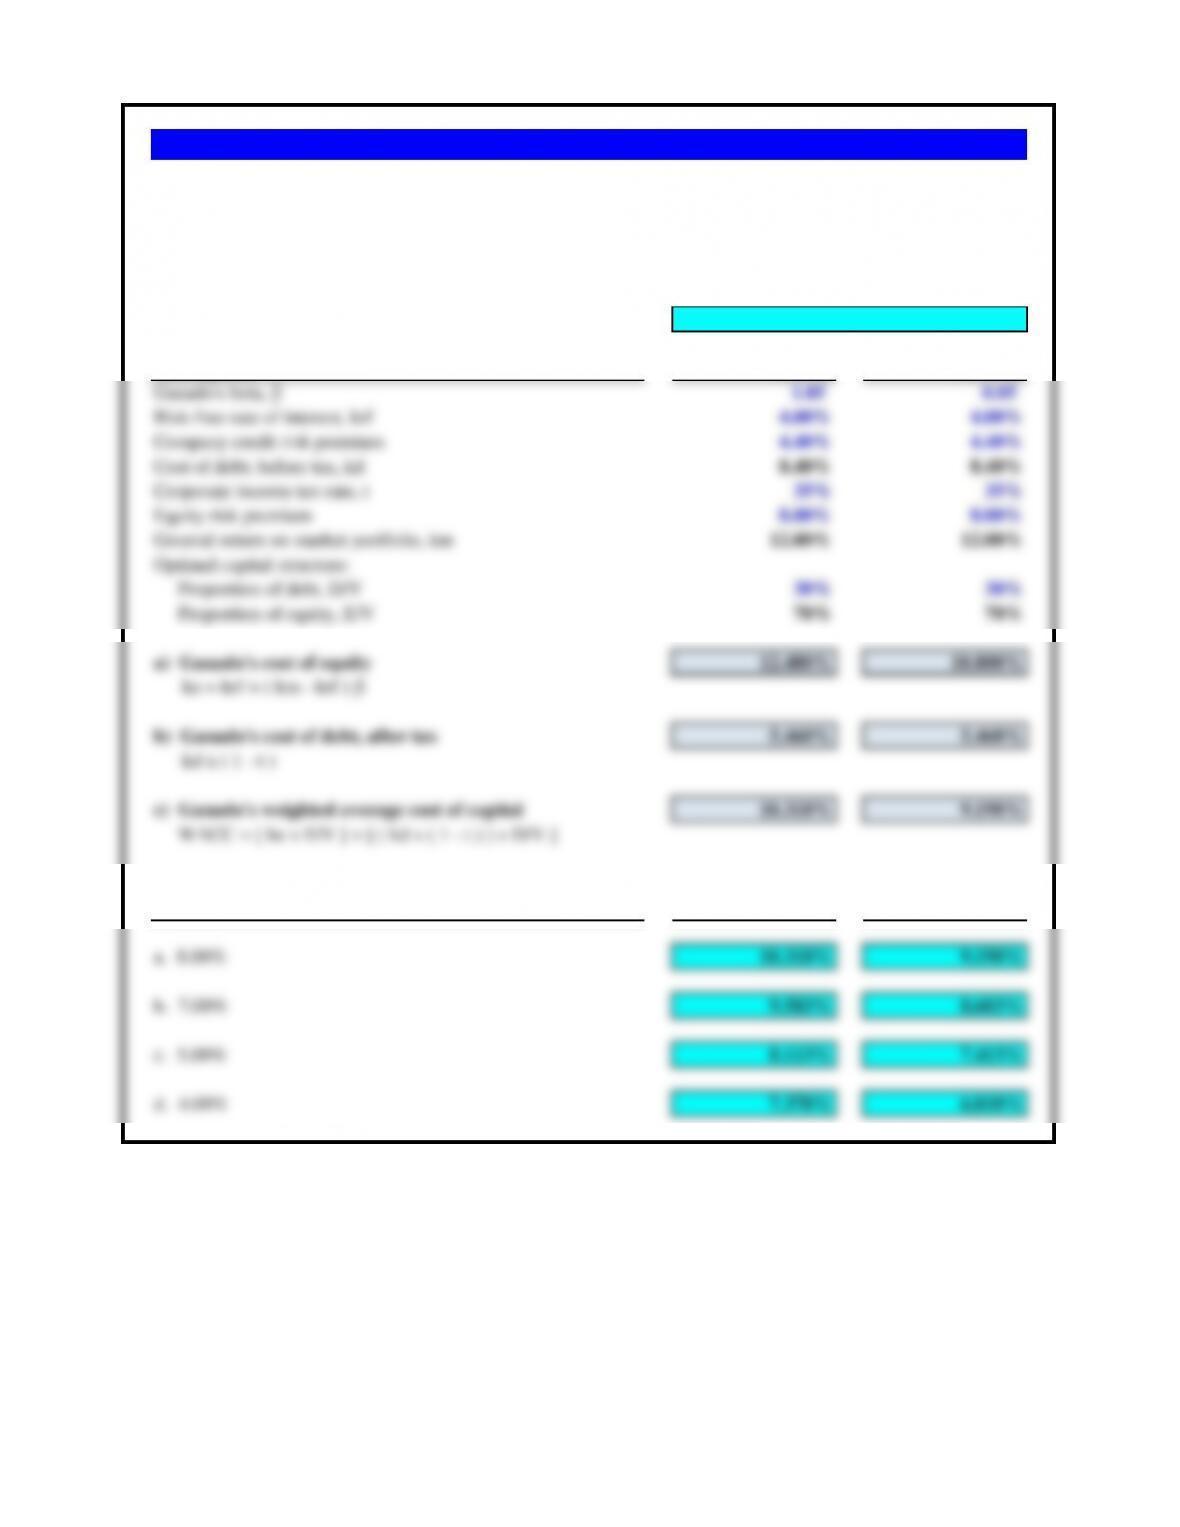
a. 8.00% c. 5.00%
b. 7.00% d. 4.00%
Domestic International
Assumptions CAPM ICAPM
Ganado’s beta, β1.05 0.85
Risk-free rate of interest, krf 4.00% 4.00%
Company credit risk premium 4.40% 4.40%
Cost of debt, before tax, kd 8.40% 8.40%
Corporate income tax rate, t 35% 35%
Equity risk premium 8.00% 8.00%
General return on market portfolio, km 12.00% 12.00%
Optimal capital structure:
Proportion of debt, D/V 30% 30%
Proportion of equity, E/V 70% 70%
a) Ganado’s cost of equity 12.400% 10.800%
ke = krf + ( km – krf ) β
b) Ganado’s cost of debt, after tax 5.460% 5.460%
kd x ( 1 – t )
c) Ganado’s weighted average cost of capital 10.318% 9.198%
WACC = [ ke x E/V ] + [ ( kd x ( 1 – t ) ) x D/V ]
Differing Equity Risk Premiums CAPM ICAPM
a. 8.00% 10.318% 9.198%
b. 7.00% 9.583% 8.603%
c. 5.00% 8.113% 7.413%
d. 4.00% 7.378% 6.818%
Problem 13.2 Ganado and Equity Risk Premiums
Using the original cost of capital data for Ganado used in the chapter, calculate both the CAPM and ICAPM
costs of capital for the following equity risk premium estimates.
Answer for part a
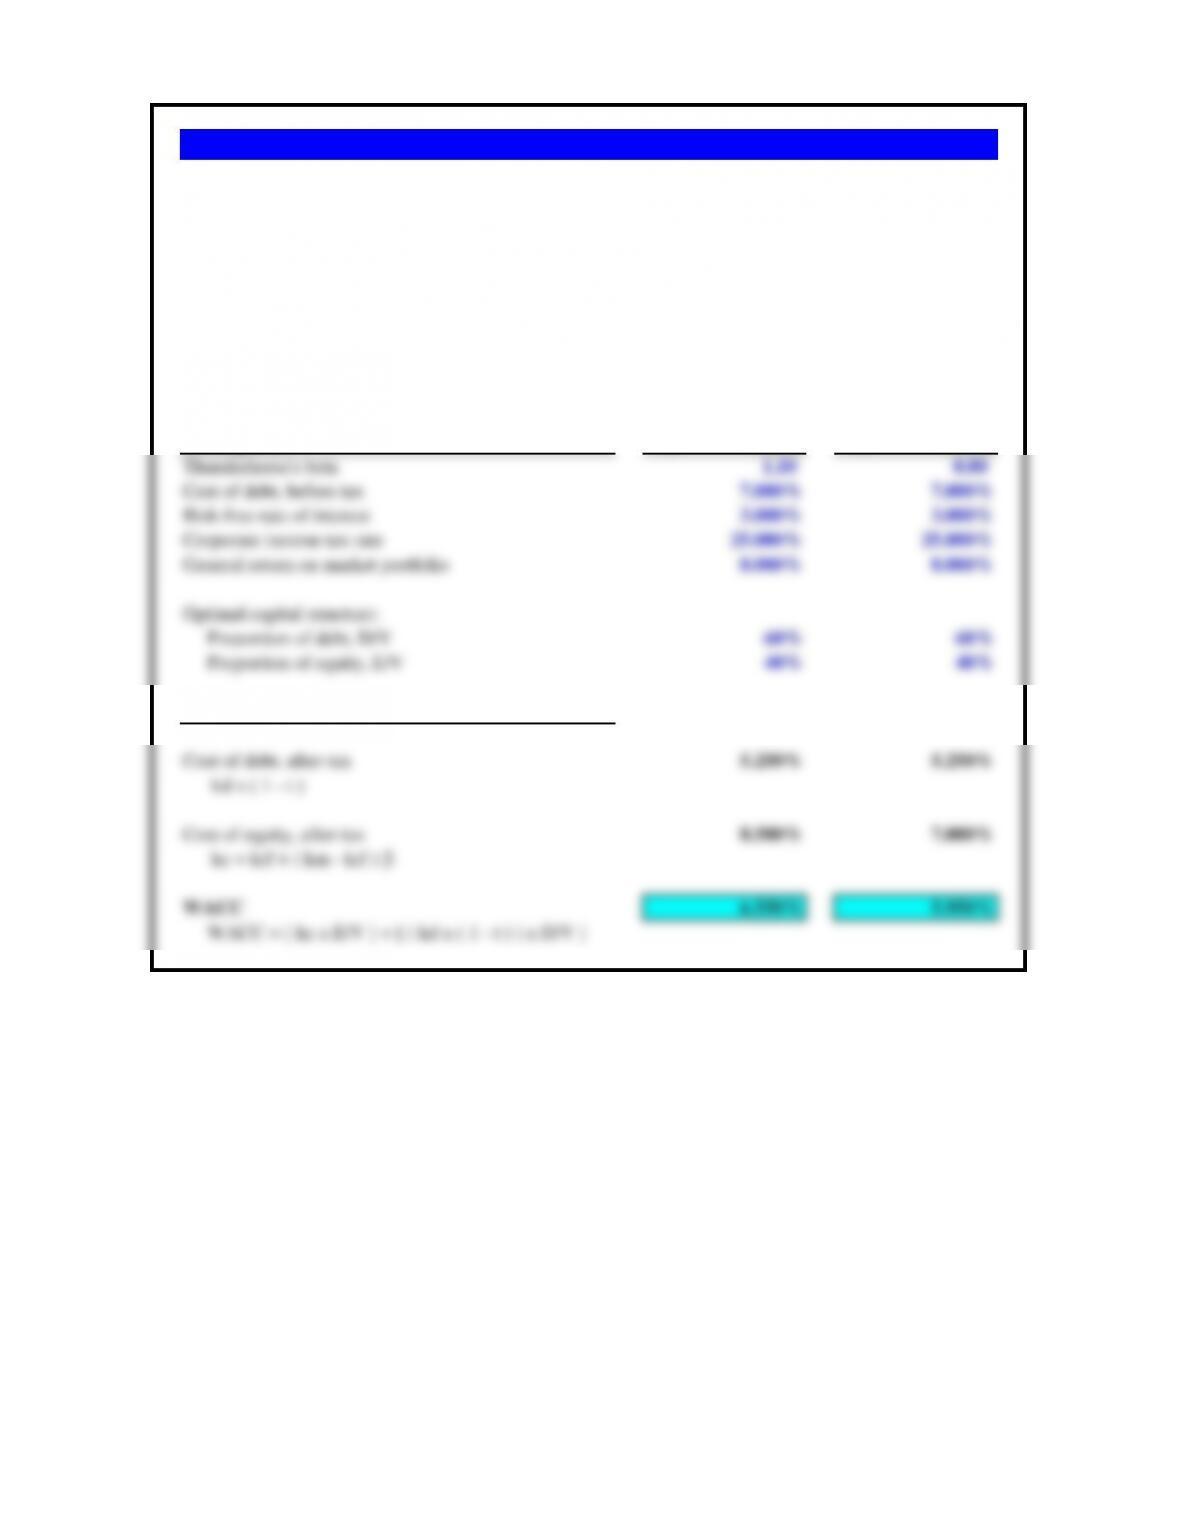
a. If Thunderhorse beta is estimated at 1.1, what is its weighted average cost of capital?
Assumptions a) Values b) Values
Thunderhorse’s beta 1.10 0.80
Cost of debt, before tax 7.000% 7.000%
Risk-free rate of interest 3.000% 3.000%
Corporate income tax rate 25.000% 25.000%
General return on market portfolio 8.000% 8.000%
Optimal capital structure:
Proportion of debt, D/V 60% 60%
Proportion of equity, E/V 40% 40%
Calculation of the WACC
Cost of debt, after-tax 5.250% 5.250%
kd x ( 1 – t )
Cost of equity, after-tax 8.500% 7.000%
ke = krf + ( km – krf ) β
WACC 6.550% 5.950%
WACC = [ ke x E/V ] + [ ( kd x ( 1 – t ) ) x D/V ]
Problem 13.3 Thunderhose Oil
b. If Thunderhorse’s beta is estimated at 0.8, significantly lower because of the continuing profit
prospects in the global energy sector, what is the company’s weighted average cost of capital?
Thunderhorse Oil is a U.S. oil company. Its current cost of debt is 7%, and the 10-year U.S. Treasury
yield, the proxy for the risk-free rate of interest, is 3%. The expected return on the market portfolio is
8%. The company‘s effective tax rate is 39%. Its optimal capital structure is 60% debt and 40% equity.
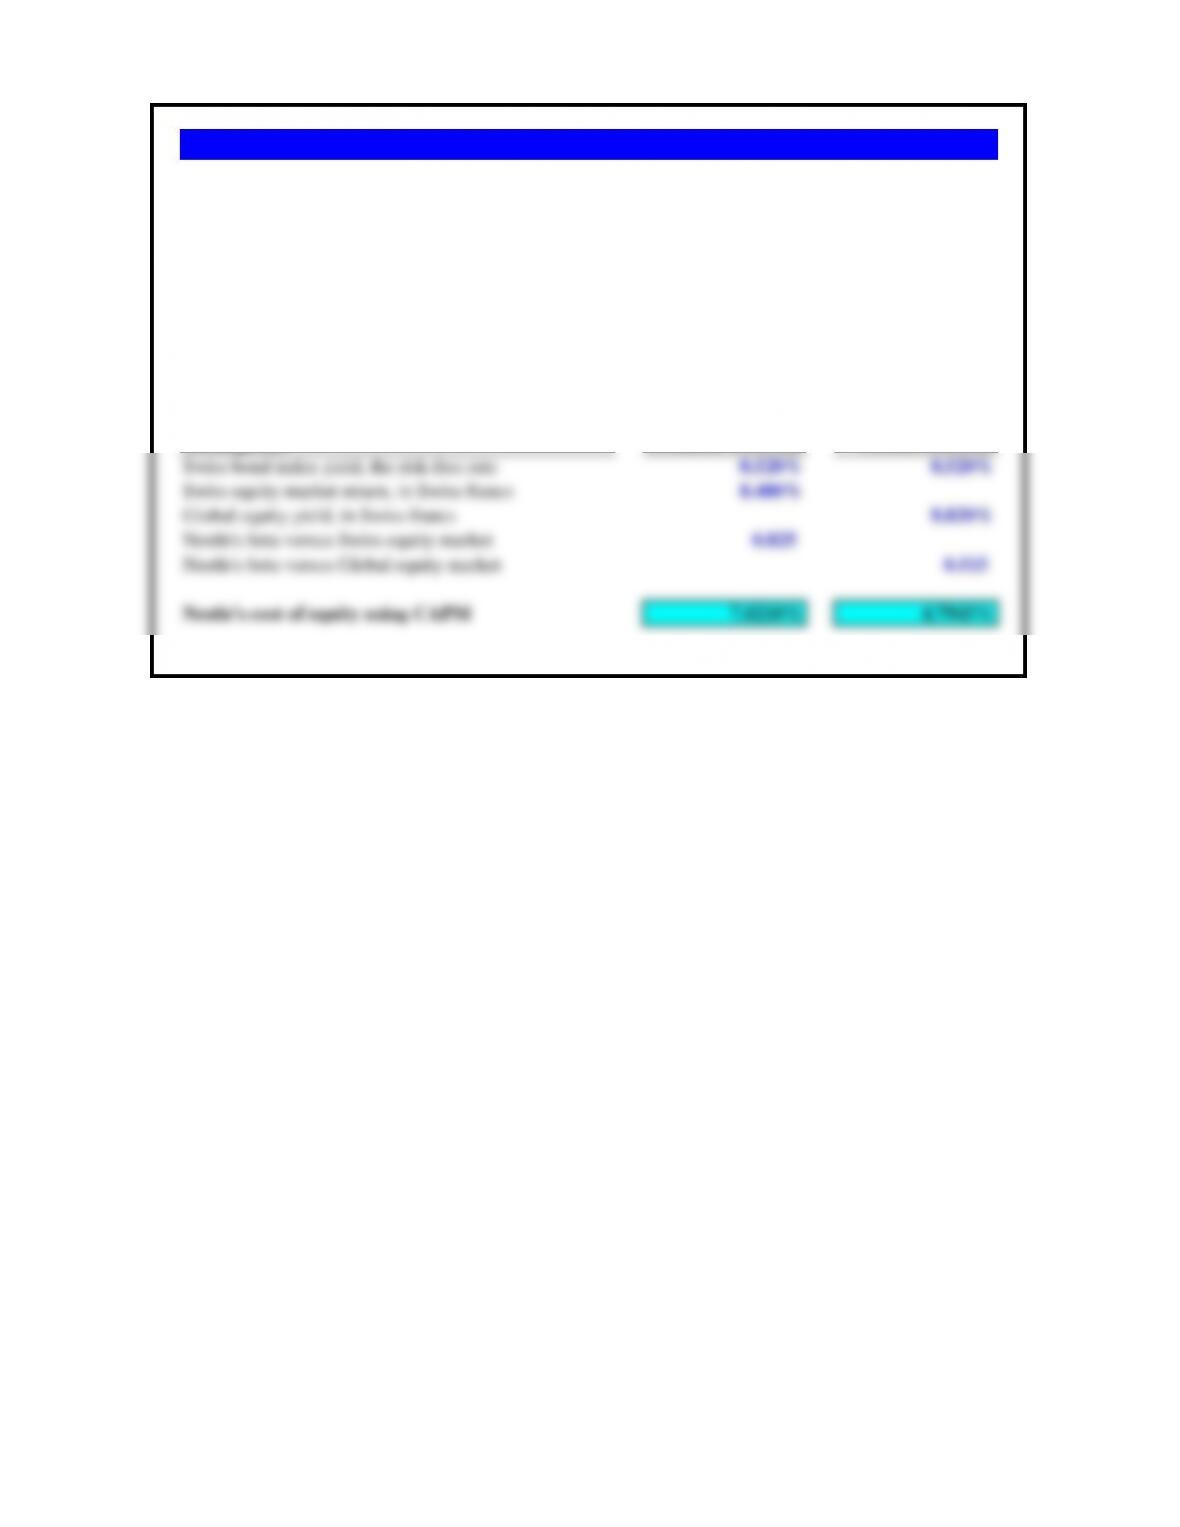
a. What is Nestle’s cost of equity based on the domestic portfolio of a Swiss investor?
b. What is Nestle’s cost of equity based on a global portfolio for a Swiss investor?
Assumptions Domestic Portfolio Global Portfolio
Swiss bond index yield, the risk-free rate 0.520% 0.520%
Swiss equity market return, in Swiss francs 8.400%
Global equity yield, in Swiss francs 8.820%
Nestle’s beta versus Swiss equity market 0.825
Nestle’s beta versus Global equity market 0.515
Nestle’s cost of equity using CAPM 7.0210% 4.7945%
Problem 13.4 Nestle of Switzerland Revisited
Nestle of Switzerland is revisiting its cost of equity analysis in 2014. As a result of extraordinary actions
by the Swiss Central Bank, the Swiss bond index yield (10-year maturity) has dropped to a record low of
0.520%. The Swiss equity markets have been averaging 8.400% returns, while the Financial Times
global equity market returns, indexed back to Swiss francs, is at 8.820%. Nestle’s corporate treasury staff
has estimated the company’s domestic beta at 0.825, but its global beta (against the larger global equity
market portfolio) at .515.
a. If Corcovado’s beta is estimated at 1.1, what is its weighted average cost of capital?
Assumptions a. Values b. Values
Corcovado’s beta 1.10 0.80
Cost of debt, before tax 7.000% 7.000%
Risk-free rate of interest 3.000% 3.000%
Corporate income tax rate 25.000% 25.000%
General return on market portfolio 8.000% 8.000%
Optimal capital structure:
Proportion of debt, D/V 60% 60%
Proportion of equity, E/V 40% 40%
Calculation of the WACC
Cost of debt, after-tax 5.250% 5.250%
kd x ( 1 – t )
Cost of equity, after-tax 8.500% 7.000%
ke = krf + ( km – krf ) β
WACC 6.550% 5.950%
WACC = [ ke x E/V ] + [ ( kd x ( 1 – t ) ) x D/V ]
Problem 13.5 Corcovado Pharmaceuticals
Corcovado Pharmaceutical’s cost of debt is 7%. The risk-free rate of interest is 3%. The expected return
on the market portfolio is 8%. After effective taxes, Corcovado’s effective tax rate is 25%. Its optimal
capital structure is 60% debt and 40% equity.
b. If Corcovado’s beta is estimated at 0.8, significantly lower because of the continuing profit prospects
in the global energy sector, what is its weighted average cost of capital?
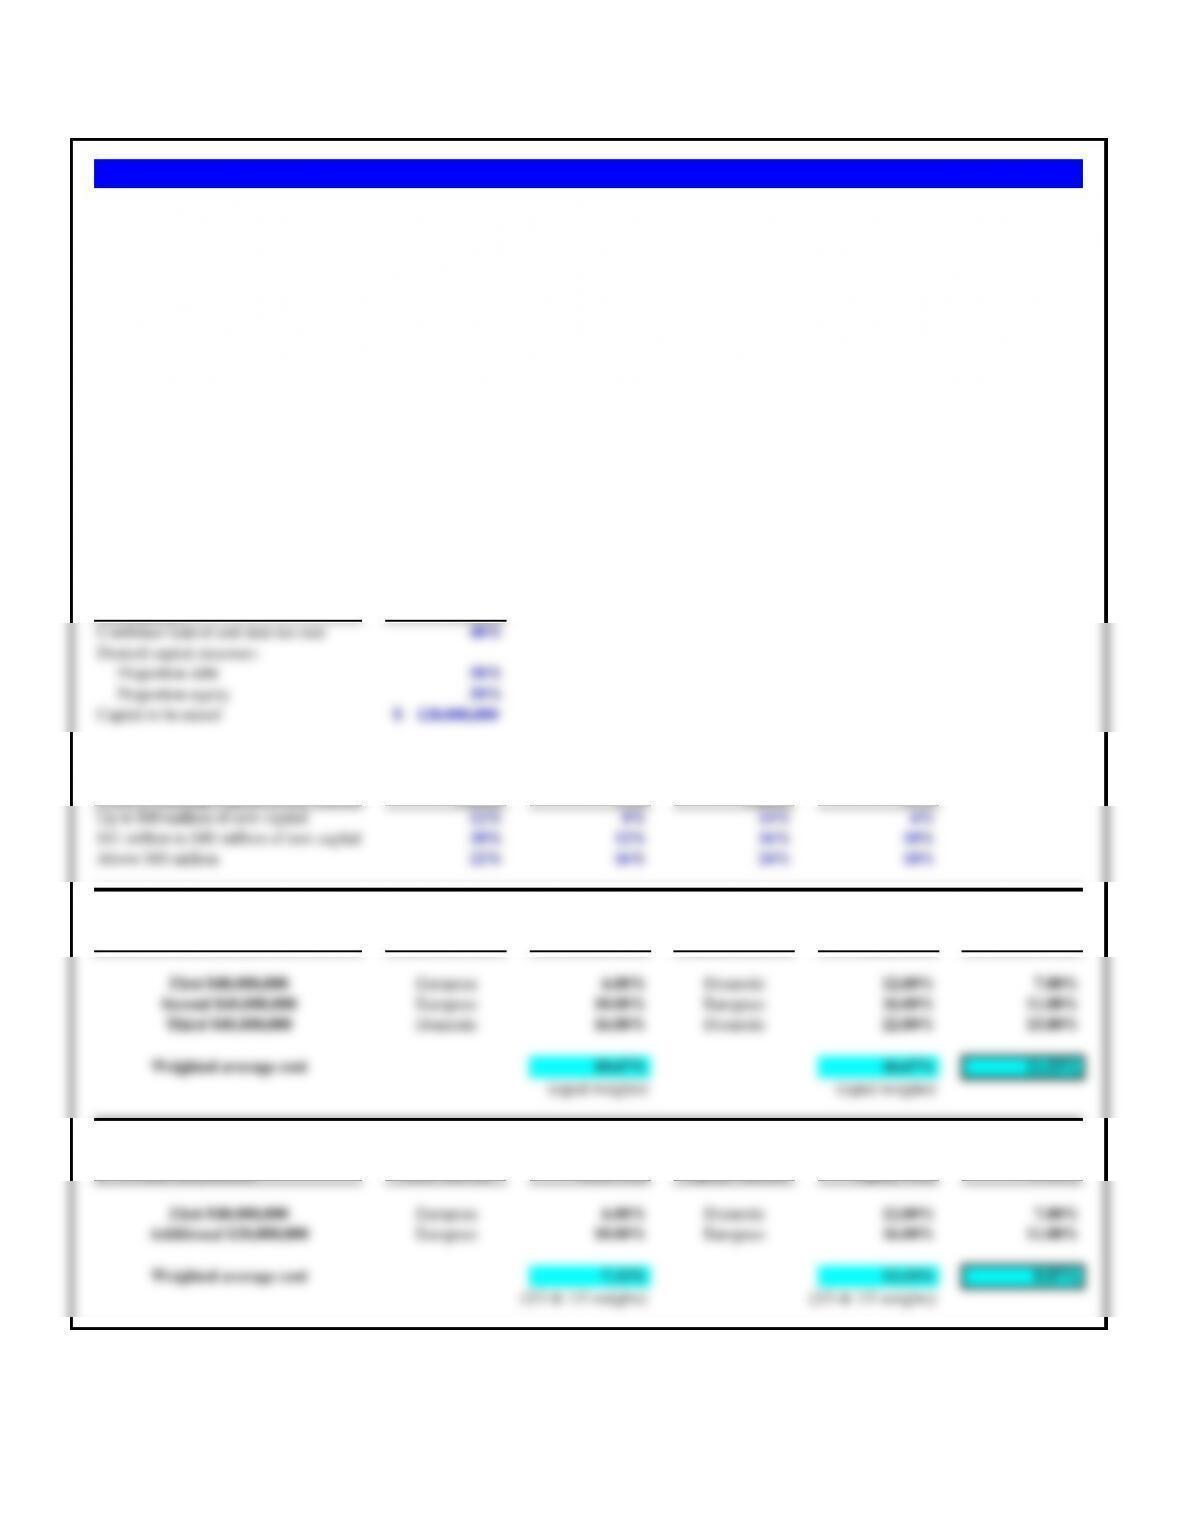
Assumptions Values
Combined federal and state tax rate 40%
Desired capital structure:
Proportion debt 50%
Proportion equity 50%
Capital to be raised 120,000,000$
Cost of Cost of Cost of Cost of
Domestic Domestic European European
Costs of Raising Capital in the Market Equity Debt Equity Debt
Up to $40 million of new capital 12% 8% 14% 6%
Incremental
a. To raise $120,000,000 Debt Market Debt Cost Equity Market Equity Cost WACC
First $40,000,000 European 6.00% Domestic 12.00% 7.80%
Second $40,000,000 European 10.00% European 16.00% 11.00%
Weighted average cost 10.67% 16.67% 11.53%
(equal weights) (equal weights)
Incremental
b. To raise $60,000,000 Debt Market Debt Cost Equity Market Equity Cost WACC
Weighted average cost 7.33% 13.33% 8.87%
(2/3 & 1/3 weights) (2/3 & 1/3 weights)
Problem 13.6 WestGas Conveyance, Inc.
A London bank advises WestGas that U.S. dollars could be raised in Europe at the following costs, also in multiples of $20 million, while maintaining
the 50/50 capital structure.
b. If WestGAs plans an expansion of only $60 million, how should that expansion be financed? What will be the weighted average cost of capital for
the expansion?
Each increment of cost would be influenced by the total amount of capital raised. That is, if WestGas first borrowed $20 million in the European market
at 6% and matched this with an additional $20 million of equity, additional debt beyond this amount would cost 12% in the United States and 10% in
Europe. The same relationship holds for equity financing.
a. Calculate the lowest average cost of capital for each increment of $40 million of new capital, where WestGas raises $20 million in the equity market
and an additional $20 in the debt market at the same time.
WestGas Conveyance, Inc., is a large U.S. natural gas pipeline company that wants to raise $120 million to finance expansion. WestGas wants a capital
structure that is 50% debt and 50% equity. Its corporate combined federal and state income tax rate is 40%. WestGas finds that it can finance in the
domestic U.S. capital market at the rates listed below. Both debt and equity would have to be sold in multiples of $20 million, and these cost figures
show the component costs, each, of debt and equity if raised half by equity and half by debt.
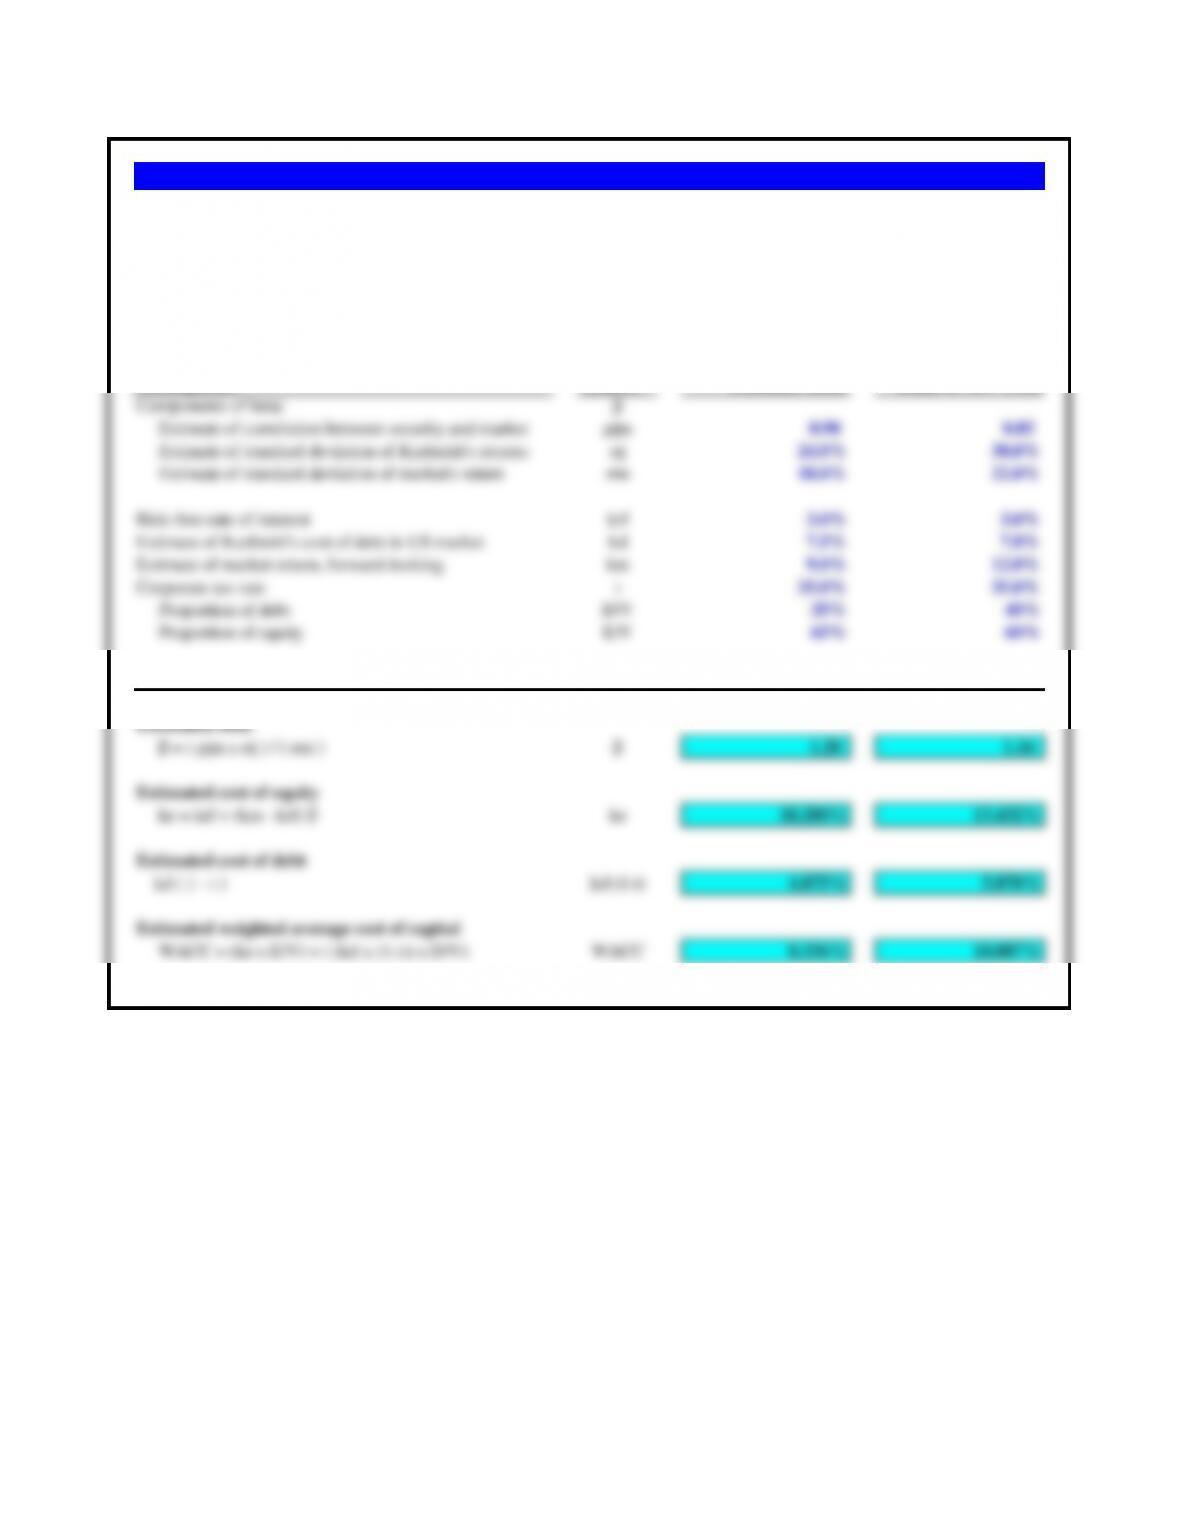
Assumptions Symbol Goldman Sachs Bank of New York
Components of beta: β
Estimate of correlation between security and market
ρjm 0.90 0.85
Estimate of standard deviation of Kashmiri‘s returns σj 24.0% 30.0%
Estimate of standard deviation of market‘s return
σm18.0% 22.0%
Risk-free rate of interest krf 3.0% 3.0%
Estimate of Kashmiri’s cost of debt in US market kd 7.5% 7.8%
Estimate of market return, forward-looking km 9.0% 12.0%
Corporate tax rate t 35.0% 35.0%
Proportion of debt D/V 35% 40%
Proportion of equity E/V 65% 60%
Estimating Costs of Capital
Estimated beta
β = ( ρjm x σj ) / ( σm ) β1.20 1.16
Estimated cost of equity
ke = krf + (km – krf) βke 10.200% 13.432%
Estimated cost of debt
kd ( 1 – t ) kd (1-t) 4.875% 5.070%
Problem 13.7 Kashmiri’s Cost of Capital
Kashmiri is the largest and most successful specialty goods company based in Bangalore, India. It has not entered the North
American marketplace yet, but is considering establishing both manufacturing and distribution facilities in the United States
through a wholly owned subsidiary. It has approached two different investment banking advisors, Goldman Sachs and Bank of
New York, for estimates of what its costs of capital would be several years into the future when it planned to list its American
subsidiary on a U.S. stock exchange. Using the following assumptions by the two different advisors, calculate the prospective
costs of debt, equity, and the WACC for Kashmiri (U.S.),
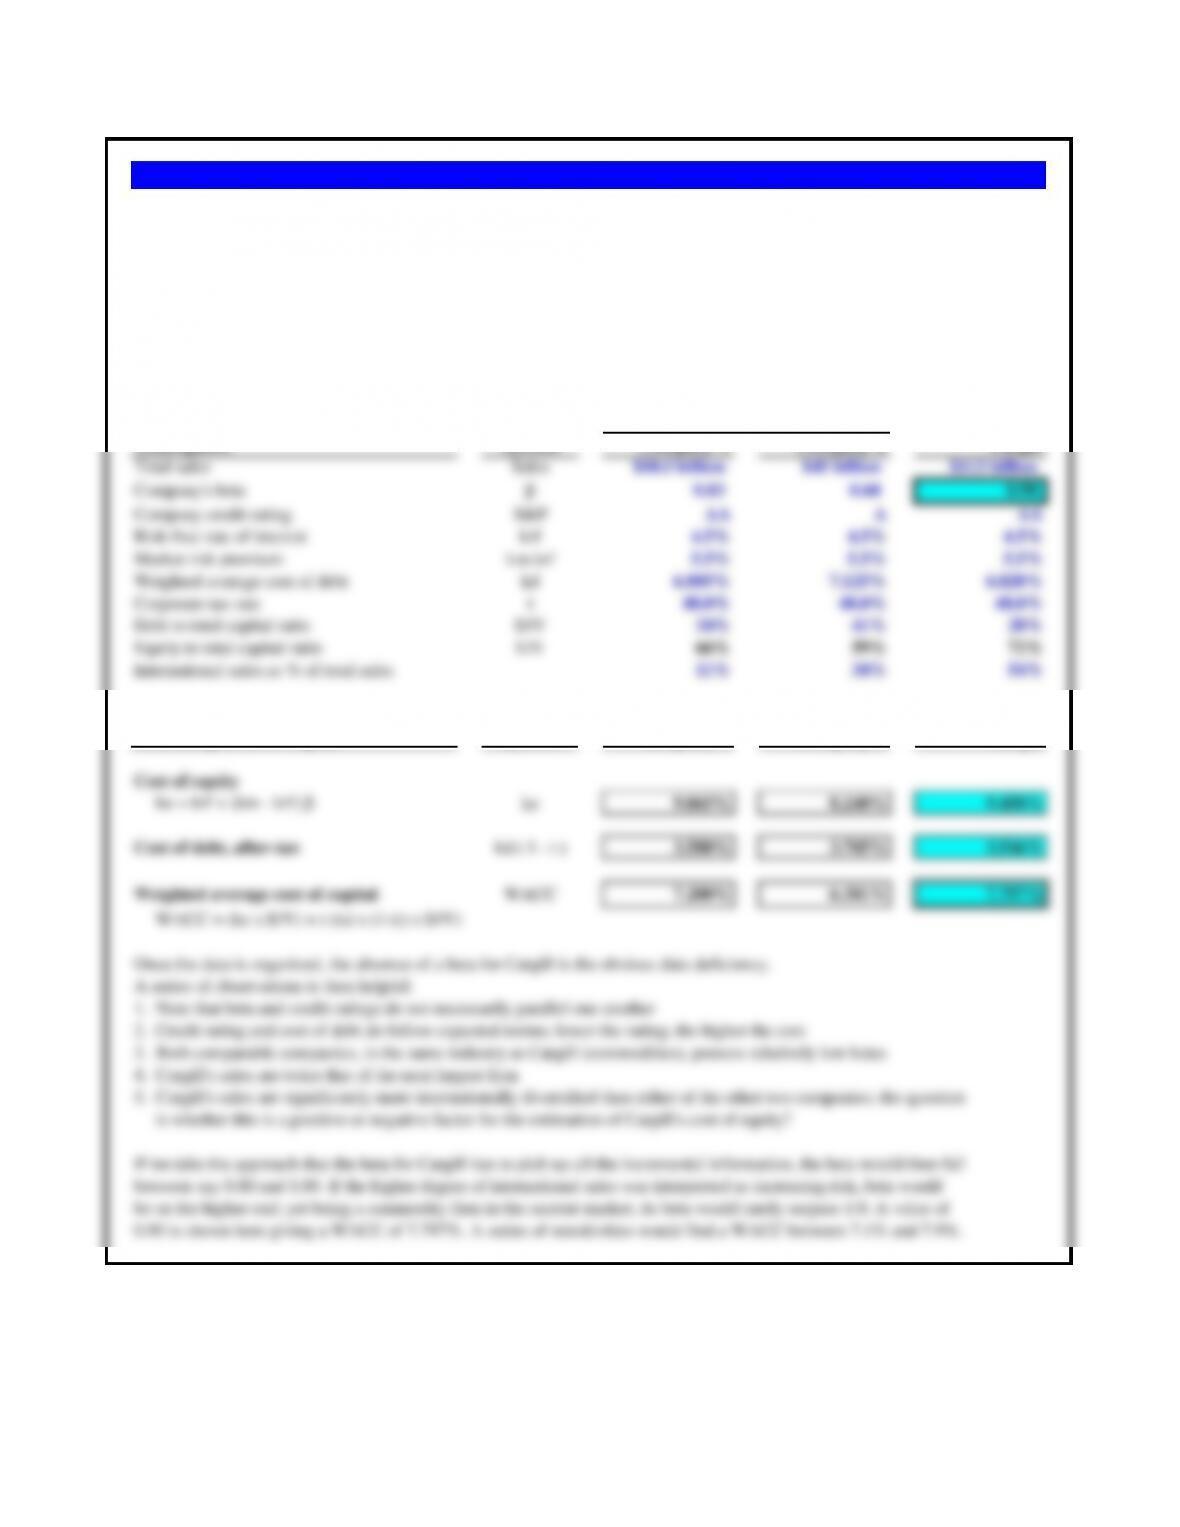
Assumptions Symbol Company A Company B Cargill
Total sales Sales
$10.5 billion $45 billion $113 billion
Company‘s beta β
0.83 0.68 0.90
Company credit rating S&P AA AAA
Risk-free rate of interest krf 4.5% 4.5% 4.5%
Market risk premium km-krf 5.5% 5.5% 5.5%
Weighted average cost of debt kd 6.885% 7.125% 6.820%
Corporate tax rate t 48.0% 48.0% 48.0%
Debt to total capital ratio D/V 34% 41% 28%
Equity to total capital ratio E/V 66% 59% 72%
International sales as % of total sales 11% 34% 54%
Once the data is organized, the absence of a beta for Cargill is the obvious data deficiency.
A series of observations is then helpful:
1. Note that beta and credit ratings do not necessarily parallel one another
2. Credit rating and cost of debt do follow expected norms; lower the rating, the higher the cost
Problem 13.8 Cargill’s Cost of Capital
Comparables
Cargill is generally considered to be the largest privately held company in the world. Headquartered in Minneapolis, Minnesota,
the company has been averaging sales of over $113 billion per year over the past 5 year period. Although the company does not
have publicly traded shares, it is still extremely important for it to calculate its weighted average cost of capital properly in order
to make rational decisions on new investment proposals.
Assuming a risk-free rate of 4.50%, an effective tax rate of 48%, and a market risk premium of 5.50%, estimate the weighted
average cost of capital first for companies A and B, and then make a ‘guestimate’ of what you believe a comparable WACC
would be for Cargill.
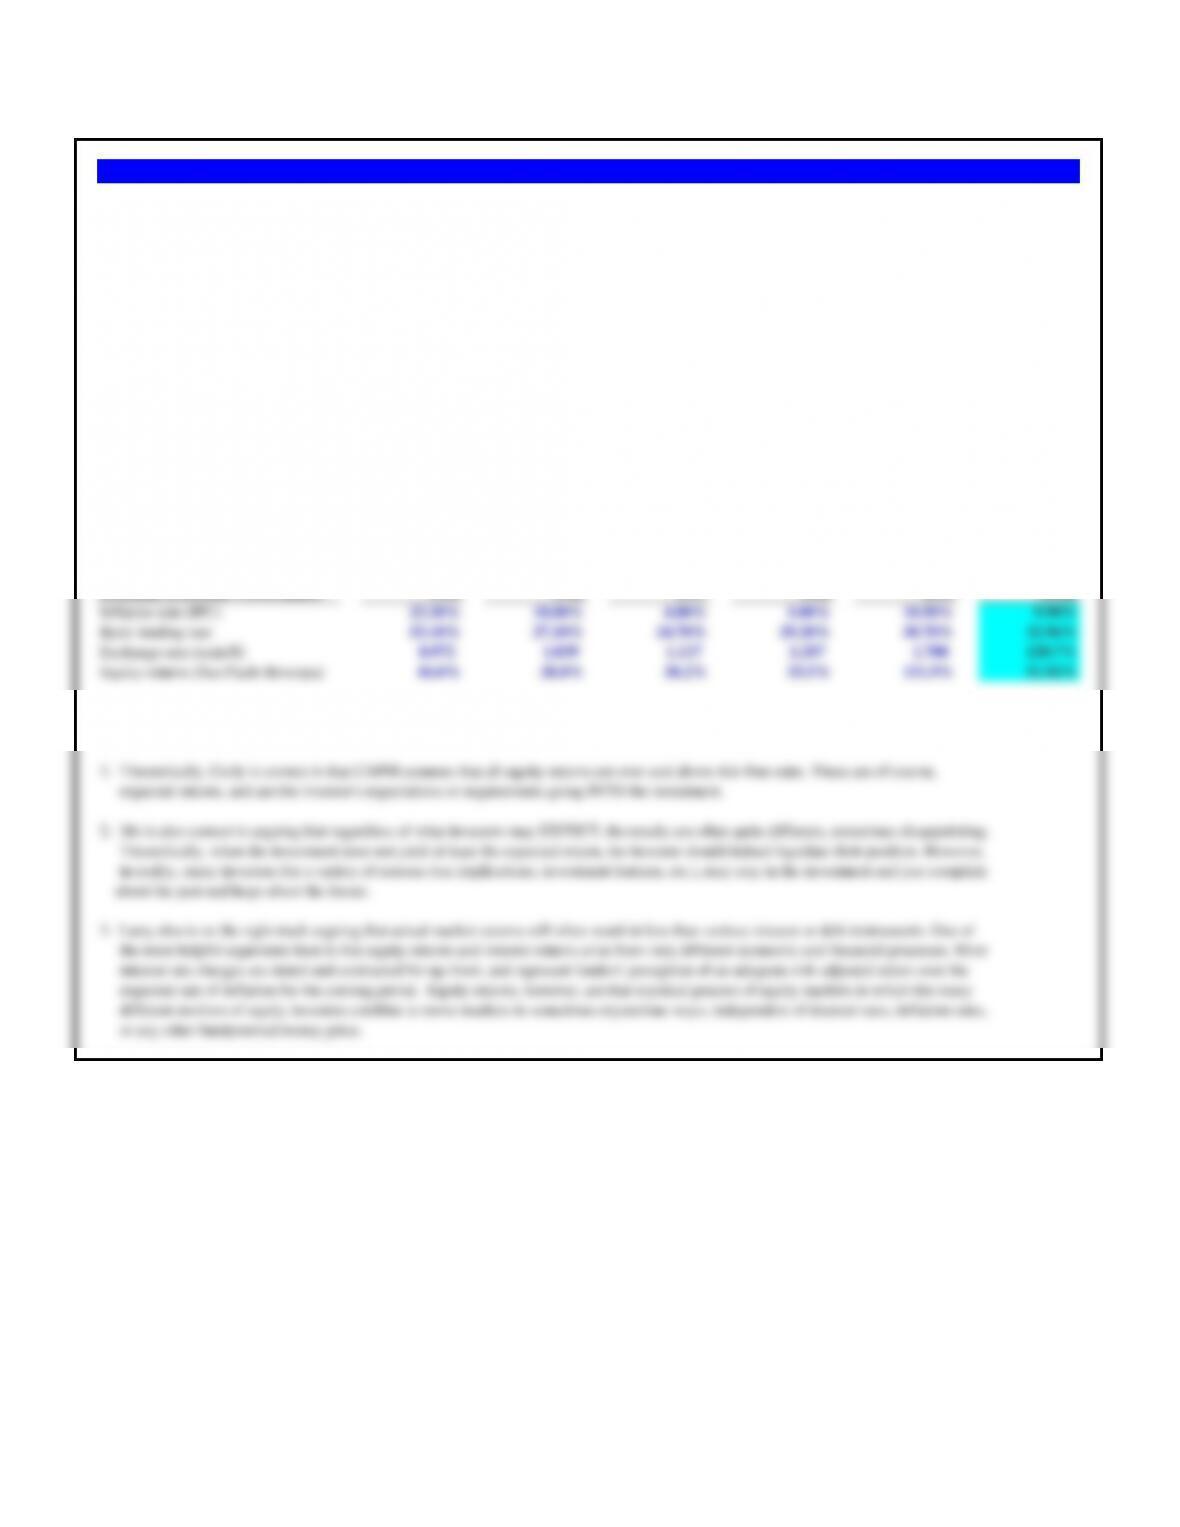
Brazilian Economic Performance 1995 1996 1997 1998 1999 Mean
Inflation rate (IPC) 23.20% 10.00% 4.80% 1.00% 10.50% 9.90%
Bank lending rate 53.10% 27.10% 24.70% 29.20% 30.70% 32.96%
Exchange rate (reais/$) 0.972 1.039 1.117 1.207 1.700 120.7%
Equity returns (Sao Paulo Bovespa) 16.0% 28.0% 30.2% 33.5% 151.9% 51.92%
All three are on the right track. It is mostly a matter of finding the linkages beween their individual arguments.
1. Theoretically, Curly is correct in that CAPM assumes that all equity returns are over and above risk-free rates. These are of course,
expected returns, and are the investor’s expectations or requirements going INTO the investment.
2. Mo is also correct in arguing that regardless of what investors may EXPECT, the results are often quite different, sometimes disappointing.
Theoretically, when the investment does not yield at least the expected return, the investor should indeed liquidate their position. However,
in reality, many investors for a variety of reasons (tax implications, investment horizon, etc.), may stay in the investment and just complain
about the past and hope about the future.
3. Larry also is on the right track arguing that actual market returns will often result in less than various interest or debt instruments. One of
the more helpful arguments here is that equity returns and interest returns arise from very different economic and financial processes. Most
interest rate charges are stated and contracted for up-front, and represent lenders’ perception of an adequate risk-adjusted return over the
expected rate of inflation for the coming period. Equity returns, however, are that mystical process of equity markets in which the many
different motives of equity investors combine to move markets in sometimes mysterious ways, independent of interest rates, inflation rates,
or any other fundamental money price.
Problem 13.9 The Tombs
At this point both Larry and Mo simply stared at Curly, paused, and both ordered another beer. Using the Brazilian data presented, comment on this week’s
debate at the Tombs.
Larry argues that “its all about expected versus delivered. You can talk about what equity investors expect, but they often find that what is delivered for
years at a time is so small – even sometimes negative – that in effect the cost of equity is cheaper than the cost of debt.”
Curly is the theoretician. “Ladies, this is not about empirical results; it is about the fundamental concept of risk-adjusted returns. An investor in equities
knows he will reap returns only after all compensation has been made to debt-providers. He is therefore always subject to a higher level of risk to his return
than debt instruments, and as the capital asset pricing model states, equity investors set their expected returns as a risk-adjusted factor over and above the
returns to risk-free instruments.”
Moe – interrupts: “But you’re missing the point. The cost of capital is what the investor requires in compensation for the risk taken going into the
investment. If he doesn’t end up getting it, and that was happening here, then he pulls his capital out and walks.”
You have joined your friends at the local watering hole, The Tombs, for your weekly debate on international finance. The topic this week is whether the
cost of equity can ever be cheaper than the cost of debt. The group has chosen Brazil in the mid-1990s as the subject of the debate. One of the group
members has torn the following table of data out of a book, which is then the subject of the analysis.
Before After
Assumptions Symbol Diversification Diversification
Correlation between G-H and the market
ρjm 0.88 0.76
Standard deviation of G-H’s returns σj 28.0% 26.0%
Standard deviation of market’s returns
σm18.0% 18.0%
Risk-free rate of interest krf 3.0% 3.0%
Additional equity risk premium for internationalization RPM 0.0% 3.0%
Estimate of G-H’s cost of debt in US market kd 7.2% 7.0%
Market risk premium km-krf 5.5% 5.5%
Corporate tax rate t 35.0% 35.0%
Proportion of debt D/V 38% 32%
Proportion of equity E/V 62% 68%
Estimating Costs of Capital
Estimated beta
β = ( ρjm x σj ) / ( σm ) β1.37 1.10
Estimated cost of equity
ke = krf + (km – krf) βke 10.529% 9.038%
ke* = krf + (km – krf) β + RPM ke + RPM 10.529% 12.038%
indeed higher, 12.038% to the before value of 10.529%.
Problem 13.10 Genedak-Hogan Cost of Equity
Use the following information to answer questions 10 through 12. Genedak-Hogan is an American conglomerate which is actively
debating the impacts of international diversification of its operations on its capital structure and cost of capital. The firm is planning
on reducing consolidated debt after diversification.
Senior management at Genedak-Hogan is actively debating the implications of diversification on its cost of equity. Although both
parties agree that the company’s returns will be less correlated with the reference market return in the future, the financial advisors
believe that the market will assess an additional 3.0% risk premium for ‘going international’ to the basic CAPM cost of equity.
Calculate Genedak-Hogan’s cost of equity before and after international diversification of its operations, with and without the
hypothetical additional risk premium, and comment on the discussion.
Calculate the weighted average cost of capital for Genedak-Hogan for before and after international diversification.
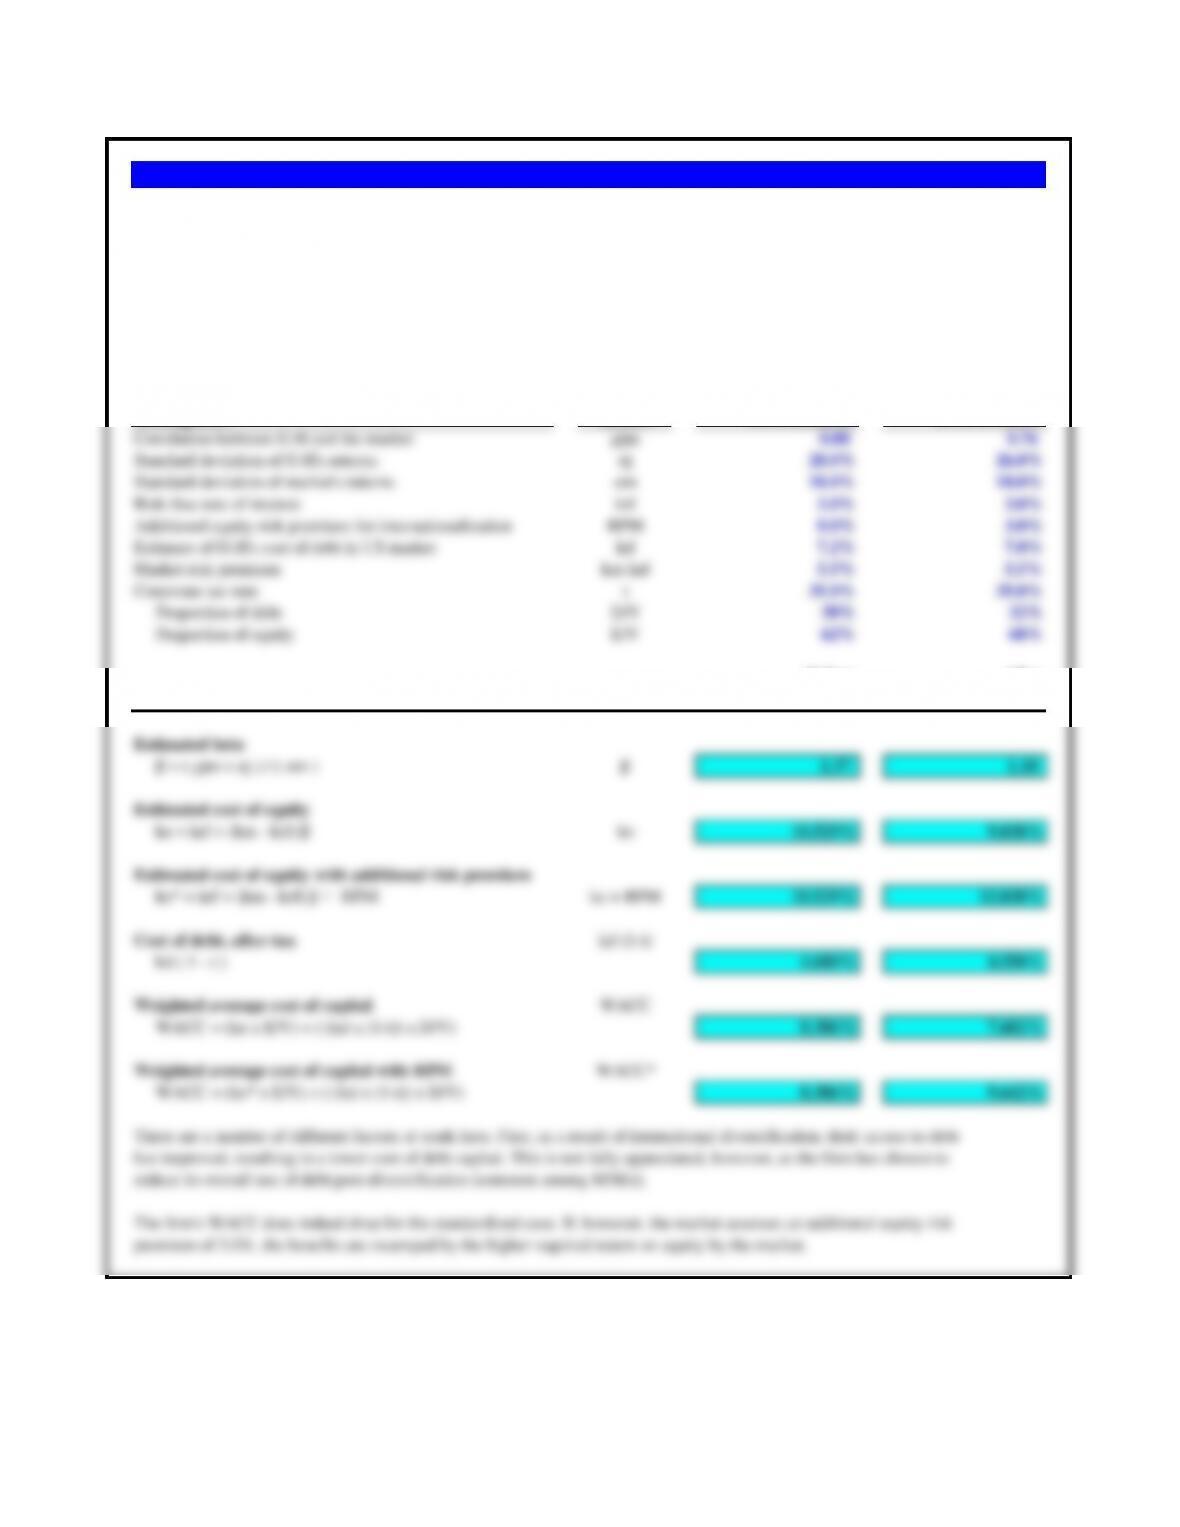
Before After
Assumptions Symbol Diversification Diversification
Correlation between G-H and the market
ρjm 0.88 0.76
Standard deviation of G-H’s returns σj 28.0% 26.0%
Standard deviation of market’s returns
σm18.0% 18.0%
Risk-free rate of interest krf 3.0% 3.0%
Additional equity risk premium for internationalization RPM 0.0% 3.0%
Estimate of G-H’s cost of debt in US market kd 7.2% 7.0%
Market risk premium km-krf 5.5% 5.5%
Corporate tax rate t 35.0% 35.0%
Proportion of debt D/V 38% 32%
Proportion of equity E/V 62% 68%
Before After
ke = krf + (km – krf) βke 10.529% 9.038%
ke* = krf + (km – krf) β + RPM ke + RPM 10.529% 12.038%
Cost of debt, after-tax kd (1-t)
kd ( 1 – t ) 4.680% 4.550%
Problem 13.11 Genedak-Hogan’s WACC
a. Did the reduction in debt costs reduce the firm’s weighted average cost of capital? How would you describe the impact of
international diversification on its costs of capital?
b. Adding the hypothetical risk premium to the cost of equity introduced in problem 10 (an added 3.0% to the cost of equity
because of international diversification), what is the firm’s WACC?
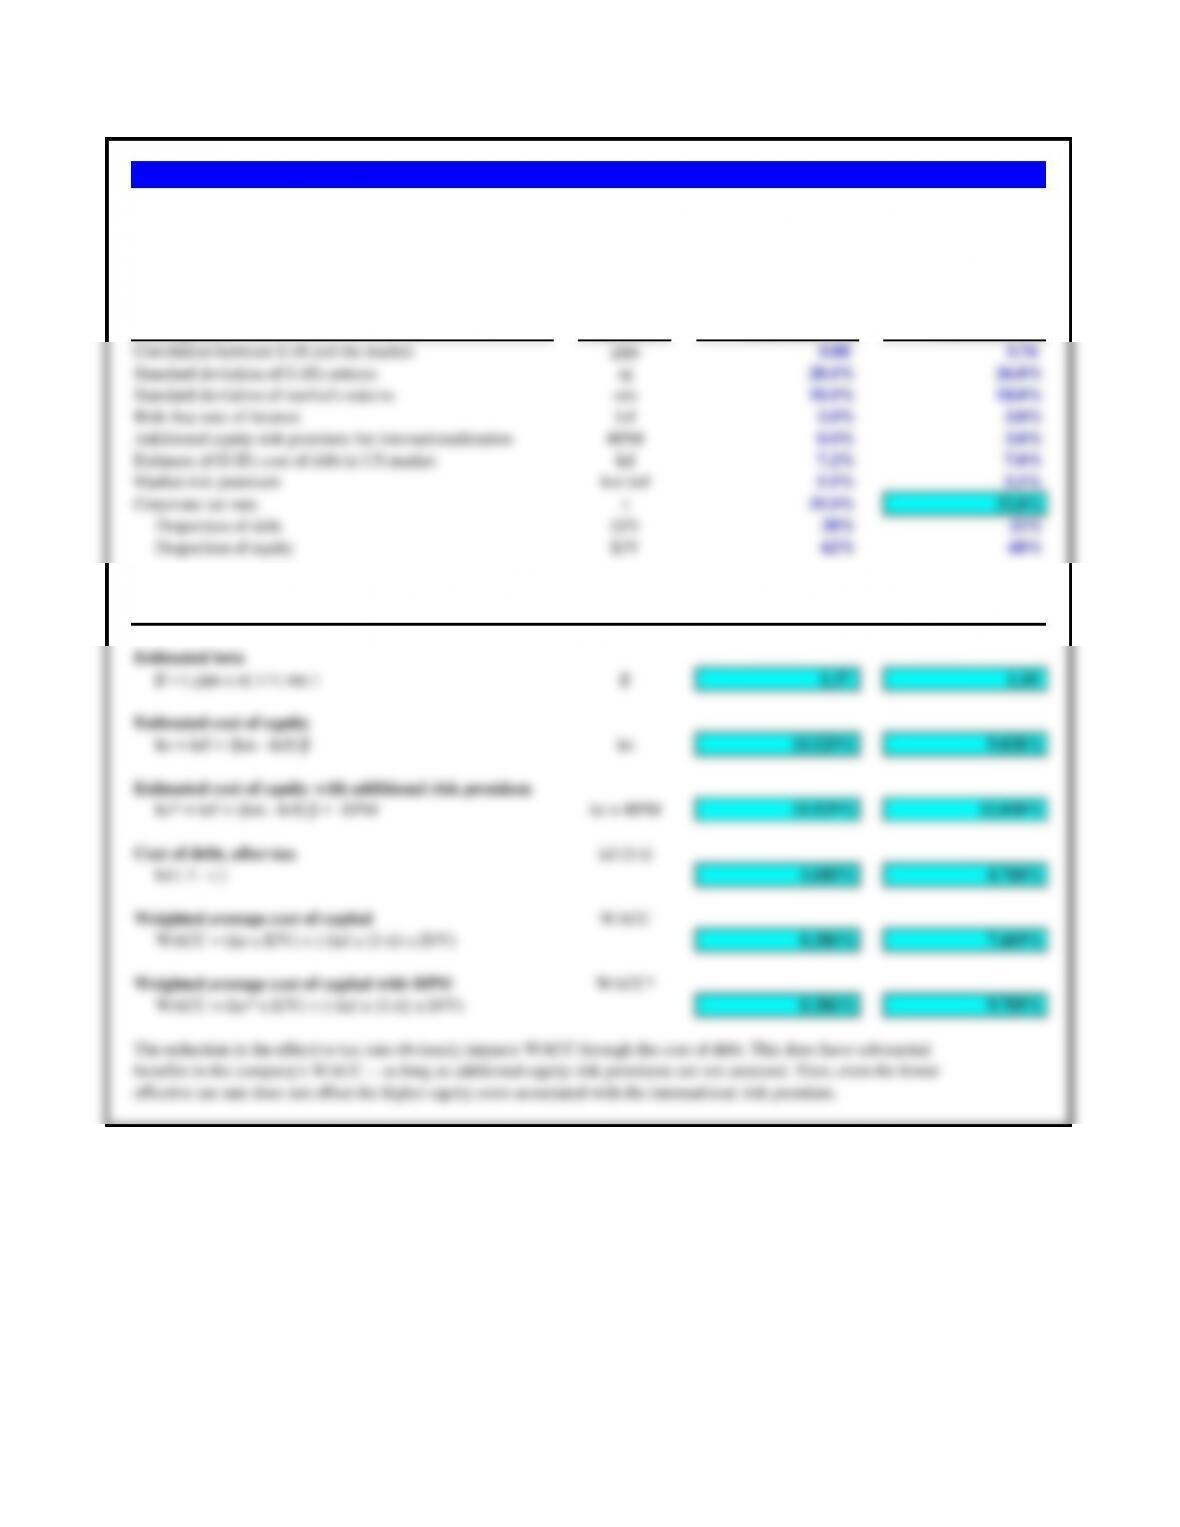
Before After
Assumptions Symbol Diversification Diversification
Correlation between G-H and the market
ρjm 0.88 0.76
Standard deviation of G-H’s returns σj 28.0% 26.0%
Standard deviation of market’s returns
σm18.0% 18.0%
Risk-free rate of interest krf 3.0% 3.0%
Additional equity risk premium for internationalization RPM 0.0% 3.0%
Estimate of G-H’s cost of debt in US market kd 7.2% 7.0%
Market risk premium km-krf 5.5% 5.5%
Corporate tax rate t 35.0% 32.0%
Proportion of debt D/V 38% 32%
Proportion of equity E/V 62% 68%
Before After
Estimating Costs of Capital Diversification Diversification
Estimated beta
β = ( ρjm x σj ) / ( σm ) β1.37 1.10
Estimated cost of equity
ke = krf + (km – krf) βke 10.529% 9.038%
ke* = krf + (km – krf) β + RPM ke + RPM 10.529% 12.038%
Weighted average cost of capital with RPM WACC*
WACC = (ke* x E/V) + ( (kd x (1-t)) x D/V) 8.306% 9.709%
The reduction in the effective tax rate obviously impacts WACC through the cost of debt. This does have substantial
Problem 13.12 Genedak-Hogan’s WACC and Effective Tax Rate
Many MNEs have greater ability to control and reduce their effective tax rates when expanding international operations. If Genedak-
Hogan was able to reduce its consolidated effective tax rate from 35% to 32%, what would be the impact on its WACC?