After completing the table below, answer the following questions.
a. Which city in the table is truly the cheapest date?
b. Which city in the table is the most expensive-cheap date?
c. If the exchange rate in Moscow on the Russian ruble (RUB) was 0.04200, instead of 0.0283, what would be the USD price?
d. If the exchange rate in Shangahi was CNY 6.66 = 1 USD, what would be its cost in USD and relative to a cheap date in New York City?
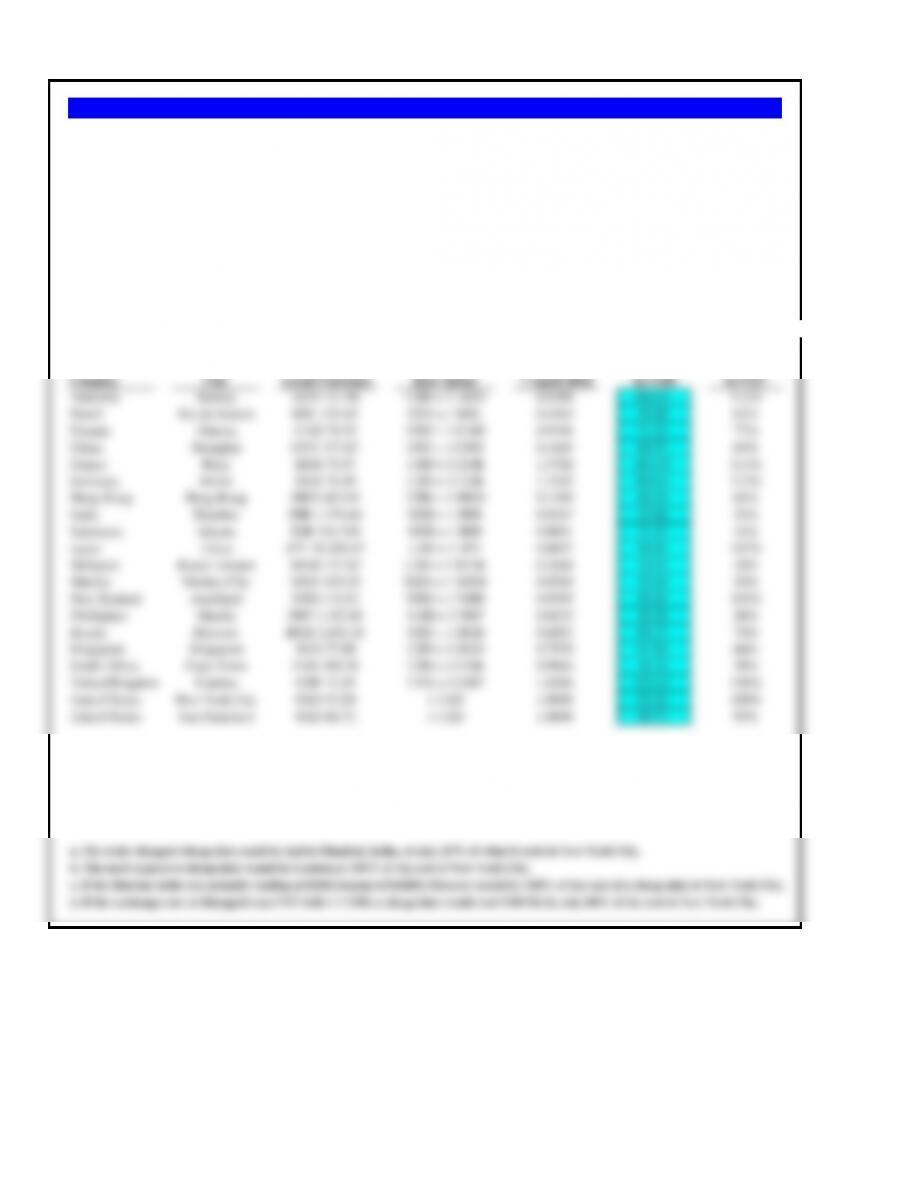
Cheap Date in Exchange Exchange Rate Cheap Date in Relative
Country City Local Currency Rate Quote 7 April 2014 In USD to NYC
Australia Sydney AUD 111.96 USD = 1 AUD 0.9290 104.01 112%
Brazil Rio de Janeiro BRL 135.43 USD = 1 BRL 0.4363 59.09 63%
Canada Ottawa CAD 78.33 USD = 1 CAD 0.9106 71.33 77%
China Shanghai CNY 373.87 USD = 1 CNY 0.1619 60.53 65%
France Paris EUR 75.57 USD = 1 EUR 1.3702 103.55 111%
Germany Berlin EUR 76.49 USD = 1 EUR 1.3702 104.81 112%
Hong Kong Hong Kong HKD 467.03 USD = 1 HKD 0.1289 60.20 65%
India Mumbai INR 1,379.64 USD = 1 INR 0.0167 23.04 25%
Indonesia Jakarta IDR 314,700 USD = 1 IDR 0.0001 31.47 34%
Japan Tokyo JPY 10,269.07 USD = 1 JPY 0.0097 99.61 107%
Malaysia Kuala Lumpur MYR 117.85 USD = 1 MYR 0.3048 35.92 39%
Mexico Mexico City MXN 423.93 USD = 1 MXN 0.0769 32.60 35%
New Zealand Auckland NZD 111.52 USD = 1 NZD 0.8595 95.85 103%
Phillipines Manila PHP 1,182.88 USD = 1 PHP 0.0222 26.26 28%
Problem 1.1 Comparing Cheap Dates Around the World
Comparison of prices or costs across different country and currency environments requires the translation of the local currency into a
single common currency. This is most meaningful when the comparison is for the identical or near-identical product or service across
countries. Deutsche Bank has recently started publishing a comparison of cheap dates — and evening on the town for two to eat at
McDonald’s, see a movie, and drink a beer. Once all costs are converted to a common currency, the U.S. dollar in this case, the cost
of the date can be compared across cities relative to the base case of a cheap date in USD in New York City.

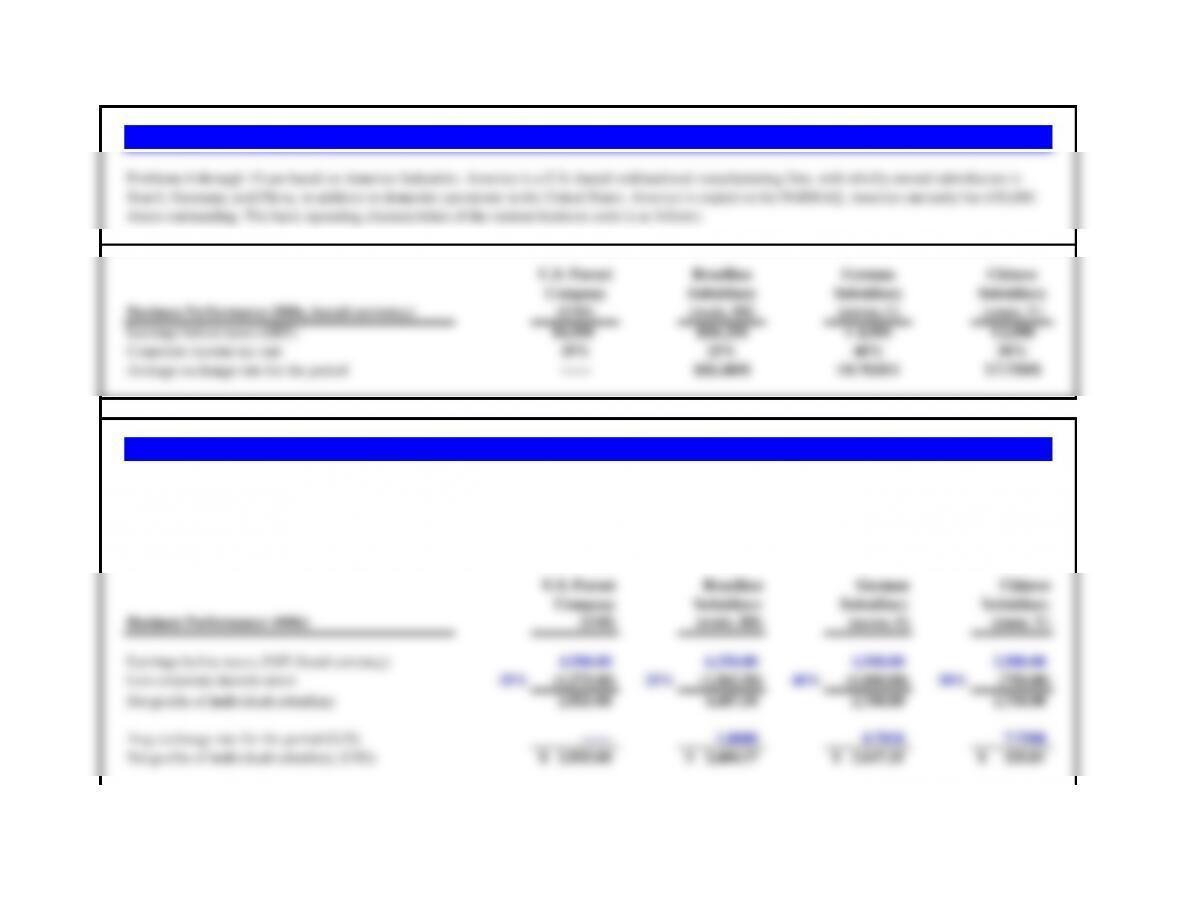
Japanese Britih European Chinese Russian United States
Net Income Subsidiary Subsidiary Subsidiary Subsidiary Subsidiary Subsidiary
2013 JPY 1,500 GBP 100.00 EUR 204.00 CNY 168.00 RUB 124.00 USD 360.00
2014 JPY 1,460 GBP 106.40 EUR 208.00 CNY 194.00 RUB 116.00 USD 382.00
The average exchange rate for each year, by currency pairs, was the following. Use this data to answer the following questions.
Exchange Rate JPY = 1 USD USD = 1 GBP USD = 1 EUR CNY = 1 USD RUB = 1 USD USD
2013 97.57 1.5646 1.3286 6.1484 31.86 1.0000
2014 105.88 1.6473 1.3288 6.1612 38.62 1.0000
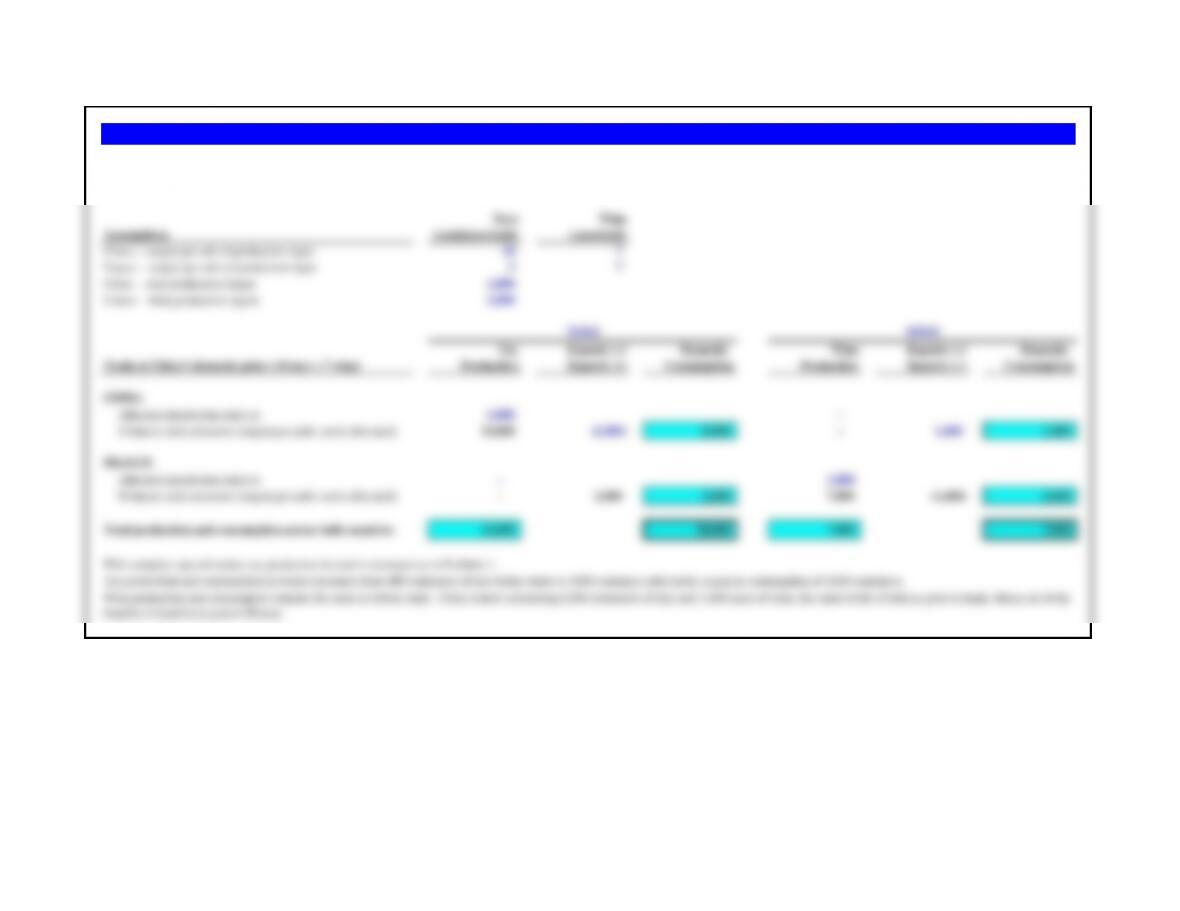
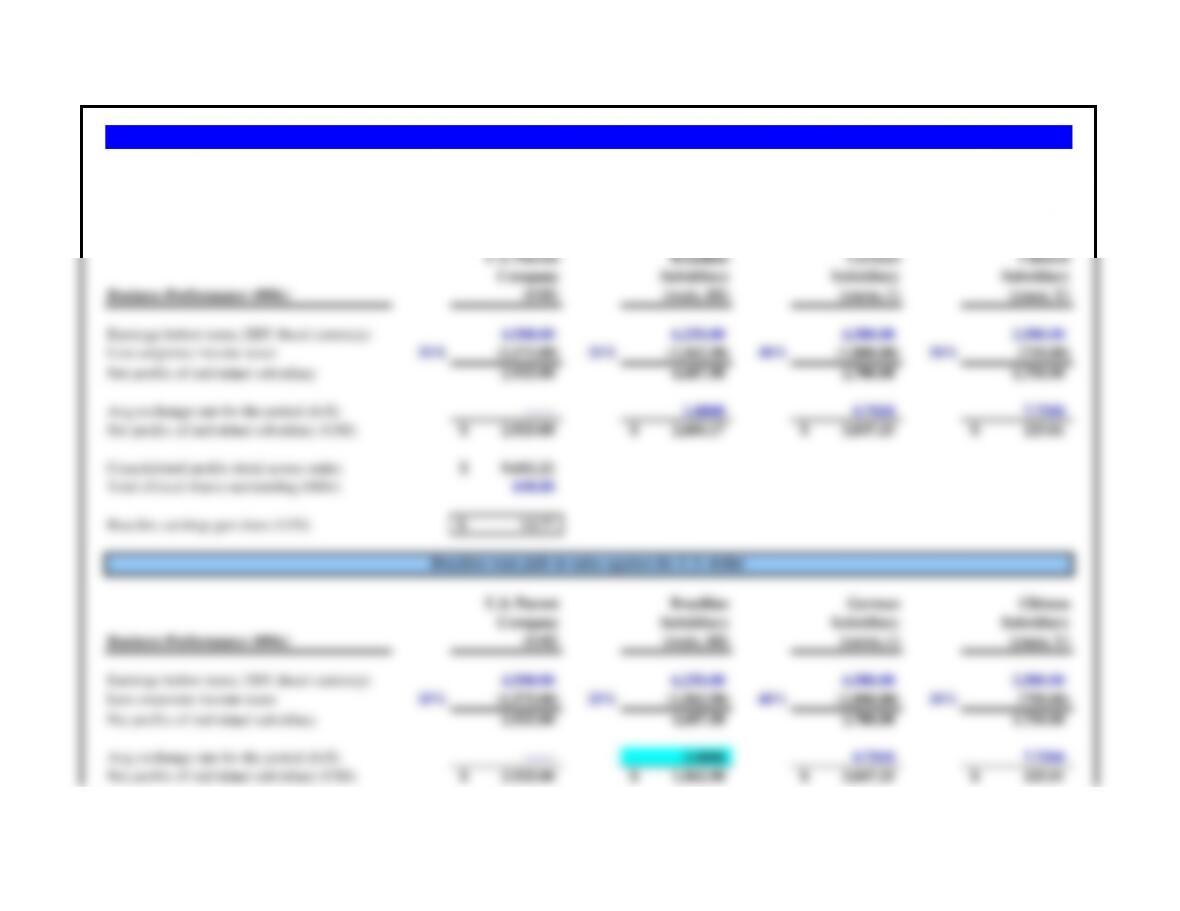
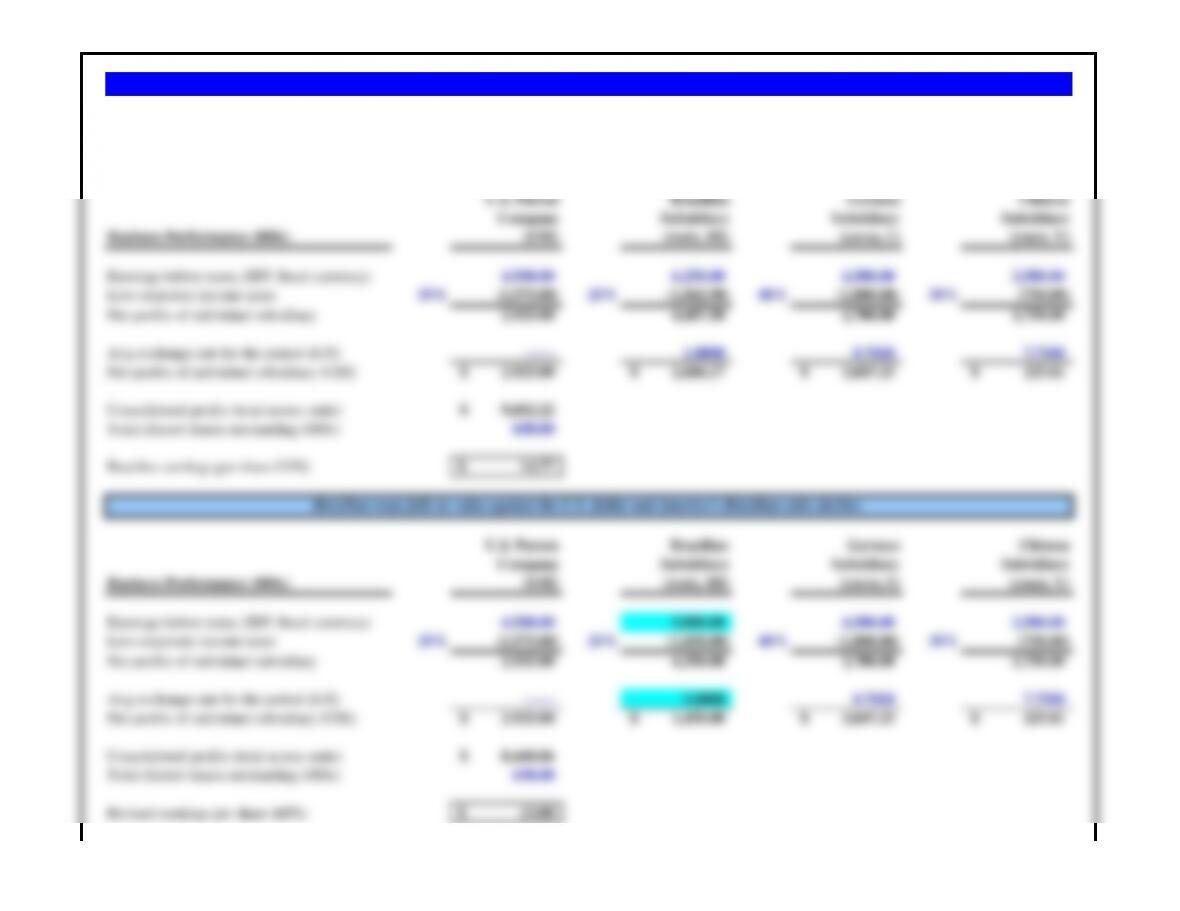
a. What was Blundell Biotech’s consolidated profits in U.S. dollars in 2013 and 2014?
b. If the same exchange rates were used for both years, what was the change in corporate earnings on a “constant currency” basis?
Japanese Britih European Chinese Russian United States Consolidated
Net Income (USD) Subsidiary Subsidiary Subsidiary Subsidiary Subsidiary Subsidiary Earnings
2013 USD 15.37 USD 156.46 USD 271.03 USD 27.32 USD 3.89 USD 360.00 USD 834.08
2014 USD 13.79 USD 175.27 USD 276.39 USD 31.49 USD 3.00 USD 382.00 USD 881.94
5.74%
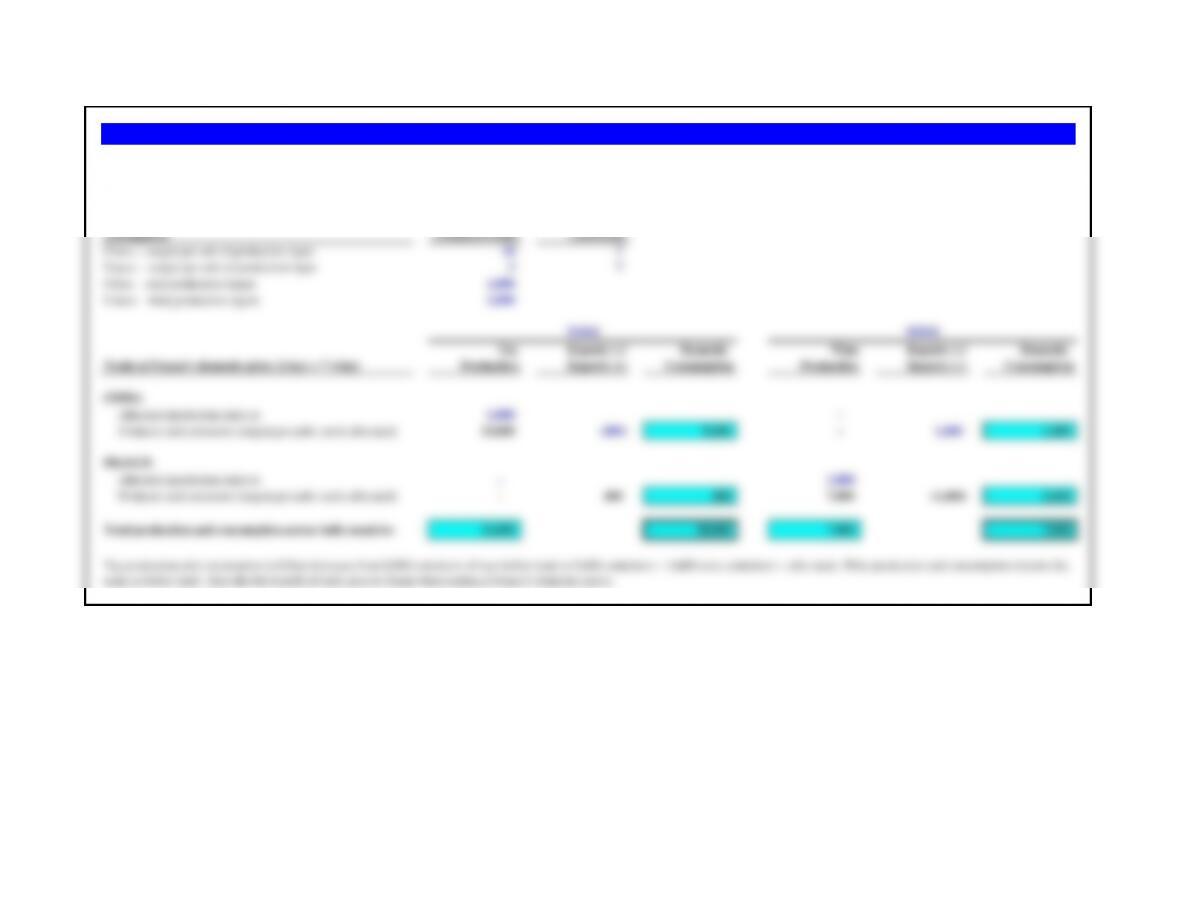
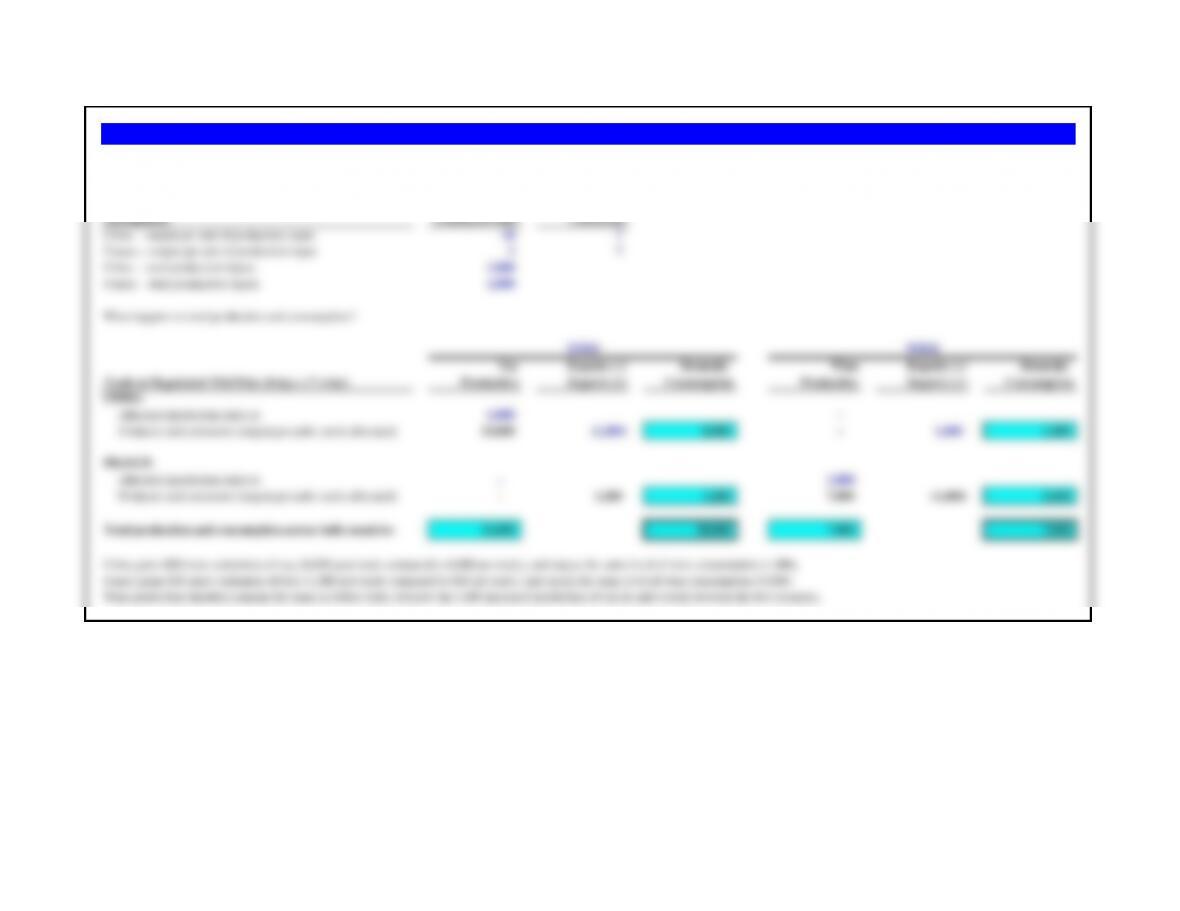
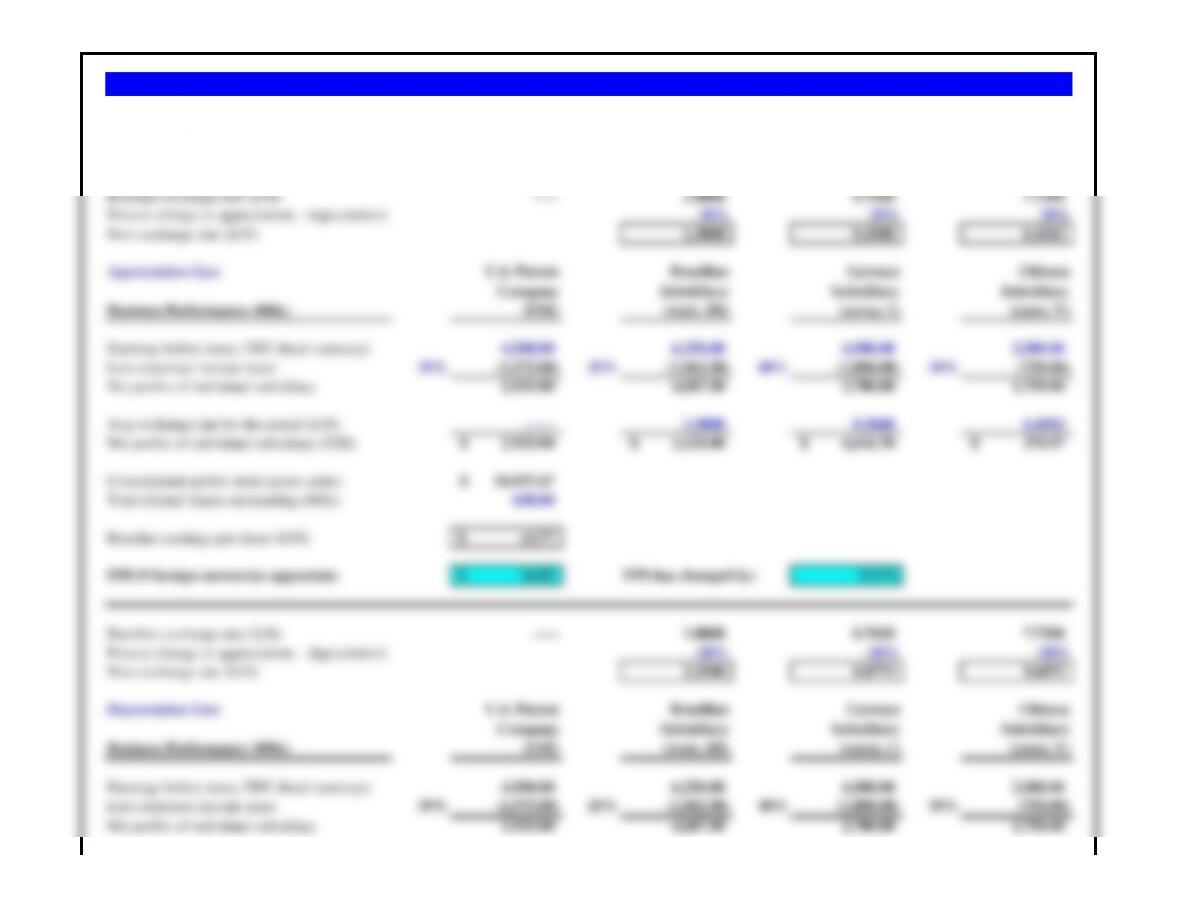
b. If the exchange rates for 2013 are used for both years, earnings from individual subsidiaries and consolidation appear as follows.
Japanese Britih European Chinese Russian United States Consolidated
Net Income (USD) Subsidiary Subsidiary Subsidiary Subsidiary Subsidiary Subsidiary Earnings
2013 USD 15.37 USD 156.46 USD 271.03 USD 27.32 USD 3.89 USD 360.00 USD 834.08
2014 USD 14.96 USD 166.47 USD 276.35 USD 31.55 USD 3.64 USD 382.00 USD 874.98
Change (USD 0.41) USD 10.01 USD 5.31 USD 4.23 (USD 0.25) USD 22.00 USD 40.90
Percent change -2.7% 6.4% 2.0% 15.5% -6.5% 6.1% 4.90%
Total percent change = (1 + Actual percent change) x (1 + Foreign exchange percent change) -1
On a constant currency basis, all subsidiaries showed growth in profits except for the Japanese and Russian subsidiaries. Fortunately for Blundell,
neither of those subsidiaries is a major contributor to total profits.
c. Using the results of the ‘constant currency analysis in part b, is it possible to separate Blundell’s growth in earnings between local
currency earnings and foreign exchange rate impacts on a consolidated basis?
c. Blundell Biotech’s consolidated earnings grew 5.7%. Since 4.9% of that was on an actual results basis (using constant currency assumption), the
exchange rate-based change in earnings can be solved for:
Blundell Biotech is a U.S.-based biotechnology company with operations and earnings in a number of foreign countries. The
company’s profits by subsidiary, in local currency (in millions), are shown in the following table for 2013 and 2014.
Problem 1.2 Blundell Biotech
a. Consolidated profits or earnings is found by consolidating the converted profits in each foreign currency to U.S. dollars for that period. (This is
simplified. Actual accounting practices would require the additional netting of any intra-company transactions resulting to eliminate any double–
counting of profits.)

Toys Wine
Assumptions (containers/unit) (cases/unit)
China — output per unit of production input 10 7
France — output per unit of production input 2 7
China — total production inputs 1,000
France — total production inputs 1,000
Production if there is no trade Toys Wine
CHINA
Allocated production units to 800 200
Produces and consumes (output per unit x units allocated) 8,000 1,400
FRANCE
Allocated production units to 200 800
Produces and consumes (output per unit x units allocated) 400 5,600
Total production and consumption across both countries 8,400 7,000
Comparative Advantage
Problems 1-5 illustrate an example of trade induced by comparative advantage. They assume that China and France
each have 1,000 production units. With one unit of production (a mix of land, labor, capital, and technology), China
can produce either 10 containers of toys or 7 cases of wine. France can produce either 2 cases of toys or 7 cases of
wine. Thus, a production unit in China is five times as efficient compared to France when producing toys, but
equally efficient when producing wine. Assume at first that no trade takes place. China allocates 800 production
units to building toys and 200 production units to producing wine. France allocates 200 production units to building
toys and 800 production units to producing wine.
What is the production and consumption of China and France without trade?
Problem 1.3 Production and Consumption

Toys Wine
Assumptions (containers/unit) (cases/unit)
China — output per unit of production input 10 7
France — output per unit of production input 2 7
China — total production inputs 1,000
France — total production inputs 1,000
Production if there is complete specialization Toys Wine
CHINA
Allocated production units to 1,000 –
Produces and consumes (output per unit x units allocated) 10,000 –
FRANCE
Allocated production units to – 1,000
Produces and consumes (output per unit x units allocated) – 7,000
Total production and consumption across both countries 10,000 7,000
Problem 1.4 Specialization
Assume complete specialization, where China produces only toys and France produces only wine. What would be
the effect on total production?
The combined production of both countries is 10,000 containers of toys, 1,600 more containers of toys than before
specialization, with wine production remaining unchanged.
Toys Wine
Assumptions (containers/unit) (cases/unit)
China — output per unit of production input 10 7
France — output per unit of production input 2 7
China — total production inputs 1,000
France — total production inputs 1,000
Toy Exports (-)/ Domestic Wine Exports (-)/ Domestic
Trade at China’s domestic price (10 toys = 7 wine) Production Imports (+) Consumption Production Imports (+) Consumption
CHINA
Allocated production units to 1,000 –
Produces and consumes (output per unit x units allocated) 10,000 (2,000) 8,000 – 1,400 1,400
FRANCE
Allocated production units to – 1,000
benefits of trade have gone to France.
Problem 1.5 Trade at China’s Domestic Price
TOYS
WINE
China’s domestic price is 10 containers of toys equals 7 cases of wine. Assume China produces 10,000 containers of toys and exports 2,000 to France. Assume France produces 7,000
cases of wine and exports 1,400 cases to China. What happens to total production and consumption?
Toys Wine
Assumptions (containers/unit) (cases/unit)
China — output per unit of production input 10 7
France — output per unit of production input 2 7
China — total production inputs 1,000
France — total production inputs 1,000
Toy Exports (-)/ Domestic Wine Exports (-)/ Domestic
Trade at France’s domestic price (2 toys = 7 wine) Production Imports (+) Consumption Production Imports (+) Consumption
CHINA
Allocated production units to 1,000 –
Produces and consumes (output per unit x units allocated) 10,000 (400) 9,600 – 1,400 1,400
FRANCE
Allocated production units to – 1,000
Produces and consumes (output per unit x units allocated) – 400 400 7,000 (1,400) 5,600
Total production and consumption across both countries 10,000 10,000 7,000 7,000
Problem 1.6 Trade at France’s Domestic Price
TOYS
WINE
same as before trade. Thus the full benefit of trade goes to China when trading at France’s domestic prices.
France’s domestic price is 2 containers of toys equals 7 cases of wine. Assume China produces 10,000 containers of toys and exports 400 containers to France. Assume France in turn
produces 7,000 cases of wine and exports 1,400 cases to China. What happens to total production and consumption?
The mid-price for exchange between France and China can be calculated as follows:
Toys Wine
Assumptions (containers/unit) (cases/unit)
China — output per unit of production input 10 7
France — output per unit of production input 2 7
China — total production inputs 1,000
France — total production inputs 1,000
What happens to total production and consumption?
Toy Exports (-)/ Domestic Wine Exports (-)/ Domestic
Trade at Negotiated Mid-Price (6 toys = 7 wine) Production Imports (+) Consumption Production Imports (+) Consumption
CHINA
Allocated production units to 1,000 –
Produces and consumes (output per unit x units allocated) 10,000 (1,200) 8,800 – 1,400 1,400
FRANCE
Allocated production units to – 1,000
Produces and consumes (output per unit x units allocated) – 1,200 1,200 7,000 (1,400) 5,600
Problem 1.7 Trade at Negotiated Mid-Price
TOYS
WINE
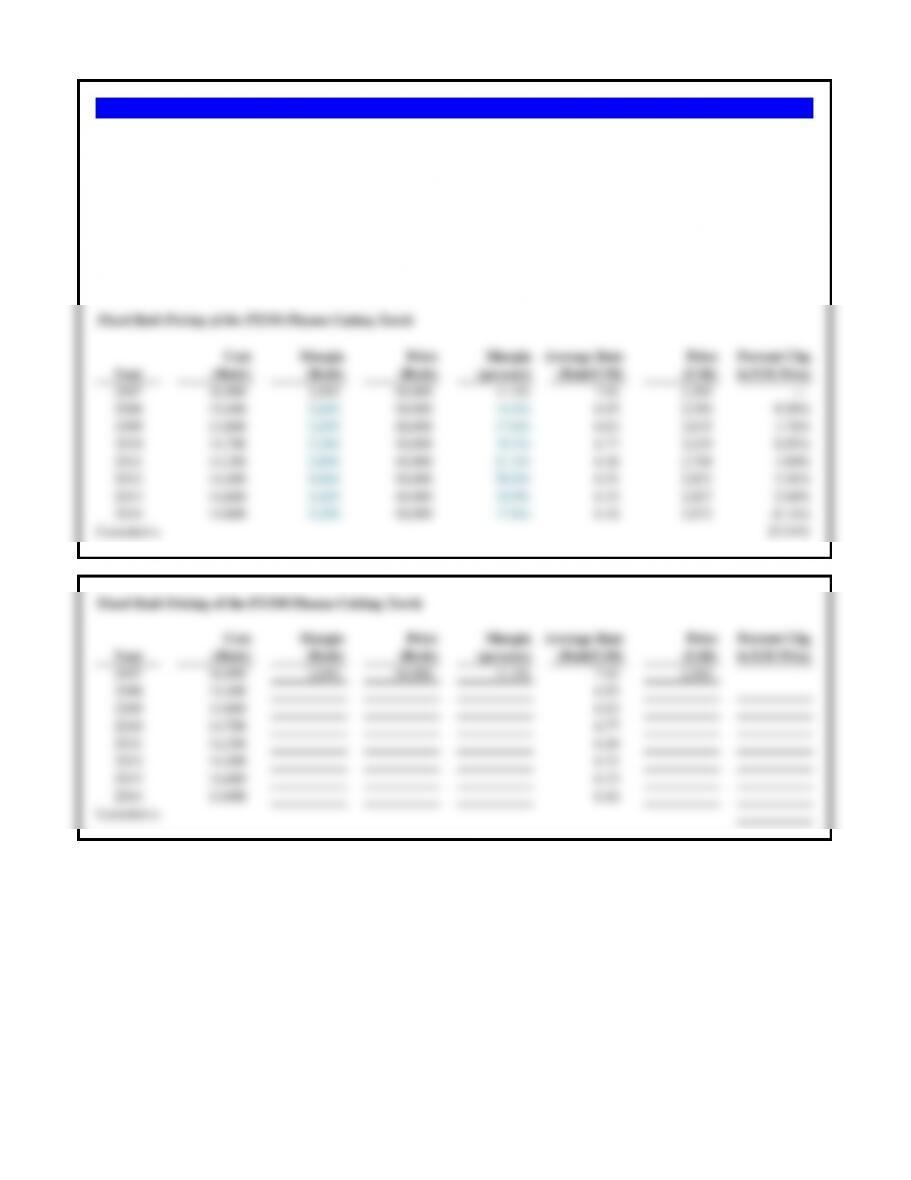
b. What has been the impact on Peng’s margins from this pricing strategy?
Fixed Rmb Pricing of the PT350 Plasma Cutting Torch
Cost Margin Price Margin Average Rate Price Percent Chg
Year (Rmb) (Rmb) (Rmb) (percent) (Rmb/US$) (US$) in US$ Price
2007 16,000 2,000 18,000 11.1% 7.61 2,365 —
2008 15,400 2,600 18,000 14.4% 6.95 2,590 9.50%
2009 14,800 3,200 18,000 17.8% 6.83 2,635 1.76%
2010 14,700 3,300 18,000 18.3% 6.77 2,659 0.89%
2011 14,200 3,800 18,000 21.1% 6.46 2,786 4.80%
2012 14,400 3,600 18,000 20.0% 6.31 2,853 2.38%
2013 14,600 3,400 18,000 18.9% 6.15 2,927 2.60%
2014 14,800 3,200 18,000 17.8% 6.16 2,922 –0.16%
Cumulative 23.54%
Fixed Rmb Pricing of the PT350 Plasma Cutting Torch
Cost Margin Price Margin Average Rate Price Percent Chg
Problem 1.8 Peng Plasma Pricing
Peng Plasma is a privately held Chinese business. It specializes in the manufacture of plasma cutting torches. Over the past eight
years it has held the Chinese renminbi price of the PT350 cutting torch fixed at Rmb 18,000 per unit. Over that same period it has
worked to reduce costs per unit, but has struggled of late due to higher input costs. Over that same period the renminbi has
continued to be revalued against the U.S. dollar by the Chinese government. After completing the table – assuming the same
price in renminbi for all years – answer the following questions.
a. What has been the impact of Peng’s pricing strategy on the US$ price? How would you expect their U.S. dollar-based
customers to have reacted to this?

Vitro’s U.S. Sales Percent Annual Avg Rate Vitro‘s U.S. Sales Percent
Year (millions of USD) Change MXN = 1 USD (millions of MXN) Change
2011 USD 820 MXN 12.80 MXN 10,496
2012 USD 842 2.7% MXN 13.30 MXN 11,199 6.7%
2013 USD 845 0.4% MXN 12.70 MXN 10,732 -4.2%
2014 USD 860 1.8% MXN 13.40 MXN 11,524 7.4%
Based on Vitro’s U.S. sales, in both U.S. dollars and Mexican pesos, you should recommend that Santiago continue to
argue for his performance bonus to be based on the U.S. dollar value, not the translated Mexican peso value.
First, under the previous Managing Director, U.S. sales measured both ways was volatile. The volatility, however, was
larger in pesos than dollars. If that was the only concern, then it would only be up to Santiago to choose his ‘risk
tolerance’ — how much volatility he is willing to bear in his annual performance bonus.
But more importantly, if his performance was based on the USD value of U.S. sales, he would be measured on the
actual sales which he had direct control over. Santiago does not, and willl not, control the exchange rate between the
dollar and the peso. And changes in that exchange rate could potentially destroy all growth in U.S. sales (and his
bonus) as it did in 2013. In 2013 U.S. sales grew (not much, but they grew), and he would have theoretically recieved a
bonus. But as measured in Mexican pesos in 2013, as a result of a fall in the value of the peso, his performance would
have not been positive — and probably so would be the value of his bonus.
Santiago, however, is a bit uncertain on having his bonus based on the Mexican peso values of U.S. sales. As a
close friend and colleague, what advice would you give him based on your completion of the table below?
Problem 1.9 Santiago Pirolta’s Compensation Agreement
Santiago Pirolta has accepted the Managing Director position for Vitro de Mexico’s U.S. operations. Vitro is a Mexico-
based manufacturer of flat and custom glass products. Much of its U.S. sales are based on a variety of bottle products,
both mass market (e.g., glass bottles for soft drinks and beer) as well as specialty products (high-end cosmetic bottles
with rare metal coloring and quality). He will live and work in the United States (Dallas, Texas) and wishes to be paid
in US dollars. Vitro has agreed that his base salary of USD350,000 will be paid in U.S. dollars, but Vitro wishes to tie
his annual performance bonus to the Mexican peso value of U.S. sales since Vitro consolidates all final results for
reporting to stockholders in Mexican pesos (MXN).
U.S. Parent Brazilian German Chinese
Company Subsidiary Subsidiary Subsidiary
Business Performance (000s, loccal currency) (US$) (reais, R$) (euros, €) (yuan, Y)
Earnings before taxes (EBT) $4,500 R$6,250 € 4,500 Y2,500
Corporate income tax rate 35% 25% 40% 30%
Average exchange rate for the period —— R$1.80/$ €0.7018/$ Y7.750/$
U.S. Parent Brazilian German Chinese
Company Subsidiary Subsidiary Subsidiary
Business Performance (000s) (US$) (reais, R$) (euros, €) (yuan, Y)
Earnings before taxes, EBT (local currency) 4,500.00 6,250.00 4,500.00 2,500.00
Less corporate income taxes 35% (1,575.00) 25% (1,562.50) 40% (1,800.00) 30% (750.00)
Net profits of individual subsidiary 2,925.00 4,687.50 2,700.00 1,750.00
Problems 6 through 10 are based on Americo Industries. Americo is a U.S.-based multinational manufacturing firm, with wholly owned subsidiaries in
Brazil, Germany, and China, in addition to domestic operations in the United States. Americo is traded on the NADSAQ. Americo currently has 650,000
shares outstanding. The basic operating characteristics of the various business units is as follows:
Americo Industries – 2010
a. After deducting taxes in each country, what are Americo’s consolidated earnings and consolidated earnings per share in U.S. dollars?
b. What proportion of Americo’s consolidated earnings arise from each individual country?
c. What proportion of Americo’s consolidated earnings arise from outside the United States?
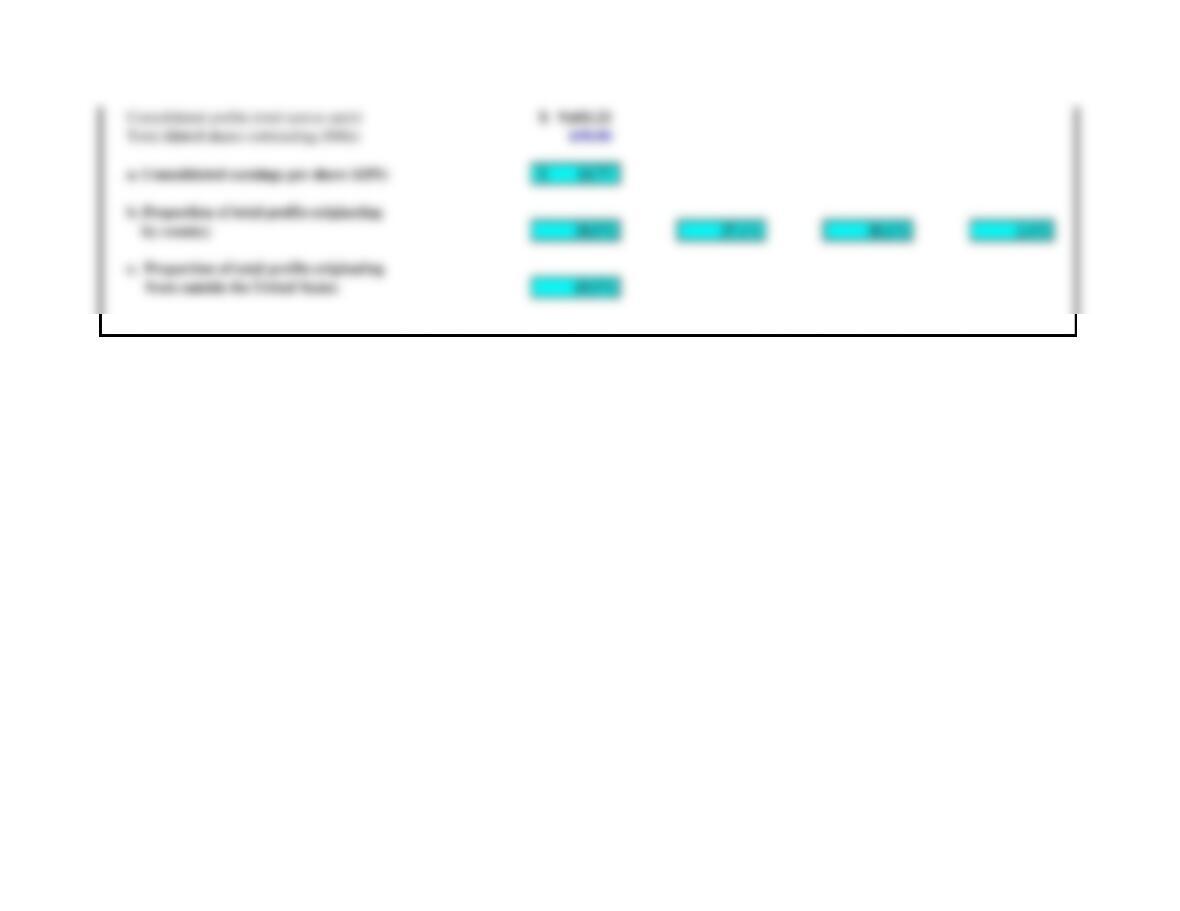
Consolidated profits (total across units) 9,602.22$
Total diluted shares outstanding (000s) 650.00
a. Consolidated earnings per share (EPS) 14.77$
b. Proportion of total profits originating
by country 30.5% 27.1% 40.1% 2.4%
c. Proportion of total profits originating
from outside the United States 69.5%
U.S. Parent Brazilian German Chinese
Company Subsidiary Subsidiary Subsidiary
Business Performance (000s) (US$) (reais, R$) (euros, €) (yuan, Y)
Earnings before taxes, EBT (local currency) 4,500.00 6,250.00 4,500.00 2,500.00
Less corporate income taxes 35% (1,575.00) 25% (1,562.50) 40% (1,800.00) 30% (750.00)
Net profits of individual subsidiary 2,925.00 4,687.50 2,700.00 1,750.00
Problem 1.11 Americo’s EPS Sensitivity to Exchange Rates (A)
Assume a major political crisis wracks Brazil, first affecting the value of the Brazilian reais and, subsequently, inducing an economic recession within the
country. What would be the impact on Americo’s consolidated EPS if the Brazilian reais were to fall in value to R$3.00/$, with all other earnings and exchange
rates remaining the same?

Consolidated profits (total across units) 8,560.56$
Total diluted shares outstanding (000s) 650.00
“New” earnings per share (EPS) 13.17$
EPS change from baseline: -10.8%
U.S. Parent Brazilian German Chinese
Company Subsidiary Subsidiary Subsidiary
Business Performance (000s) (US$) (reais, R$) (euros, €) (yuan, Y)
Assume a major political crisis wracks Brazil, first affecting the value of the Brazilian reais and, subsequently, inducing an economic recession within the
country. What would be the impact on Americo’s consolidated EPS if, in addition to the fall in the value of the reais to R$3.00/$, earnings before taxes in Brazil
fell as a result of the recession to R$5,8000,000?
Problem 1.12 Americo’s EPS Sensitivity to Exchange Rates (B)

Change in EPS from both changes: -12.0%
Baseline exchange rate (fc/$) —– 1.8000 0.7018 7.7500
Percent change (+ appreciation, – depreciation) 20% 20% 20%
New exchange rate (fc/$) 1.5000 0.5848 6.4583
Problem 1.13 Americo’s Earnings and the Fall of the Dollar
The U.S. dollar has experienced significant swings in value against most of the world’s currencies in recent years.
a. What would be the impact on Americo’s consolidated EPS if all foreign currencies were to appreciate 20% against the U.S. dollar?
b. What would be the impact on Americo’s consolidated EPS if all foreign currencies were to depreciate 20% against the U.S. dollar?
Avg exchange rate for the period (fc/$) —— 2.2500 0.8773 9.6875
Net profits of individual subsidiary (US$) 2,925.00$ 2,083.33$ 3,077.80$ 180.65$
Consolidated profits (total across units) 8,266.78$
Total diluted shares outstanding (000s) 650.00
Baseline earnings per share (EPS) 14.77$
EPS if foreign currencies depreciate 12.72$ EPS has changed by: -13.9%
U.S. Parent Brazilian German Chinese
Company Subsidiary Subsidiary Subsidiary
Business Performance (000s) (US$) (reais, R$) (euros, €) (yuan, Y)
Earnings before taxes, EBT (local currency) 4,500.00 6,250.00 4,500.00 2,500.00
Less corporate income taxes 35% (1,575.00) 25% (1,562.50) 40% (1,800.00) 30% (750.00)
Net profits of individual subsidiary 2,925.00 4,687.50 2,700.00 1,750.00
Avg exchange rate for the period (fc/$) —— 1.8000 0.7018 7.7500
Net profits of individual subsidiary (US$) 2,925.00$ 2,604.17$ 3,847.25$ 225.81$
Consolidated profits (total across units) 9,602.22$
Total diluted shares outstanding (000s) 650.00
Consoldiated earnings per share (EPS) 14.77$
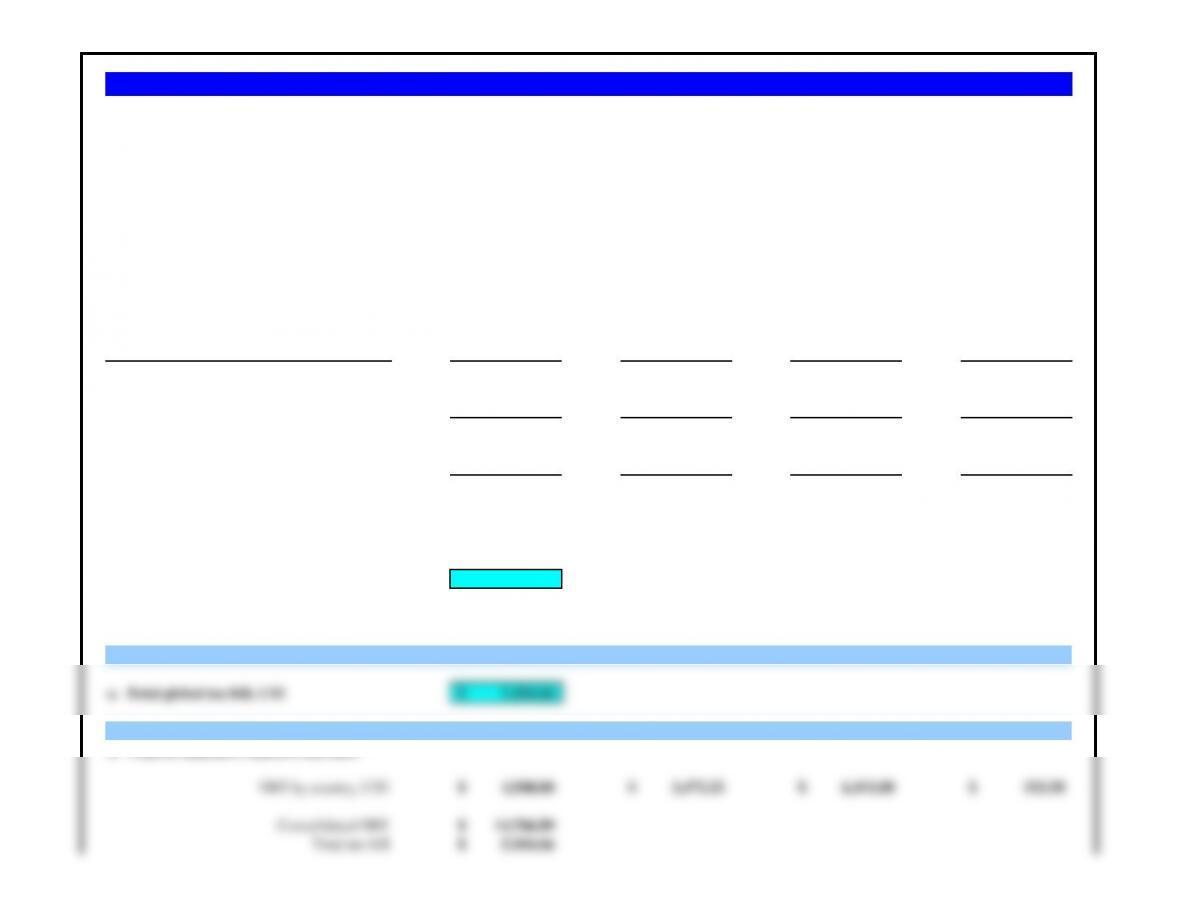
Tax payments by country in US dollars 1,575.00$ 868.06$ 2,564.83$ 96.77$
a. Total global tax bill, US$ 5,104.66$
EBT by country, US$ 4,500.00$ 3,472.22$ 6,412.08$ 322.58$
Consolidated EBT 14,706.89$
Problem 1.14 Americo’s Earnings and Global Taxation
All MNEs attempt to minimize their global tax liabilities. Return to the original set of baseline assumptions and answer the following questions regarding
Americo’s global tax liabilities:
a. What is the total amount – in U.S. dollars – which Americo is paying across its global business in corporate income taxes?
b. What is Americo’s effective tax rate (total taxes paid as a proportion of pre-tax profit)?
c. What would be the impact on Americo’s EPS and global effective tax rate if Germany instituted a corporate tax reduction to 28%, and Americo’s earnings
before tax in Germany rose to €5,000,000?
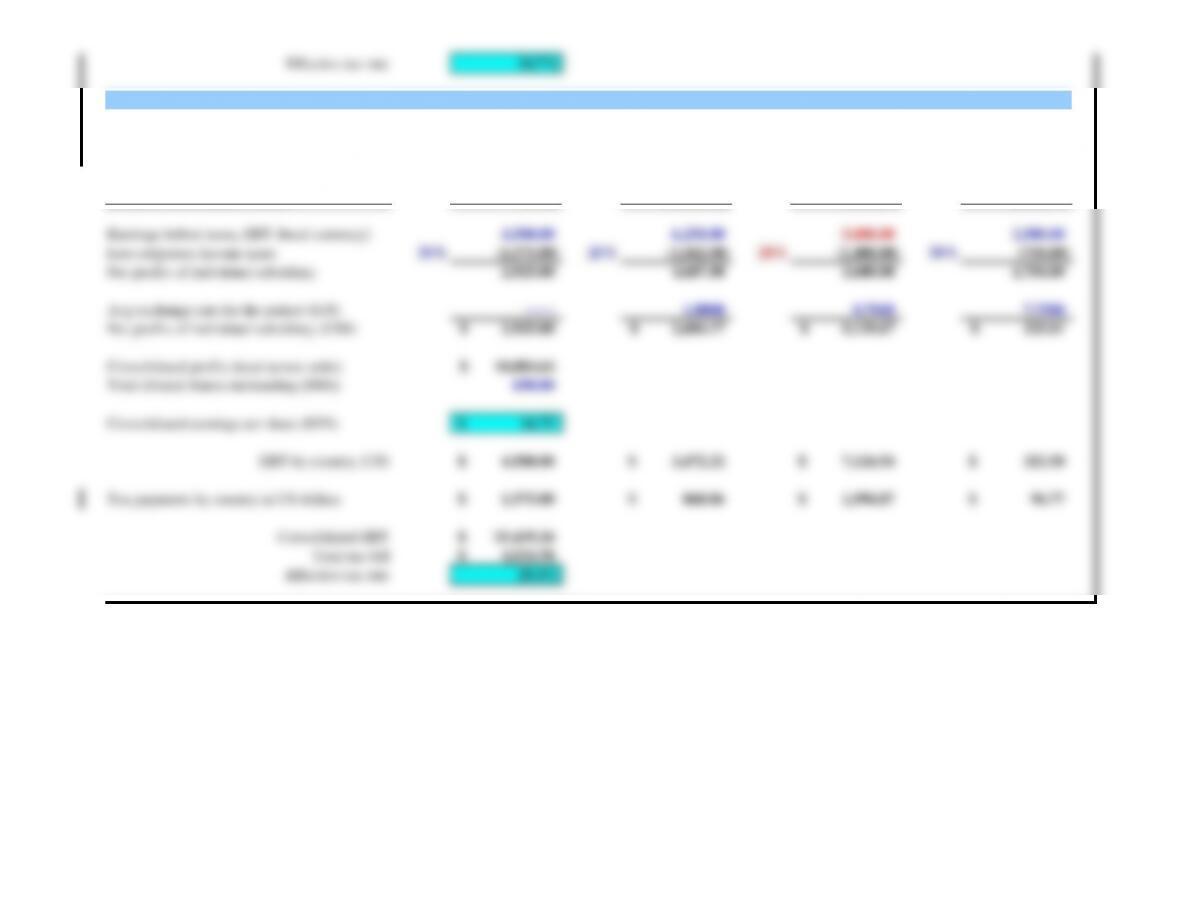
Effective tax rate 34.7%
U.S. Parent Brazilian German Chinese
Company Subsidiary Subsidiary Subsidiary
Business Performance (000s) (US$) (reais, R$) (euros, €) (yuan, Y)
Earnings before taxes, EBT (local currency) 4,500.00 6,250.00 5,000.00 2,500.00
Less corporate income taxes 35% (1,575.00) 25% (1,562.50) 28% (1,400.00) 30% (750.00)
Net profits of individual subsidiary 2,925.00 4,687.50 3,600.00 1,750.00
Avg exchange rate for the period (fc/$) —— 1.8000 0.7018 7.7500
Net profits of individual subsidiary (US$) 2,925.00$ 2,604.17$ 5,129.67$ 225.81$
Total diluted shares outstanding (000s) 650.00
Consoldiated earnings per share (EPS) 16.75$
EBT by country, US$ 4,500.00$ 3,472.22$ 7,124.54$ 322.58$
Tax payments by country in US dollars 1,575.00$ 868.06$ 1,994.87$ 96.77$
c. What would be the impact on Americo’s EPS and global effective tax rate if Germany instituted a tax cut to 28% and German subsidiary earnings
rose to 5 million euros?