W H AT I S E C O N O M I C S ? 1 2 3
A n s w e r s t o t h e R e v i e w Q u i z z e s
Page 204
1. What does a household’s budget line show?
2. How does the relative price and a household’s real income in’uence its
budget line?
The magnitude of the slope of the budget line equals the relative price of the good
or service measured on the horizontal axis. A fall in the price of the good measured
on the horizontal (vertical) axis decreases that good’s relative price and decreases
(increases) the slope of the budget line. A household’s real income is the
3. If a household has an income of $40 and buys only bus rides at $2 each and
magazines at $4 each, what is the equation of the household’s budget line?
The budget equation states that a household’s spending must equal its income.
The budget equation is derived for two goods, bus rides and magazines. The
amount spent on bus rides is (Pbus ride)×(Qbus ride), the amount spent on
magazines is (Pmagazine)×(Qmagazine), and the consumer’s income is y. We know
that (Pmagazine)×(Qmagazine) + (Pbus ride)×(Qbus ride) = y. Rearrange this
4. If the price of one good changes, what happens to the relative price and the
slope of the household’s budget line?
A relative price is the price of one good divided by the price of another good. For
example, the magnitude of the slope of the budget line (Pmovie/Psoda) is the
9 POSSIBILITES,
PREFERENCES,
AND CHOICES
123
1 2 4
5. If a household’s money income changes and prices do not change, what
happens to the household’s real income and budget line?
A household’s real income is the household’s income expressed as a quantity of
goods the household can a-ord to buy. For example, the vertical intercept for a
budget line measuring soda on the vertical axis is (y/Psoda), which is the
Page 208
1. What is an indi-erence curve and how does a preference map show
preferences?
An indi-erence curve shows those combinations of goods for which a consumer is
indierent. The consumer has the same level of satisfaction for any combination
2. Why does an indi-erence curve slope downward and why is it bowed toward
the origin?
The downward slope of an indi-erence curve illustrates the tradeo- between two
goods while maintaining the same level of total satisfaction. Since the consumer is
indi-erent among all points on an indi-erence curve, when moving along it any
3. What do we call the magnitude of the slope of an indi-erence curve?
The magnitude of the slope of an indi-erence curve is called the marginal rate of
substitution (MRS). The MRS measures the rate at which the consumer gives up
one good to get more of another good, while remaining on the same indi-erence
4. What is the key assumption about a consumer’s marginal rate of substitution?
Page 213
1. When a consumer chooses the combination of goods and services to buy,
what is she or he trying to achieve?
2. Explain the conditions that are met when a consumer has found the best
a-ordable combination of goods to buy. (Use the terms budget line, marginal
rate of substitution, and relative price in your explanation.)
124
W H A T I S E C O N O M I C S ? 1 2 5
3. If the price of a normal good falls, what happens to the quantity demanded of
that good?
If the price of a normal good falls, the quantity demanded of that good increases
4. Into what two e-ects can we divide the e-ect of a price change?
A price change can be divided into a substitution e-ect and an income e-ect. The
substitution e-ect is the e-ect of a change in price on the quantity bought when
5. For a normal good, does the income e-ect reinforce the substitution e-ect or
does it partly o-set the substitution e-ect?
For a normal good the substitution e-ect and the income e-ect reinforce each
Answers to t he Stu dy Pla n P r oblem s and
Applicat i ons
Use the following information to work Problems 1 to 2.
Sara’s income is $12 a week. The price of popcorn is $3 a bag, and the price of a
smoothie is $3.
1. Calculate Sara’s real income in terms of smoothies. Calculate her real income
in terms of popcorn. What is the relative price of smoothies in terms of
popcorn? What is the opportunity cost of a smoothie?
Sara’s real income is 4 smoothies. Sara’s real income in terms of smoothies is
equal to her money income divided by the price of a smoothie. Sara’s money
income is $12, and the price of a smoothie is $3. Sara’s real income is $12 divided
by $3 a smoothie, which is 4 smoothies.
Sara’s real income is 4 bags of popcorn. Sara’s real income in terms of popcorn is
equal to her money income divided by the price of a bag of popcorn, which is $12
125
1 2 6
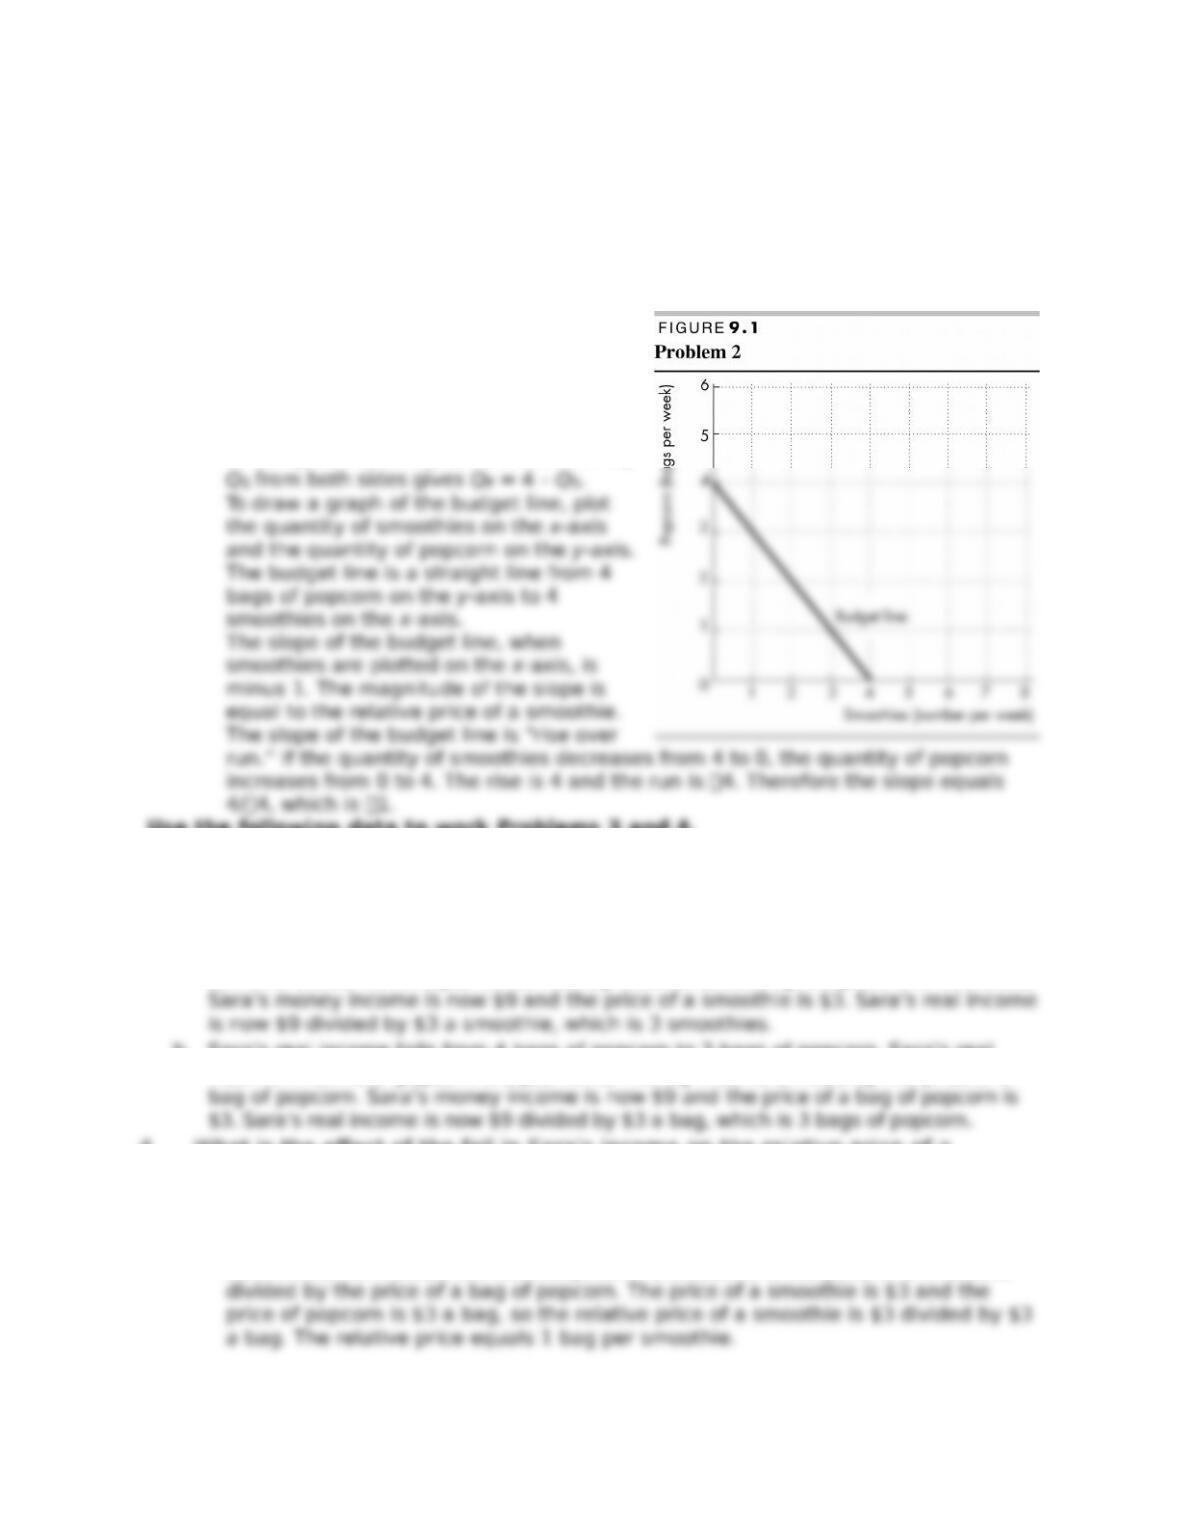
2. Calculate the equation for Sara’s budget line (with bags of popcorn on the left
side). Draw a graph of Sara’s budget line with the quantity of smoothies on
the x-axis. What is the slope of Sara’s budget line? What determines its
value?
The equation that describes Sara’s budget line is QP = 4 – QS. Call the price of
popcorn PP and the quantity of popcorn QP, the price of a smoothie PS and the
quantity of smoothies QS, and income y.
Sara’s budget equation is PPQP + PSQS =
y. If we substitute $3 for the price of
popcorn, $3 for the price of a smoothie,
and $12 for the income, the budget
equation becomes $3QP + $3QS = $12.
Dividing both sides by $3 and subtracting
Use the following data to work Problems 3 and 4.
Sara’s income falls from $12 to $9 a week, while the price of popcorn is unchanged
at $3 a bag and the price of a smoothie is unchanged at $3.
3. What is the e-ect of the fall in Sara’s income on her real income in terms of
(a) smoothies and (b) popcorn?
a. Sara’s real income falls from 4 smoothies to 3 smoothies. Sara’s real income in
terms of smoothies is equal to her money income divided by the price of a smoothie.
b. Sara’s real income falls from 4 bags of popcorn to 3 bags of popcorn. Sara’s real
income in terms of popcorn is equal to her money income divided by the price of a
4. What is the e-ect of the fall in Sara’s income on the relative price of a
smoothie in terms of popcorn? What is the slope of Sara’s new budget line if it
is drawn with smoothies on the x-axis?
The relative price of a smoothie is 1 bag of popcorn per smoothie, the same
relative price as before her income fell. The relative price does not depend on
Sara’s income. Instead the relative price of a smoothie is the price of a smoothie
126
W H A T I S E C O N O M I C S ? 1 2 7
The slope of the budget line, when smoothies are plotted on the x-axis is minus 1,
5. Sara’s income is $12 a week. The price of popcorn rises from $3 to $6 a bag,
and the price of a smoothie is unchanged at $3. Explain how Sara’s budget
line changes with smoothies on the x–axis.
The budget line rotates inward around the unchanged x intercept. The magnitude
of the slope of the budget line is equal to the relative price of a smoothie. The
6. Draw Fgures that show your indi-erence curves
for the following pairs of goods. For each pair,
are the goods perfect substitutes, perfect
complements, substitutes, complements, or
unrelated?
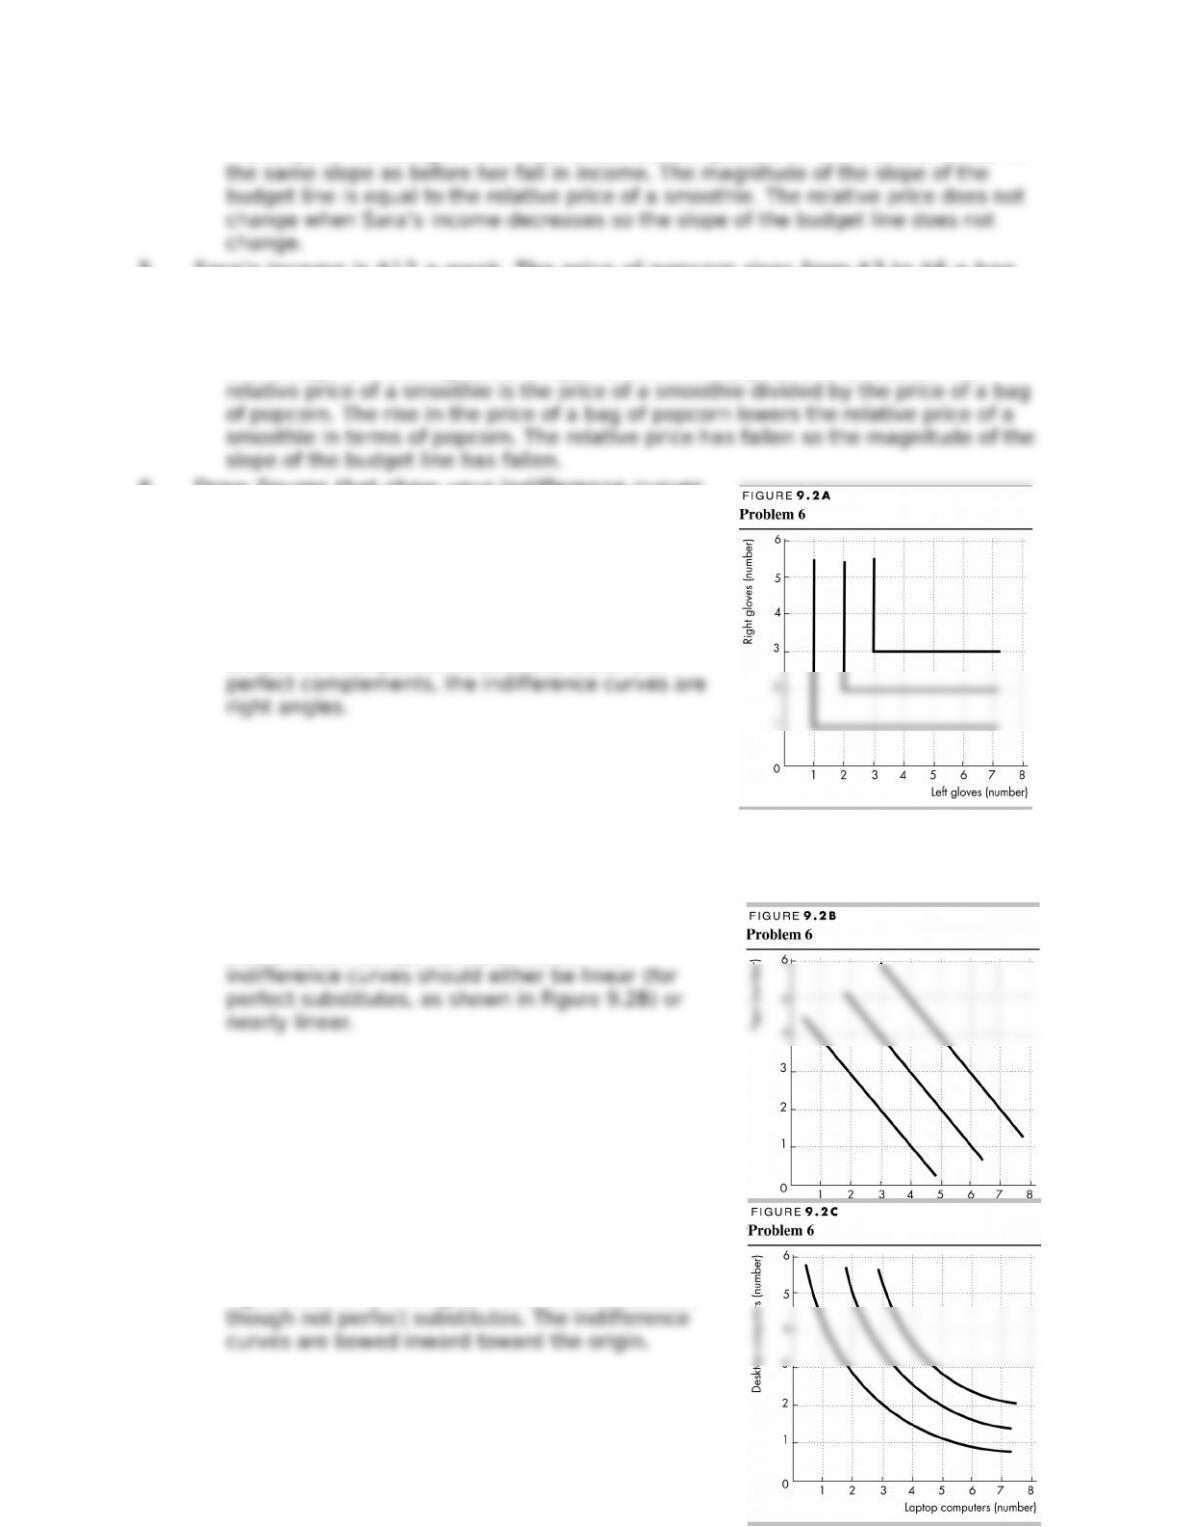
Right gloves and left gloves
Figure 9.2A is to the right. Right gloves/left gloves
are perfect complements. Because these are
Coca-Cola and Pepsi
Figure 9.2B is to the right. These are, for most
students, almost perfect substitutes. The
Desktop computers and laptop computers
Figure 9.2C is to the right. These are substitutes,
127
1 2 8
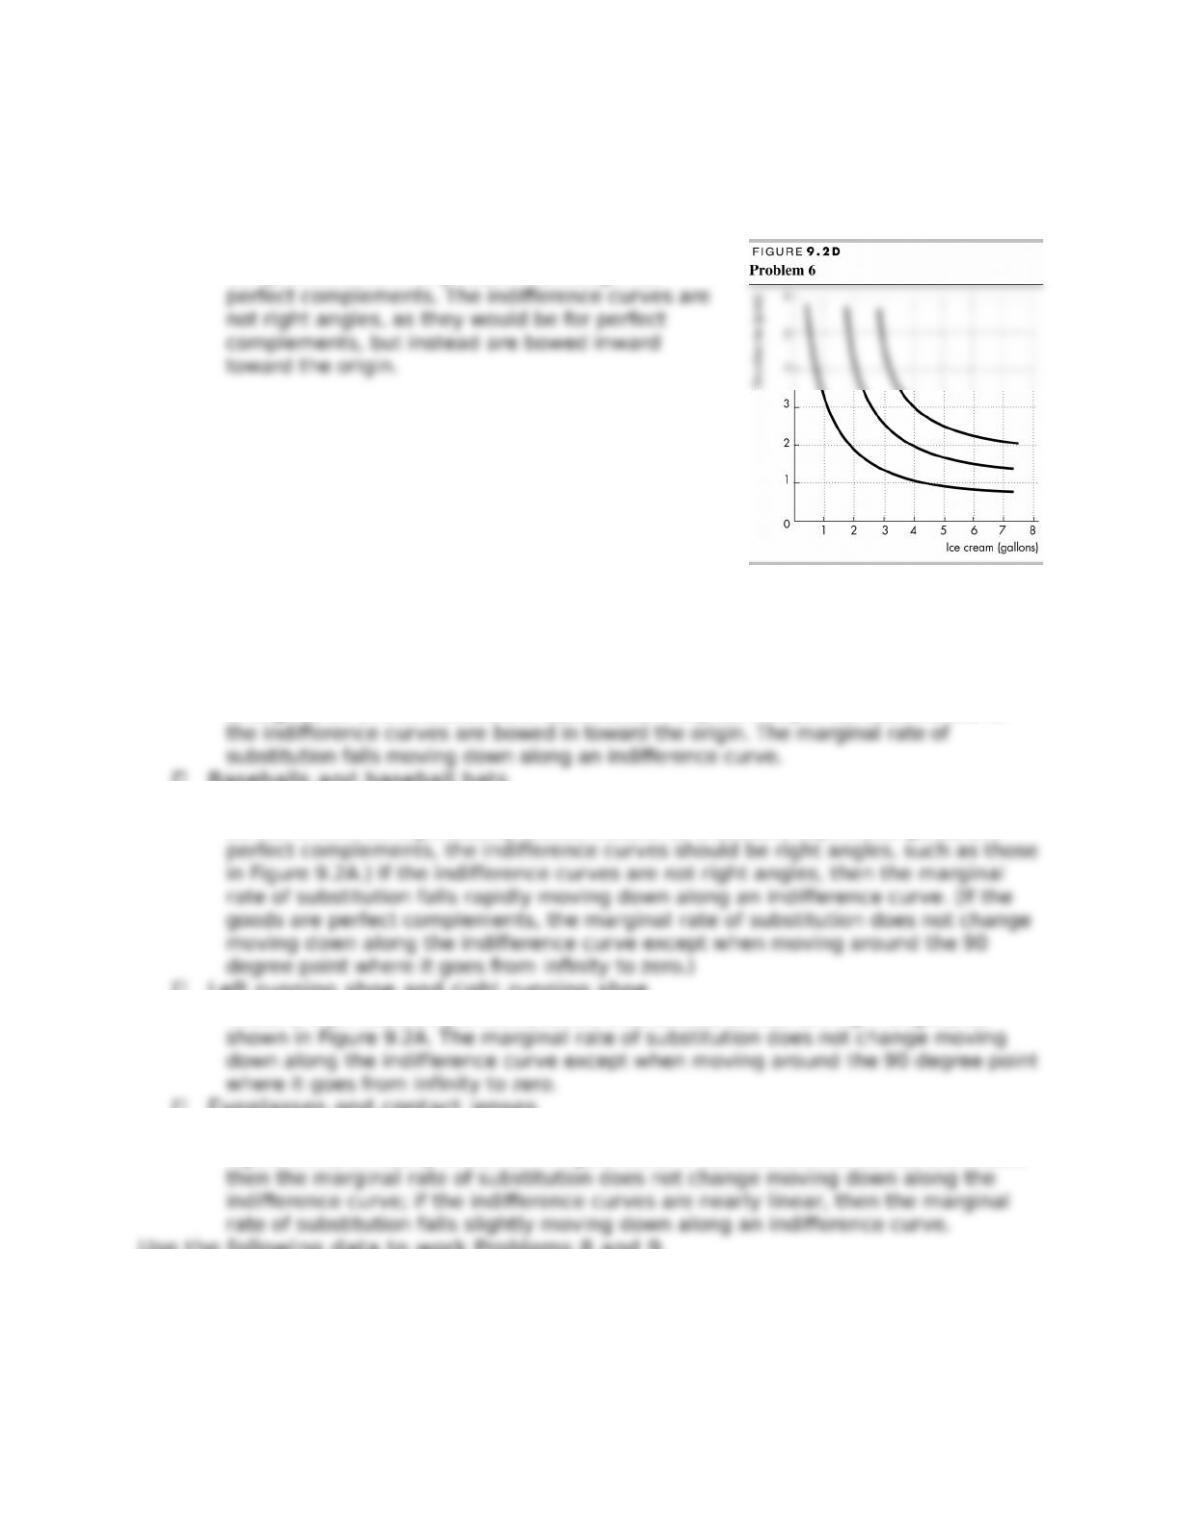
Strawberries and ice cream
Figure 9.2D is to the right. These are probably
complements for many students, though not
7. Discuss the shape of the indi-erence curve for each of the following pairs of
goods. Explain the relationship between the shape of the indi-erence curve
and the marginal rate of substitution as the quantities of the two goods
change.
Orange juice and smoothies
Orange juice and smoothies are substitutes. They are not perfect substitutes, so
Baseballs and baseball bats
These are complements but probably not perfect complements. The indi-erence
curves should be signiFcantly bowed inward. (If a student says these goods are
Left running shoe and right running shoe
These are perfect complements so the indi-erence curves are right angles, as
Eyeglasses and contact lenses
The indi-erence curves should either be linear (for perfect substitutes, as shown in
Figure 9.2B) or nearly linear as in Figure 9.2C. If the indi-erence curves are linear,
Use the following data to work Problems 8 and 9.
Pam has made her best a-ordable choice of cookies and granola bars. She spends
all of her weekly income on 30 cookies at $1 each and 5 granola bars at $2 each.
Next week, she expects the price of a cookie to fall to 50¢ and the price of a
granola bar to rise to $5.
128
W H A T I S E C O N O M I C S ? 1 2 9
8. a. Will Pam be able to buy and want to buy 30 cookies and 5 granola bars next
week?
Pam can still buy 30 cookies and 5 granola bars. When Pam buys 30 cookies at $1
each and 5 granola bars at $2 each, she spends $40 a week. Now that the price of
a cookie is 50 cents and the price of a granola bar is $5, 30 cookies and 5 granola
b. Which situation does Pam prefer: cookies at $1 and granola bars at $2 or
cookies at 50¢ and granola bars at $5?
Pam prefers cookies at 50 cents each and granola bars at $5 each because she
can get onto a higher indi-erence curve than when cookies are $1 each and
granola bars are $2 each. To see why Pam can move to a higher indi-erence curve,
note that the new budget line and the old budget line both pass through the point
30 cookies and 5 granola bars. If granola bars are plotted on the x-axis, the
9. a. If Pam changes how she spends her weekly income, will she buy more or
fewer cookies and more or fewer granola bars?
Pam will buy more cookies and fewer granola bars. The new budget line and the
old budget line pass through the point at 30 cookies and 5 granola bars. If granola
b. When the prices change next week, will there be an income e-ect, a
substitution e-ect, or both at work?
There will be a substitution e-ect and an income e-ect. A substitution e-ect arises
when the relative price changes and the consumer moves along the same
Use the following information to work Problems 10 and 11.
Boom Time For “Gently Used” Clothes
Most retailers are blaming the economy for their poor sales, but one store chain
that sells used name-brand children’s clothes, toys, and furniture is boldly
declaring that an economic downturn can actually be a boon for its business. Last
year, the company took in $20 million in sales, up 5% from the previous year.
Source: CNN, April 17, 2008
10.a. According to news clip, is used clothing a normal good or an inferior good? If
the price of used clothing falls and income remains the same, explain how
129
1 3 0
the quantity of used clothing bought changes.
According to the article, the demand for used clothing increases when the
b. Describe the substitution e-ect and the income e-ect that occur.
The price fall creates both a substitution e-ect and an income e-ect. The
substitution e-ect leads to an increase in the quantity of used clothing demanded.
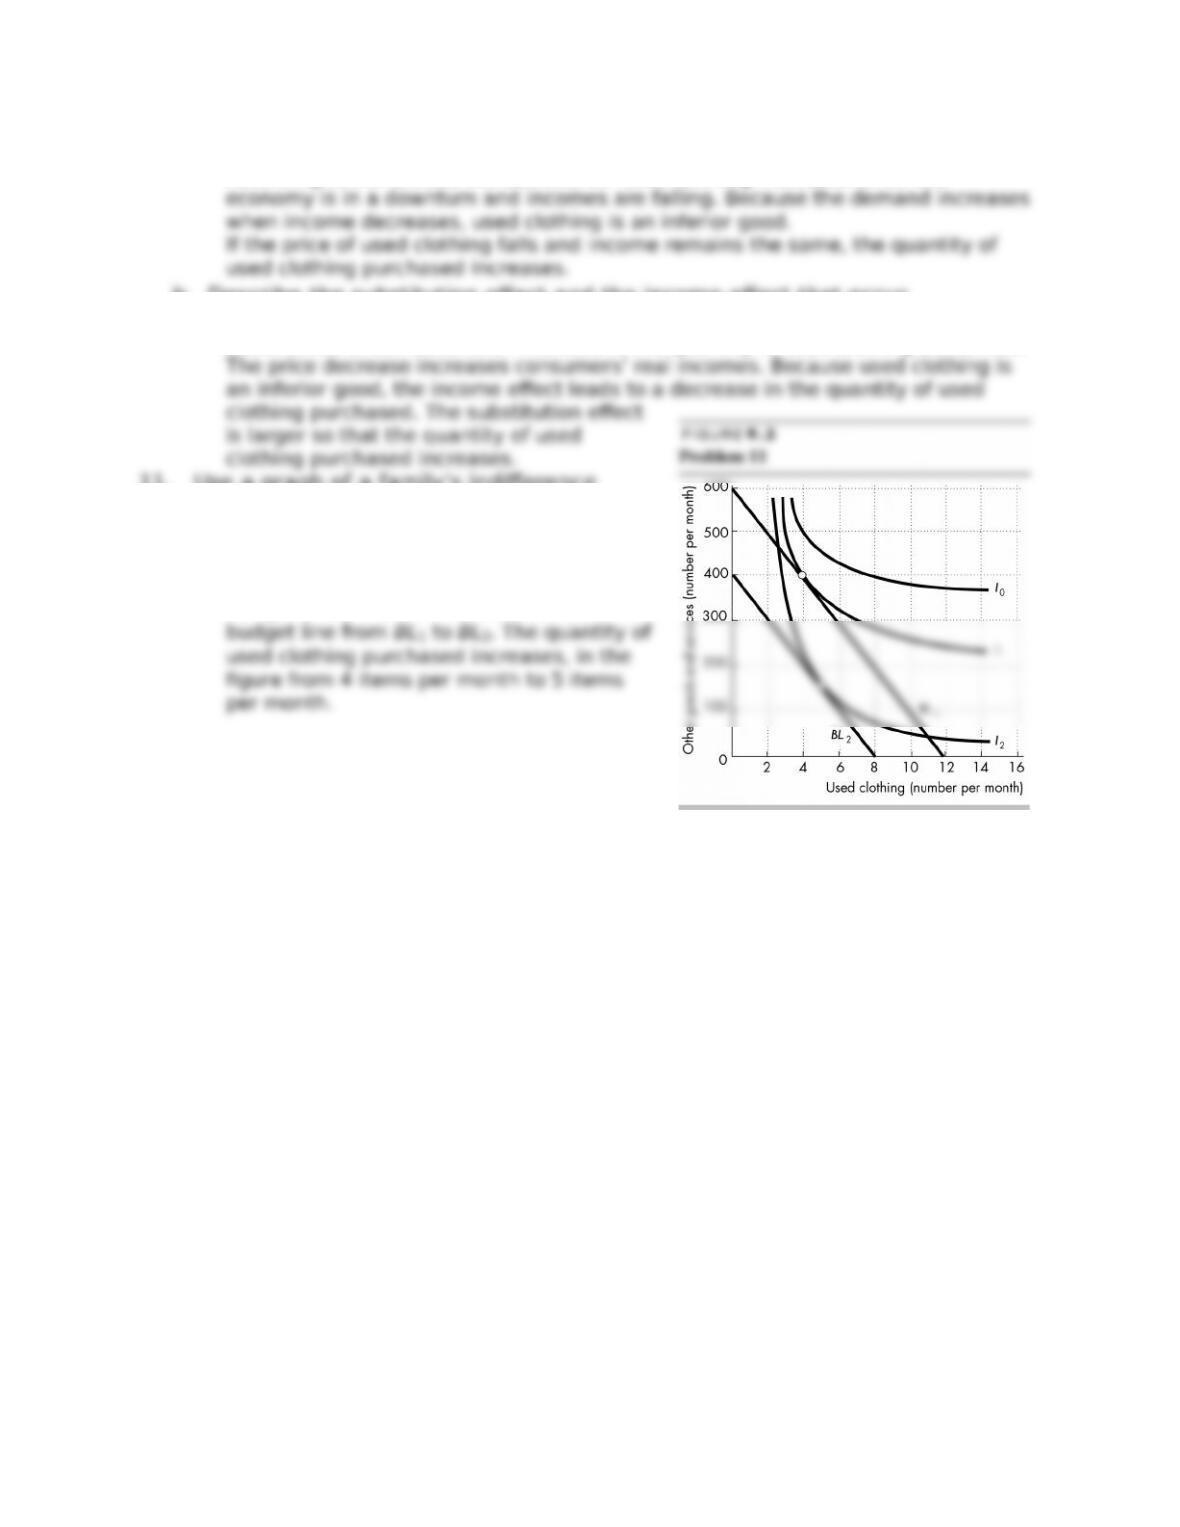
11. Use a graph of a family’s indi-erence
curves for used clothing and other goods.
Then draw two budget lines to show the
e-ect of a fall in income on the quantity of
used clothing purchased.
In Figure 9.3, the fall in income shifts the
130