
8 2
T h e B i g P i c t u r e
Where we have been:
Chapter 8 uses marginal utility theory to derive the downward-sloping demand
curve introduced in Chapter 3 (and used throughout Chapters 4 to 7). Utility
theory will also further explain the factors that change demand. Consumer
surplus has been used in multiple chapters and will be reinforced in this
chapter to help explain the diamond-water paradox and the di”erence
between total utility and marginal utility.
Where we are going:
Chapter 9 presents a parallel analysis of the consumer problem using
indi“erence curves. Each chapter is self-contained, so either can be omitted.
Marginal analysis is used in this chapter to describe marginal utility and the
utility maximizing choice for consumers. The importance of marginal analysis
will be reinforced in future chapters as we move through pro)t maximization
and choice making in factor markets. Chapter 19, which deals with risk, uses
some of the concepts from this chapter, although Chapter 19 also is
self-contained.
N e w i n t h e T w e l f t h E d i t i o n
The chapter introduction has been updated to focus on sugary drink consumption.
The data in the case study on maximizing utility from downloading music have
been updated. A new Worked Problem has been added. The Worked Problem
presents Jake’s income and his marginal utility schedules for songs and cookies. It
then shows the students how to calculate Jake’s utility-maximizing combination of
cookies and songs and how this combination changes when the price of a song
rises. To include the new Worked Problem without lengthening the chapter, some
problems have been removed from the Study Plan Problem and Applications.
These problems are in the MyEconLab and are called Extra Problems.
8UTILITY AND
DEMAND
C h a p t e r
82
L e c t u r e N o t e s
Utility and Demand
Economists assume that people behave to make themselves as well o” as possible.
Consumption possibilities tell us what the consumer can a”ord to buy given a limited
income and the prices of the goods and services they are considering.
Preferences are re5ected in the discussion of utility maximization
I. Consumption Choices
Consumption possibilities are all the things a consumer can a”ord to buy.
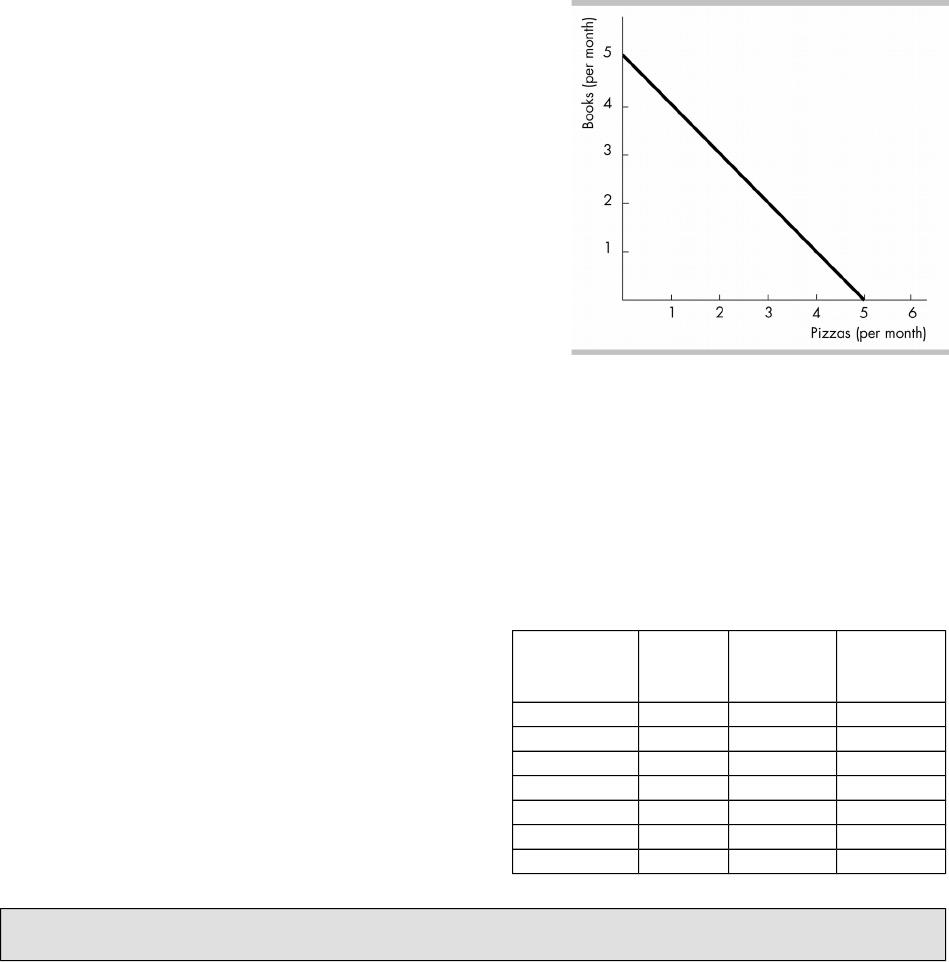
The Budget Line
The limits of consumption possibilities are
illustrated with a budget line.
The budget line marks the boundary between
those combinations of goods and services that
the consumer can a”ord to buy and those
that it cannot a”ord.
The budget line shown illustrates the possible
combinations of pizza and books that a
consumer with $50 income could purchase if
the price of pizzas were $10 and the price of
books were $10.
The budget line constrains choices: Points on
the budget line and inside the budget line are
a”ordable and within the consumer’s
consumption possibilities. Points beyond the
budget line are not a”ordable.
Changes in Consumption Possibilities
Consumption possibilities change when income or prices change.
An increase in income shifts the budget line rightward without changing its slope.
A change in the price of one of the goods changes the intercept on its axis and
changes the slope of the budget line.
These changes are used again in the alternate consumer choice model in chapter 9.
Preferences
The choice a consumer makes depends on preferences.
Total utility
Total utility is the total bene)t that a
person gets from the consumption of
goods and services. As more of a good
or service is consumed, total utility
increases.
The table provides an example of utility
from consuming movies and paperback
books in a given week.
Where do the utility numbers come from? Year after year, you will get this question
from the curious student. While the numbers for utility are ordinal rather than cardinal,
Quantity
of movies
Total
utility
Quantit
y
of books
Total
utility
0 0 0 0
1 24 1 20
2 44 2 30
3 72 3 38
4 80 4 44
5 84 5 48
6 86 6 50
using those terms to explain utility to undergraduates will generally result only in many
blank stares. To help with one answer to this question, try the following story: Lisa likes
movies and books. We tell Lisa that we’re going to call the utility she gets from 1 movie a
month 24 units of utility. Then we ask her to tell us, using the same scale, how much she
would like 2, 3, or more movies, and 1, 2, 3, or more books.
Marginal Utility
Marginal utility is the change in total utility
that results from a one-unit increase in the
quantity of a good consumed. The table shows
the marginal utility from movies.
When a good generates value, it has a positive
marginal utility. Total utility increases as the
quantity consumed increases.
Diminishing Marginal Utility
Diminishing marginal utility is the principle
that as more of a good or service is consumed,
its marginal utility decreases. In the table the
marginal utility diminishes as more movies are consumed.
II. Utility-Maximizing Choice
A consumer’s choices in5uence the total level of his or her utility because di”erent
combinations of goods generate di”erent amounts of utility. The key assumption of
marginal utility theory is that the household consumes the combination that
maximizes its utility.
We have to combine the constraint imposed by the budget line with the consumer’s
preferences to )nd the combination of products that gives the consumer the
maximum available utility.
Consumer Equilibrium
Consumer equilibrium occurs when a situation in which a consumer has allocated all
available income in a way that maximizes utility given the prices of the products.
A Spreadsheet Solution
The most direct way to )nd the quantity
of goods and services is to make a table
with the choices available. Suppose the
price of a movie is $8, the price of a
book is $4, and the consumer has
income of $24.
Calculate the combinations of
products that exhaust the available
income given the prices of the
goods. In the table, the consumer
can a“ord (3 movies/0 books), (2
movies/2 books), (1 movie/4 books), and (0 movies/6 books). While the consumer
can also a”ord the combinations of products inside the budget line, the smaller
quantities associated with those points would have less utility than the points on
the budget line.
Quantity
of movies
Total
utility
Marginal
utility
0 0
24
1 24
20
2 44
18
3 72
8
4 80
Quantity
of movies
Total
utility
Quantit
y
of books
Total
utility
0 0 0 0
1 24 1 20
2 44 2 30
3 72 3 38
4 80 4 44
5 84 5 48
6 86 6 50
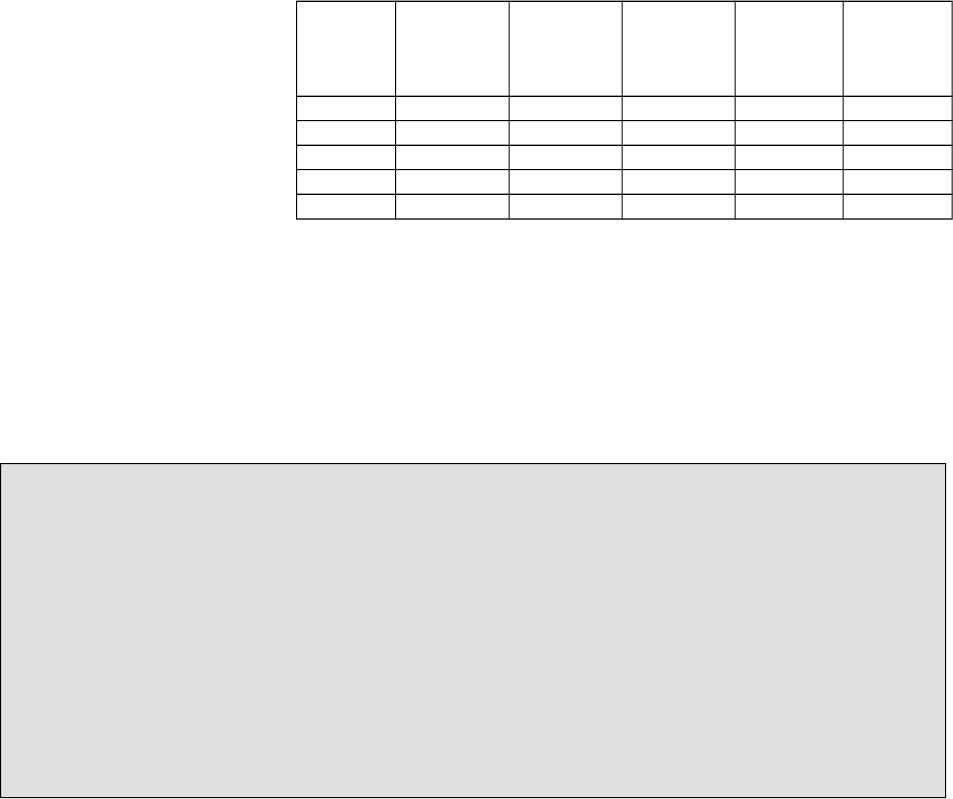
From the utility )gures given for each product, calculate the total utility from the
combination of the two products. In the same order as the a”ordable
combinations above, these total utilities are 72, 74, 68, and 50. Emphasize that it
is total utility from the combination of the two products that the consumer is
trying to maximize.
Select the combination that gives the maximum total utility, (2 movies/2books
for total utility of 74) in this case.
While in a model we might calculate the total utility from all the possible
combinations of products and then select the combination with the highest utility,
this is not a likely approach for consumers in practice.
A more natural way to )nd the consumer equilibrium is to use marginal analysis to
make the decision.
Choosing at the Margin
A consumer’s utility is maximized when the consumer spends all available income
and equalizes marginal utility per dollar for all goods. The marginal utility per
dollar is the marginal utility from a good divided by its price.
If the consumer is
left with money to
spend,
opportunities for
increasing utility
are left unused, so
the consumer can
only be
maximizing utility
when all available
income is spent.
The table to the right has the marginal utility schedules that are computed from the
total utility schedules in the table above. (The marginal utilities are the averages of
the two adjacent marginal utilities for each quantity.) Given the price of a movie of
$8, the price of a paperback book of $4, the table also has the marginal utility per
dollar schedules. Assume the consumer has $24 to allocate between movies and
books. To maximize utility, the individual buys 2 movies and 2 books because that
combination of movies and books spends all the available income and sets the
marginal utility per dollar from a movie equal to that from a book. (Both equal 2.25.)
Do people really calculate and compare marginal utilities and prices? One of the
challenges in teaching the marginal utility theory is getting the students to appreciate the
fundamental role of a model of choice. The goal is to predict choices, not to describe the
thought processes that make them. Gary Becker has made the following point, updating the
reference to the pitcher (from Parkin, Economics, )rst edition, 1990, p. 154): Justin
Verlander (or substitute a currently hot pitcher) unanimously won the 2011 Cy Young award
for the American League. He e”ectively knows all the laws of motion, of hand-eye
coordination, about the speed of the bat and ball, and so on. He’s in fact solving a
complicated physics problem when he steps up to pitch, but obviously he doesn’t have to
know physics to do that. Likewise, when people solve economic problems rationally they’re
really not thinking, “Well, I have this budget and I read this textbook and I look at my
marginal utilities and the prices and determine what maximizes my utility.” People don’t do
that, but it doesn’t mean they’re not being rational. Just because a Cy Young Award winner
isn’t Albert Einstein doesn’t mean he can’t make rational decisions about pitching.
Quantit
y of
movies
Marginal
utility
Marginal
utility
per
dollar
Quantity
of books
Margina
l
utility
Margina
l utility
per
dollar
1 22 2.75 1 15 4.75
2 18 2.25 2 9 2.25
3 13 1.63 3 7 1.75
4 6 0.75 4 5 1.25
5 3 0.38 5 3 0.75

The rule to spend all income and equalize marginal utility per dollar from each good
maximizes utility because anytime the marginal utility per dollar from one good
exceeds that of another good, the consumer can increase his or her total utility by
spending a dollar less on the good with the lower marginal utility per dollar and
spending the dollar on the good with the higher marginal utility per dollar.
Counterexamples can help. To help the students see that maximizing total utility
requires equalizing the marginal utility per dollar on each good, work with the case when
they are not equal. Suppose the marginal utility per dollar from a movie is 20 and the
marginal utility per dollar from a soda is 10. Ask “If you gained an additional dollar, what
would you spend it on and by how much would your total utility increase?” The students will
spend it on movies and their total utility will rise by 20. Now ask the students “If you lost a
dollar, what you cut back on and how much would your total utility decrease?” The students
will cut back on sodas and their total utility will fall by 10. Now tell the students that they
can gain a dollar by cutting back a dollar on sodas. Ask them the net change in their total
utility, which is +10. The point to make is that anytime the marginal utility per dollar from
one good di”ers from that for another good, consumption can be rearranged by cutting
back on the good with the low marginal utility per dollar and spending the dollar on the
good with the high marginal utility per dollar and increasing total utility.
Why don’t consumers simply choose the goods with the highest marginal utility?
Students will )nd it relatively easy to simply memorize the rule that maximizing utility
requires that the marginal utility per dollar is equal across all goods, but, intuitively,
students still often expect marginal utility to be the only determinant of utility
maximization. To provide some additional intuition, ask them to think about two goods
they’re trying to choose between, like a new shirt and a new download of a song. Say a new
shirt would have a marginal utility of 20, while the download would have a marginal utility
of 1. The price of a new shirt is $30, while the price of the download is $1. Should you
purchase the new shirt because it has a higher marginal utility? No! You may prefer the
shirt, but it costs thirty times as much as the download. Even though the download has the
lower marginal utility, it has a higher marginal utility per dollar (1 as opposed to 2/3).
The Power of Marginal Analysis
The goal of maximizing utility does not require a computer and spreadsheet, but
simply comparing the marginal utility per dollar of each of the products.
In the example the person’s choice between movies and books, the person
maximizes his or her utility where the marginal utility per dollar from movies is
equal to the marginal utility per dollar from books. Mathematically, this is
represented by the equation:
MUMovie
P
Movie
=MUBook
P
Book
.
Other applications of marginal reasoning. Help your students to appreciate that
marginal reasoning is one of the most important tools for understanding the economic
perspective. Remind them that we have been using marginal reasoning for many chapters
now: In Chapter 2 we derived the marginal cost of production from the PPF. In Chapter 5 we
discovered that competitive equilibrium is eOcient because marginal social bene)t (from
the demand curve) equals the marginal social cost (from the supply curve). In this chapter,
we discover that equating the marginal utility per dollar across all goods and services

maximizes a consumer’s utility. More generally, marginal analysis shows that if the
marginal gain from an action exceeds the marginal loss, take the action.
Revealing Preference
We don’t have to ask a consumer to state preferences because we can )gure them
out by observing what is purchased at various prices.
The units we use to measure preference don’t matter. Any arbitrary unit will work;
for instance, if utility is multiplied by 2, the marginal utility per dollar equation
shows that the equilibrium consumption bundle does not change.
III. Predictions of Marginal Utility Theory
Marginal utility theory predicts the law of demand. It also predicts that a decrease in the
price of a substitute good increases the demand for the good; and, for a normal good,
an increase in income increases demand.
A Fall in the Price of a Movie
A Change in the Quantity Demanded
If the price of a good falls and other things remain the same, the marginal utility per
dollar from that good rises. As a result, the consumer increases his or her purchases
of that good in order to maximize utility. (As more of the good is purchased, its
marginal utility decreases; as less of other goods are purchased, their marginal
utilities increase. Eventually the consumer reaches a new equilibrium at which the
marginal utility per dollar for all the goods is equal.)
A Change in Demand
When the price of a good falls, it will have an impact on the demand for related
goods (substitutes and complements in consumption). In the example above, when
movie prices fall, the demand for paperback books decreases, implying that movies
and books are substitute goods.
A Rise in Income
If a consumer’s income increases, the consumer will reach a new consumer
equilibrium in which all the income is spent and the marginal utility per dollar from
all goods is equal. Marginal utility theory predicts that as the consumer’s income
increases, the demand for normal goods increases and the demand for inferior
goods decreases.
Paradox of Value
The paradox of value is that water, which is essential to life, costs little, but
diamonds, which are useless in comparison to water, are expensive.
The resolution to this paradox comes from distinguishing total utility from marginal
utility. The total utility from water is much more than from diamonds. But we have so
much water that its marginal utility is small. And we have so few diamonds that
their marginal utility is high. When a household maximizes its utility, it makes the
marginal utility per dollar equal for all goods. Because diamonds have a high
marginal utility, they have a high price. Because water has a low marginal utility, it
has a low price.
Consumer surplus also can be used to resolve the paradox as well. The consumer
surplus from consuming water is vast but the consumer surplus from consuming
diamonds is small.

Temperature as an Analogy
Temperature and utility are both abstract concepts.
The concept of utility allows economists to make predictions about human choices
just as temperature allows predictions of physical phenomena.
Utility may not be as precise a thermometer in making some types of predictions but
is still useful.
An Economics in Action case considers the utility from recorded music and concludes that
the availability and convenience of downloading individual songs increases consumer
surplus. The utility from playing an album is greater using a CD, so most albums are played
on CDs.