South Korea to Resume U.S. Beef Imports
South Korea will reopen its market to most U.S. beef. South Korea banned imports
of U.S. beef in 2003 amid concerns over a case of mad cow disease in the United
States. The ban closed what was then the third-largest market for U.S. beef
exporters.
Source: CNN, May 29, 2008
17.a. Explain how South Korea’s import ban on U.S. beef a-ected beef producers
and consumers in South Korea.
The South Korean ban raised the price of beef in South Korea. The higher price led
b. Draw a graph of the market for beef in South Korea to illustrate your answer
to part (a). Identify the changes in consumer surplus, producer surplus, and
deadweight loss.
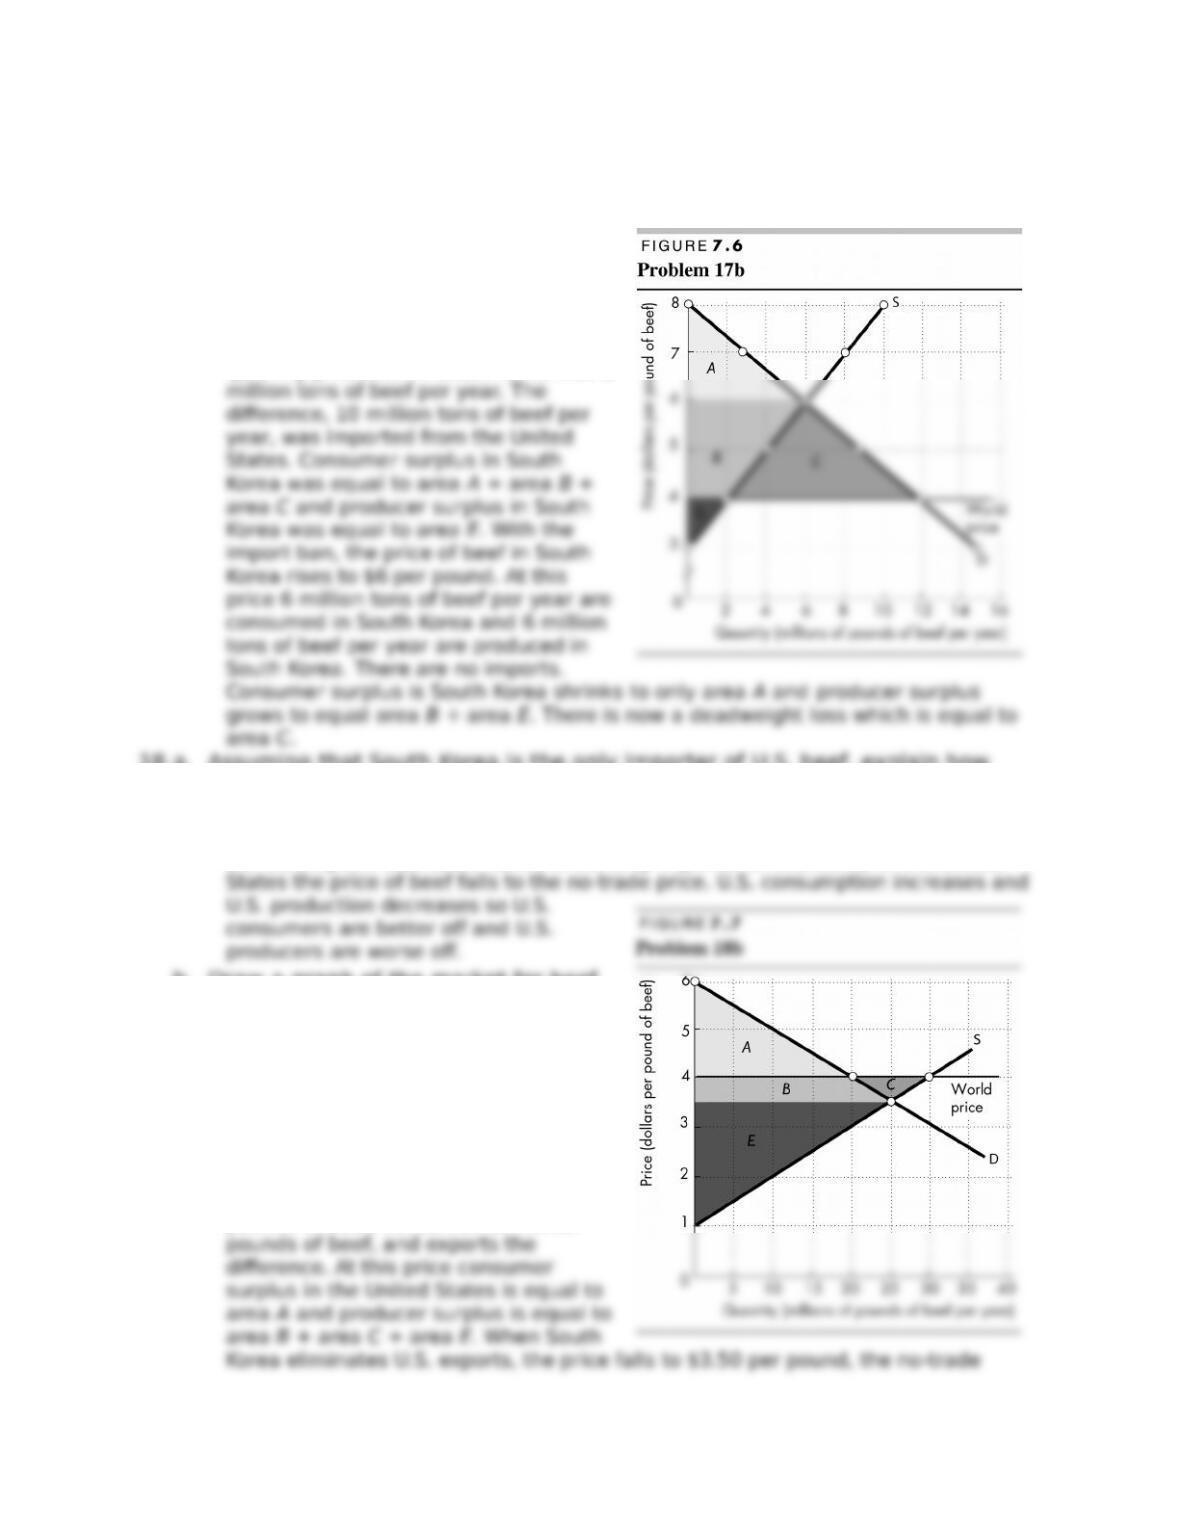
Figure 7.6 shows the e-ect of South
Korea’s import ban. Prior to the ban the
price of beef in South Korea was $4 per
pound. At this price the quantity
consumed in South Korea was 12
million tons of beef per year and the
quantity produced in South Korea was 2
18.a. Assuming that South Korea is the only importer of U.S. beef, explain how
South Korea’s import ban on U.S. beef a-ected beef producers and
consumers in the United States.
South Korea’s ban meant that the United States no longer exported beef. (Recall
the assumption that South Korea is the only importer of U.S. beef.) In the United
b. Draw a graph of the market for beef
in the United States to illustrate your
answer to part (a). Identify the
changes in consumer surplus,
producer surplus, and deadweight
loss.
Figure 7.7 shows the situation in the
U.S. market for beef. With trade the
price of beef is $4 per pound. The
United States produces 30 million
pounds of beef, consumes 20 million

Use the following information to work Problems 19 to 21.
Before 1995, trade between the United States and Mexico was subject to tari-s. In
1995, Mexico joined NAFTA and all U.S. and Mexican tari-s have gradually been
removed.
19. Explain how the price that U.S. consumers pay for goods from Mexico and the
quantity of U.S. imports from Mexico have changed. Who are the winners and
who are the losers from this free trade?
With NAFTA, the prices that U.S. consumers pay for goods from Mexico have fallen
and, as a result, the quantity of imports from Mexico have increased. Winners from
20. Explain how the quantity of U.S. exports to Mexico and the U.S. government’s
tari- revenue from trade with Mexico have changed.
The prices of U.S. goods in Mexico have fallen and, as a result, the quantity of U.S.
21. Suppose that in 2015 tomato growers in Florida lobby the U.S. government to
impose an import quota on Mexican tomatoes. Explain who in the United
States would gain and who would lose from such a quota.
Use the following information to work Problems 22 and 23.
Suppose that in response to huge job losses in the U.S. textile industry, Congress
imposes a 100 percent tari- on imports of textiles from China.
22. Explain how the tari- on textiles will change the price that U.S. buyers pay for
textiles, the quantity of textiles imported, and the quantity of textiles
produced in the United States.
The tari- raises the U.S. price of textiles. As a result, the quantity of textiles
23. Explain how the U.S. and Chinese gains from trade will change. Who in the
United States will lose and who will gain?
The decrease in trade means that the U.S. and Chinese gains from trade decrease.
Use the following information to work Problems 24 and 25.
With free trade between Australia and the United States, Australia would export
beef to the United States. But the United States imposes an import quota on
Australian beef.
24. Explain how this quota inAuences the price that U.S. consumers pay for beef,
the quantity of beef produced in the United States, and the U.S. and the
Australian gains from trade.
The quota raises the price of beef in the United States. By raising the U.S. price,
the quota increases the quantity of beef produced in the United States and
25. Explain who in the United States gains from the quota on beef imports and
who loses.
26. Trading Up
The cost of protecting jobs in uncompetitive sectors through tari-s is high:
Saving a job in the sugar industry costs American consumers $826,000 in
higher prices a year; saving a dairy industry job costs $685,000 per year; and
saving a job in the manufacturing of women’s handbags costs $263,000.
Source: The New York Times, June 26, 2006
a. What are the arguments for saving the jobs mentioned in this news clip?
Explain why these arguments are faulty.
The arguments for saving these jobs are (explicitly) the argument that protection
saves jobs and (implicitly) that protection allows us to compete with cheap foreign
labor.
b. Is there any merit to saving these jobs?
There is merit to the workers whose jobs are saved and who might not receive any
Economics in the News
27. After you have studied Economics in the News on pp. 168–169, answer the
following questions.
a. What is the TPP?
b. Who in the United States would beneDt and who would lose from a
successful TPP?
U.S. exporters of goods whose tari-s are reduced and U.S. consumers of imported
goods whose tari-s are reduced beneDt from a successful TPP. U.S. consumers of
c. Illustrate your answer to part (b) with an appropriate graphical analysis
assuming that tari-s are not completely eliminated.
Figure 7.8a (on the next page) shows the e-ect in the United States of lowering the
U.S. tari- on a good. Initially the price in the United States was $90 per unit.
Consumer surplus was equal to area A and producer surplus was equal to area B +
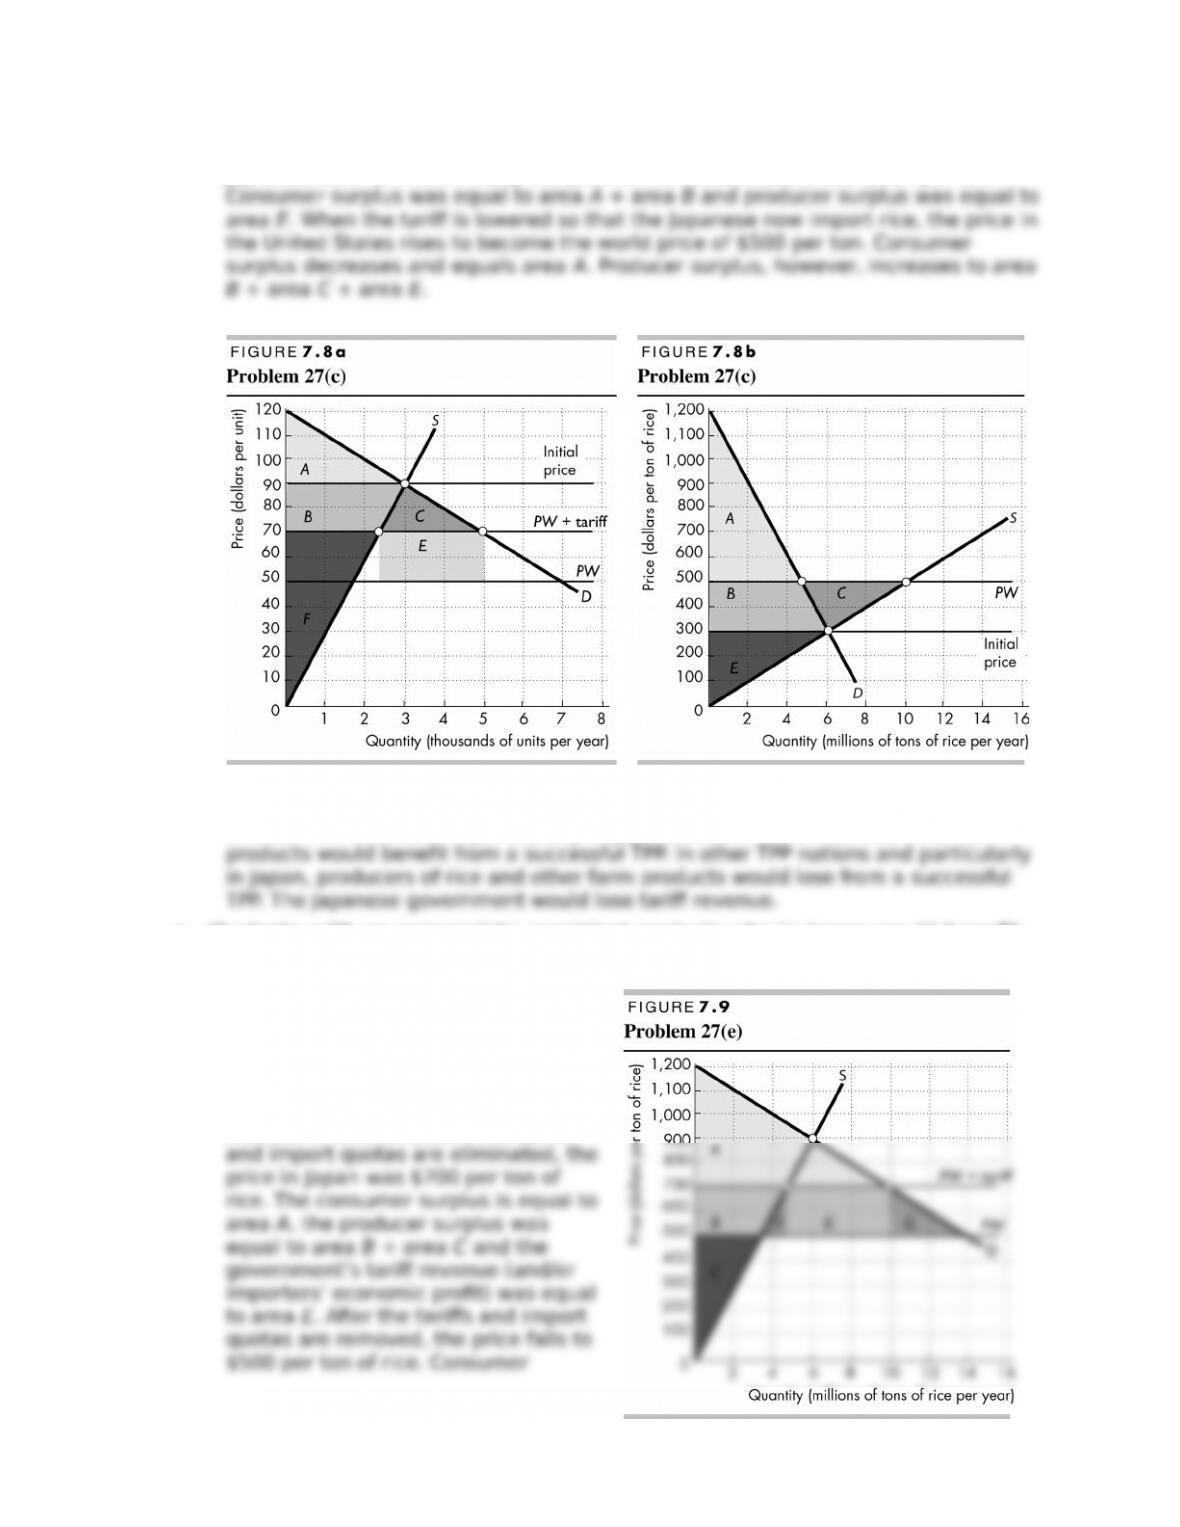
Figure 7.8b (on the next page) shows the e-ect in the United States of lowering the
Japanese tari- on rice. Initially the price in the United States was $300 per ton.
d. Who in Japan and other TPP nations would beneDt and who would lose from
a successful TPP?
In other TPP nations and particularly in Japan, consumers of rice and other farm
e. Illustrate with an appropriate graphical analysis who in Japan would beneDt
and who would lose from a successful TPP assuming that all Japan’s import
quotas and tari-s are completely
eliminated.
Figure 7.9 shows the e-ect in Japan of
eliminating Japan’s tari-s and import
quotas. Figure 7.9 shows the e-ect in
the market for rice; the e-ect in other
markets is similar. Before the tari-s
surplus increases and equals area A + area B + area F + area E + area G.
28. E.U. Agrees to Trade Deal with South Korea
Italy has dropped its resistance to a E.U. trade agreement with South Korea,
which will wipe out $2 billion in annual duties on E.U. exports. Italians argued
that the agreement, which eliminates E.U. duties on South Korean cars, would
put undue pressure on its own automakers.
Source: The Financial Times, September 16, 2010
a. What is a free trade agreement? What is its aim?
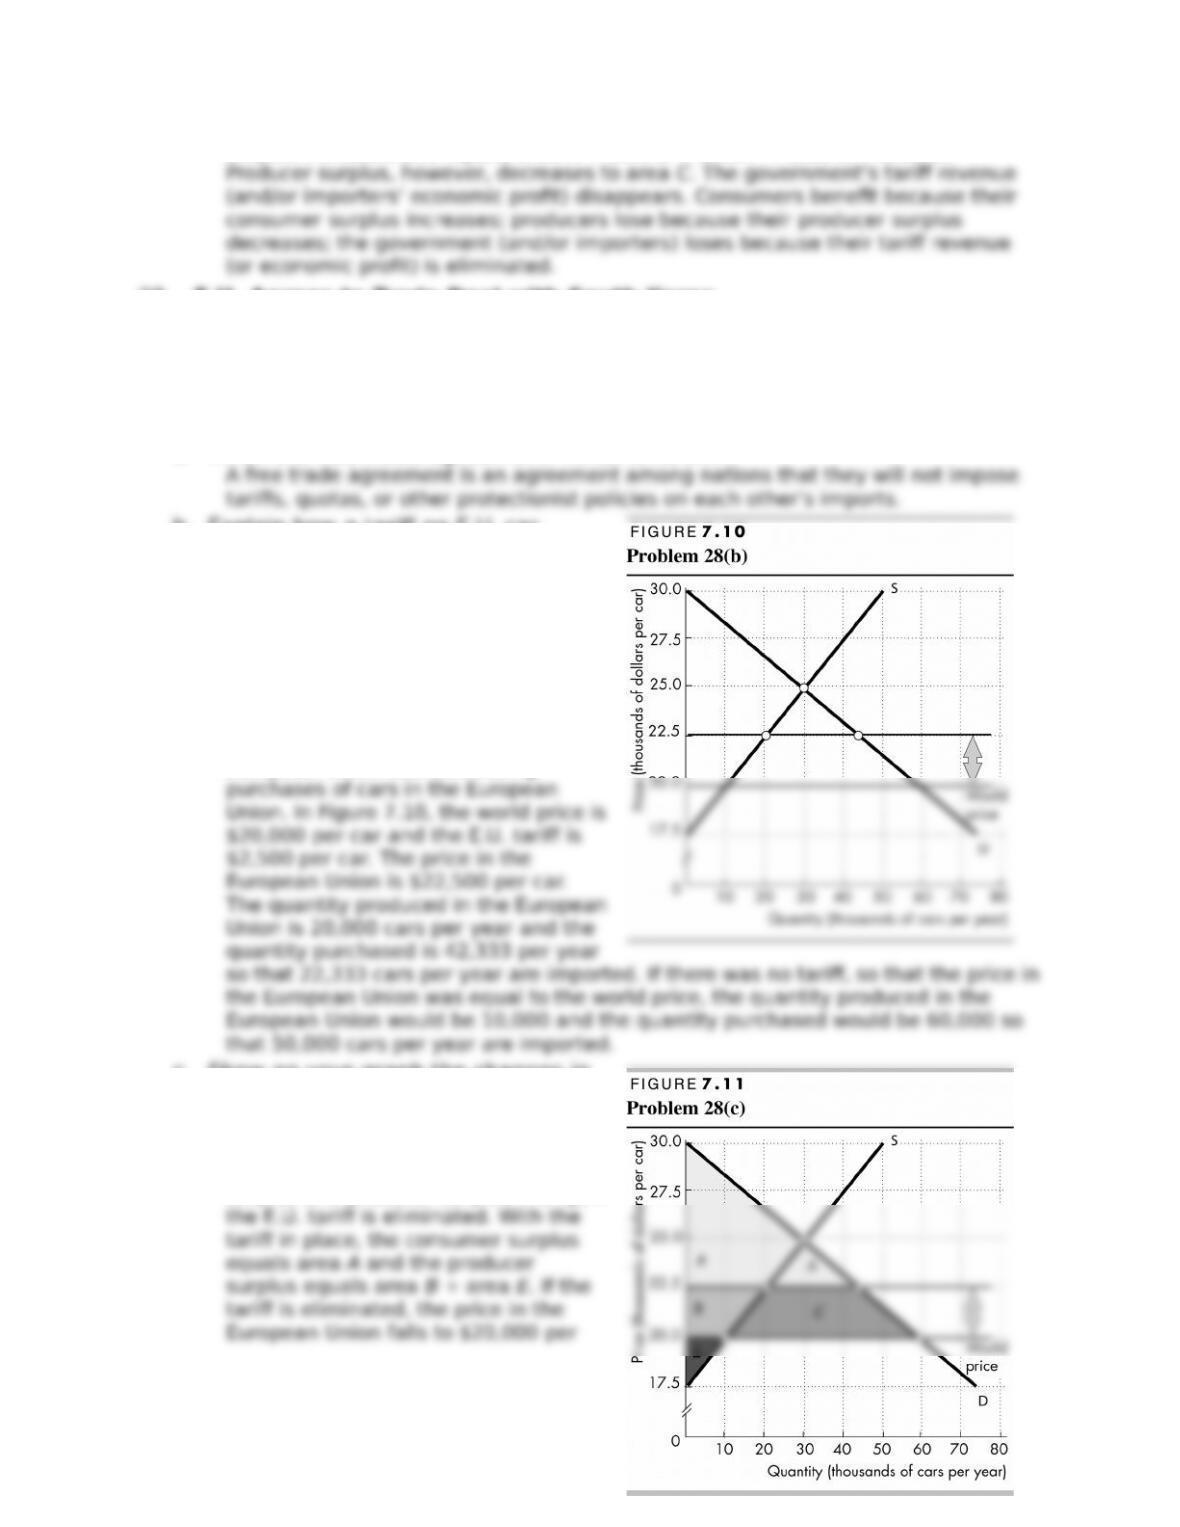
b. Explain how a tari- on E.U. car
imports changes E.U. production of
cars, purchases of cars, and imports
of cars. Illustrate your answer with
an appropriate graphical analysis.
The tari- that was imposed by the
European Union decreased E.U.
imports of cars. It raised the price of
cars in the European Union, thereby
increasing production of cars in the
European Union and decreasing
c. Show on your graph the changes in
consumer surplus and producer
surplus that result from free trade in
cars.
Figure 7.11 shows how the consumer
surplus and producer surplus change if

d. Explain why Italian automakers opposed cuts in car import tari-s.
Italian automakers opposed cuts in the tari- because they knew that if the tari-